Abstract
Abstract Aneuploidy, an abnormal chromosome number, has been linked to aging and age-associated diseases, but the underlying molecular mechanisms remain unknown. Here we show, through direct live-cell imaging of young, middle-aged, and old-aged primary human dermal fibroblasts, that aneuploidy increases with aging due to general dysfunction of the mitotic machinery. Increased chromosome mis-segregation in elderly mitotic cells correlates with an early senescence-associated secretory phenotype (SASP) and repression of Forkhead box M1 (FoxM1), the transcription factor that drives G2/M gene expression. FoxM1 induction in elderly and Hutchison–Gilford progeria syndrome fibroblasts prevents aneuploidy and, importantly, ameliorates cellular aging phenotypes. Moreover, we show that senescent fibroblasts isolated from elderly donors’ cultures are often aneuploid, and that aneuploidy is a key trigger into full senescence phenotypes. Based on this feedback loop between cellular aging and aneuploidy, we propose modulation of mitotic efficiency through FoxM1 as a potential strategy against aging and progeria syndromes.
🔬 Techniques
🔭 Microscopes
💻 Software
✨ Fluorophores
🧪 Sample Preparation
🔬 Cell Lines
🏭 Microscope Brands
🧪 Reagent Suppliers
📷 Detectors
💻 Software Details
💾 Data Repositories
🏛️ Research Organizations (ROR)
Affiliated research institutions:
📋 Methods
Cell culture
A total of 11 human fibroblast cultures, established from skin samples of Caucasian males with ages ranging from neonatal to octogenarian (two biological samples per age), were acquired from cell biobanks as summarized (Supplementary Table 1 ). Several time points over the human lifespan were included to reinforce the validity of any correlation found. All donors were reported as “healthy”, except the 8-year-old donor diagnosed with the Hutchison–Gilford progeria. HDFs were seeded at 1 × 10 4 cells per cm 2 of growth area in minimal essential medium Eagle–Earle (MEM) supplemented with 15% fetal bovine serum (FBS), 2.5 mM l -glutamine, and 1× antibiotic–antimycotic (all from Gibco, Thermo Fisher Scientific, CA, USA). Only early passage dividing fibroblasts (up to passage 3–5) with cumulative population doubling level PDL < 24 were used in all experiments. PDL = 3.32 (log UCY − log l ) + X , where UCY = the cell yield at that point, l = the cell number used to begin that subculture, and X = the doubling level of the cells used to initiate the subculture. PD = T *[ln2/ln(Xe/Xi)], where T = time interval (hours) between two consecutive cell passages, Xe = number of cells collected at culture passaging, and Xi = number of cells seeded to initiate subculture. Murine adult fibroblasts (MAFs) were cultured in Dulbecco’s modified Eagle’s medium (DMEM) supplemented with nutrient mixture F12, 10% FBS, l -glutamine, and antibiotic–antimycotic (all from Gibco). All cells were grown at 37 °C and humidified atmosphere with 5% CO 2 .
Show full methods section
Cell culture
A total of 11 human fibroblast cultures, established from skin samples of Caucasian males with ages ranging from neonatal to octogenarian (two biological samples per age), were acquired from cell biobanks as summarized (Supplementary Table 1 ). Several time points over the human lifespan were included to reinforce the validity of any correlation found. All donors were reported as “healthy”, except the 8-year-old donor diagnosed with the Hutchison–Gilford progeria. HDFs were seeded at 1 × 10 4 cells per cm 2 of growth area in minimal essential medium Eagle–Earle (MEM) supplemented with 15% fetal bovine serum (FBS), 2.5 mM l -glutamine, and 1× antibiotic–antimycotic (all from Gibco, Thermo Fisher Scientific, CA, USA). Only early passage dividing fibroblasts (up to passage 3–5) with cumulative population doubling level PDL < 24 were used in all experiments. PDL = 3.32 (log UCY − log l ) + X , where UCY = the cell yield at that point, l = the cell number used to begin that subculture, and X = the doubling level of the cells used to initiate the subculture. PD = T *[ln2/ln(Xe/Xi)], where T = time interval (hours) between two consecutive cell passages, Xe = number of cells collected at culture passaging, and Xi = number of cells seeded to initiate subculture. Murine adult fibroblasts (MAFs) were cultured in Dulbecco’s modified Eagle’s medium (DMEM) supplemented with nutrient mixture F12, 10% FBS, l -glutamine, and antibiotic–antimycotic (all from Gibco). All cells were grown at 37 °C and humidified atmosphere with 5% CO 2 .
Isolation of mouse fibroblasts
Sv/129 mice were housed and handled accordingly to European Union and MAFs were collected from ears of n > 3 sv/129 females of the same litter at their age of 8 weeks, 6 months, 1 year, 1.5 years, and 2 years. Ears were washed with phosphate-buffered saline (PBS), cut into small pieces, and incubated with 1 mg/ml collagenase D and 1 mg/ml collagenase/dispase (both from Roche Applied Science, Germany) in DMEM:F12 without FBS, for 45 min at 37 °C and 5% CO 2 . Cells were then grown on a six-well dish containing DMEM:F12, supplemented with 10% FBS and antibiotic–antimycotic.
Drug treatments
Fibroblasts were incubated for 24 h in medium containing 2 µg/ml cytochalasin D (C8273, Sigma-Aldrich, MO, USA) to block cytokinesis. To inhibit the SAC, cells were treated with 5 µM Mps1 inhibitor (AZ3146, TOCRIS, USA). To induce chronic activation of the SAC, cells were treated with 100 nM Taxol (Sigma-Aldrich, MO, USA) and 5 µM and STLC (2799-07-7, Tocris). For proteasome activity enhancement, 10 µM of Usp14 inhibitor were used (I-300, BostonBiochem, Cambridge, MA). To inhibit kinesin-5, STLC (Tocris) was used at 5 µM during 16 h, to enrich the MI for mitotic cell shake-off.
Fluorescence in situ hybridization
FISH analysis was used to measure aneusomy index (Interphase FISH; Figs. 1a , 5d , 6e , 7f and Supplementary Fig. 9e ) and chromosome mis-segregation rate (CytoD FISH; Figs. 1b , 5e , 6f and Supplementary Fig. 9f ). “Interphase FISH” measures the prevalence of somatic aneuploidy by the ratio of aneusomic cells for chromosomes 7, 12, and 18 to the total cell count for a sample ( > 2500 nuclei) (aneusomy index). “CytoD FISH” measures the rate of chromosome mis-segregation (number of events in which two sister chromatids co-segregate to the same daughter cell) by combining a cytokinesis-block assay (cytochalasin D 24 h treatment) with FISH staining. “CytoD FISH” measures the percentage of BN telophases exhibiting chromosome 7, 12, and 18 mis-segregation over the total BN cell count for a sample ( > 200 BN cells). For both Interphase and CytoD FISH, fibroblasts were grown on Superfrost™ Plus microscope slides (Menzel, Thermo Scientific, CA, USA) placed in a quadriperm dish (Sarsted, Nümbrecht, Germany). Cells were given a hypotonic shock during 30 min (0.03 M sodium citrate, Sigma-Aldrich, MO, USA), followed by fixation in ice-cold Carnoy fixative added drop-wise and incubated for 5 min. This step was repeated two more times. FISH was performed with the Vysis centromeric probes CEP7 Spectrum Aqua, CEP12 Spectrum Green, and CEP18 Spectrum Orange (Abbott Laboratories, Chicago, IL, USA) according to manufacturer’s instructions. Slides were mounted with mounting medium containing DAPI (Vectashield, Vector Laboratories, CA, USA) and scored blindly.
Apoptosis assay
Programmed cell death (apoptosis) was evaluated by flow cytometry using fluorescein isothiocyanate (FITC)-conjugated Annexin V/Apoptosis detection kit (BioLegend, Inc. San Diego, CA). Briefly, cells were washed twice in cold cell staining buffer and resuspended in 100 µL of Annexin V-binding buffer. Subsequently, 5 µL of FITC-Annexin V were added to cell suspension. Cells were incubated for 15 min in the dark, washed with Annexin V-binding buffer, and analyzed immediately by flow cytometry.
SA-β-gal assay
In fixed-cell analysis, cells were incubated for 90 min in medium with 100 nM Bafilomycin A1 (B1793, Sigma-Aldrich, MO, USA) to induce lysosomal alkalinization. Fluorogenic substrate (33 μM) for β-galactosidase, fluorescein di-β- d -galactopyranoside (F2756, Sigma-Aldrich, MO, USA) were then added to the medium, and incubation carried out for 90 min. Cells were fixed in 4% paraformaldehyde for 15 min, rinsed with PBS, and permeabilized with 0.1% Triton-X100 in PBS for 15 min. Finally, cells were counterstained with 1 µg/ml DAPI (Sigma-Aldrich, MO, USA). For FACS, cells were incubated in Bafilomycin A1 as described above and then exposed to 10 μM of fluorogenic substrate for β-galactosidase, DDAOG (9H-(1,3-dichloro-9,9-dimethylacridin-2-one-7-yl) β- d -Galactopyranoside), for 90 min (Setareh Biotech LLC, USA).
Fluorescence-activated cell sorting
FACS sorting was used to isolate subpopulations of senescent (SA-β-gal positive) live fibroblasts. FACS sorting was performed in FACSAria™ I Cell Sorter (BD Biosciences, CA, USA), using the laser line of 633 nm. All cells within a single experiment were detected using the same voltage settings and sorted using an 85 μm nozzle. Cells were initially gated by forward scatter area (FSC-A) vs. side scatter area, which excludes dead cells and subcellular debris, with subsequent exclusion of cell doublets and clumps through FSC-A vs. FSC-width plot. The signal was detected using the APC-A channel. The relative β-galactosidase activity was inferred from the median fluorescence intensity of the population. The sorting gates were designed accordingly to the respective auto-fluorescent control. Cells were sorted directly into MEM with 15% FBS and seeded in Superfrost™ Plus microscope slides for subsequent FISH analysis. Analysis of FACS data was done using FlowJo v10 software (TreeStar, Inc., Ashland, OR). Immunostaining Fibroblasts were grown on sterilized glass coverslips coated with 50 µg/ml fibronectin (F1141, Sigma-Aldrich, MO, USA). Cells were fixed in freshly prepared 4% paraformaldehyde in PBS for 20 min. Following fixation, cells were rinsed in PBS and permeabilized in PBS + 0.3% Triton-X100 for 7 min. Cells were next blocked in 10% FBS in PBS-T (PBS + 0.05% Tween-20) for 1 h and then incubated overnight at 4 °C with primary antibodies diluted in PBS-T + 5% FBS as follows: rabbit anti-53BP1 (4937, Cell Signaling Technology, MA, USA), 1:100; mouse anti-p21 (SC-6246, Santa Cruz Biotechnology, CA, USA), 1:1000; rabbit anti-FoxM1 (13147, ProteinTech Group, Inc., IL, USA), 1:1500; mouse anti-Cdc20 (SC-5296, Santa Cruz Biotechnology), 1:100; mouse anti-Cyclin B (SC-245, Santa Cruz Biotechnology), 1:1000 secondary antibodies AlexaFluor-488 and -568 (Life Technologies, CA, USA) were diluted 1:1500 in PBS-T + 5% FBS. DNA was counterstained with 1 µg/ml DAPI (Sigma-Aldrich, MO, USA). Coverslips were mounted in slides with mounting solution (90% glycerol, 0.5% N -propyl-gallate, 20 nM Tris, pH 8). Telomere PNA FISH Fibroblasts were incubated in 0.05 µg/ml colcemid (15212012, Gibco, Thermo Fisher Scientific) for 4 h, to induce metaphase arrest. Following trypsinization, fibroblasts were incubated in 0.03 M sodium citrate for 30 min at 37 °C. Cells were then fixed in freshly made Carnoy fixative solution and stored at 4 °C. Metaphase spreads were fixed with 4% formaldehyde in PBS for 2 min, followed by pepsin digestion (1 mg/ml) for 10 min at 37 °C. After a dehydration step with ethanol, dried slides were hybridized with Telomere PNA probe (Applied Biosystems, CA, USA) (0.5 µg/ml) in 10 mM Tris pH 7.5, 70% formamide, 0.25% blocking reagent (Roche, Germany), 2 mM MgCl 2 , 700 µM citric acid, 7 mM Na 2 HPO 4 , for 3 min in a hot plate at 80 °C and then for 2 h at 37 °C in humidified chamber. Slides were washed in 70% formamide, 10 mM Tris, 0.1% bovine serum albumin twice for 15 min, then washed three times in Tris-buffered saline (TBS) for 5 min, and finally mounted with mounting media containing DAPI (Vectashield, Vector Laboratories).
Phase-contrast live-cell imaging
Fibroblasts were grown in glass-bottom 35 mm µ-dishes (Ibidi GmbH, Germany), coated with 50 µg/ml fibronectin (F1141, Sigma-Aldrich, MO, USA). Images were acquired on a Zeiss Axiovert 200 M inverted microscope (Carl Zeiss, Oberkochen, Germany) equipped with a CoolSnap camera (Photometrics, Tucson, USA), XY motorized stage and NanoPiezo Z stage, under controlled temperature, atmosphere, and humidity. Neighbor fields (20–25) were imaged every 2.5 min for 2–3 days, using a ×20/0.3 numerical aperture (NA) A-Plan objective. Stitching of neighboring fields was done using the plugin “Stitch Grid” (Stephan Preibisch) from ImageJ/Fiji software.
Live-cell and fixed-cell correlative microscopy Eighty-seven-year-old fibroblasts expressing
H2B–GFP were grown in µ-Slide 2 Well ibiTreat (Ibidi GmbH) and analyzed accordingly to the experimental layout shown in Fig. 7i . Images were acquired on a Leica DMI6000b inverted microscope (Leica Microsystems, Germany), equipped with an ORCA-Flash4.0 camera (Hamamatsu, Japan), using the laser line 488 nm for the excitation of green fluorescent protein (GFP), and under controlled temperature, atmosphere and humidity. Neighbor fields (60–70) were imaged every 5 min for 3–4 days, using a ×20 LD/0.4 NA objective (Leica Microsystems). Following the long-term live-cell imaging, cells were processed for SA-β-gal assay and 53BP1/p21 double immunostaining as described elsewhere in this section, and the same neighbor fields acquired using a ×40 LD/0.6 NA objective. LAS X software (Leica Microsystems) was used for image acquisition and analysis.
Spinning-disk confocal microscopy
Four-dimensional data sets were collected with Andor Revolution XD spinning-disk confocal system (Andor Technology, Belfast, UK), equipped with an electron-multiplying charge-coupled device iXonEM Camera and a Yokogawa CSU 22 unit based on an Olympus IX81 inverted microscope (Olympus, Southend-on-Sea, UK). Two laser lines at 488 and 561 nm were used for the excitation of GFP and mCherry and the system was driven by Andor IQ software. Z -stacks (0.8–1.0 μm) covering the entire volume of the mitotic cells were collected every 1.5 min with a PlanApo ×60/1.4 NA objective. All images represent maximum-intensity projections of all z -planes. ImageJ/Fiji software was used to edit the movies.
Fluorescence microscopy
Analysis of the SA-β-gal fluorescence assay was carried out on a Zeiss AxioImager Z1 (Carl Zeiss) equipped with an Axiocam MR and using an EC-Plan-Neofluor ×40/1.3 NA objective. Cells displaying > 5 fluorescent granules were considered positive for SA-β-gal activity. Image acquisition of FoxM1, Cyclin B, and Cdc20 immunostaining was performed on a Zeiss AxioImager using a Plan-Apochromat ×63/1.4 NA objective. Prometaphase cells were acquired with 0.24 μM Z -stacks. Image acquisition of H4K20me3, H3K9me3, and Lamin B1 immunostaining was performed on Leica 6000B using a ×40 LD/0.6 NA objective. LAS X software (Leica Microsystems) was used for image acquisition and cells were acquired with 0.44 μM Z -stacks. User-defined fluorescence intensity thresholds were set and used consistently for samples within each experiment. AutoQuant X2 (Media Cybernetics, Rockville, USA) was used for image deconvolution.
Automated microscopy
Image fields of 53BP1/p21 double immunostaining and FISH staining were acquired on IN Cell Analyzer 2000 (GE Healthcare, UK), equipped with a Photometrics CoolSNAP K4 camera and using a Nikon ×20/0.45 NA Plan Fluor objective. User-defined fluorescence intensity thresholds were set and used consistently for samples within each experiment.
Image analysis
Live-cell phenotypes (mitotic duration, spindle positioning, and cytokinesis failure) and fixed-cell experiments (FISH, SA biomarkers, and micronuclei) were blindly quantified using ImageJ/Fiji software.
Western blotting
Mitotic cell populations were collected by shaking-off cell culture flasks enriched for MI by a 16 h treatment with STLC. MI > 95% was determined by visual scoring of cells with condensed chromosomes after Carnoy fixation, followed by with 1 µg/ml DAPI in PBS. Lysis buffer (150 nM NaCl, 10 nM Tris-HCl pH 7.4, 1 nM EDTA, 1 nM EGTA, 0.5% IGEPAL) with protease inhibitors was added to mitotic cell pellets, and lysates quantified for protein content by the Lowry Method (DC™ Protein Assay, Bio-Rad, CA, USA). Twenty micrograms of total extract were then loaded in SDS-polyacrylamide gel electrophoresis gels and transferred onto nitrocellulose membranes for western blot analysis. Membranes were blocked during 1 h with TBS containing 5% low-fat milk. Primary antibodies were diluted in TBS containing 2% low-fat milk as follows: rabbit anti-FoxM1 (13147, ProteinTech Group, Inc.), 1:1000; mouse anti-Cyclin B (SC-245, Santa Cruz Biotechnology), 1:1000, mouse anti-Ndc80 (clone 9G3, Abcam, Cambridge, UK), 1:1750; mouse anti-Plk1 (SC-17783, Santa Cruz Biotechnology), 1:100; mouse anti α-tubulin (T5168, Sigma-Aldrich, CA, USA), 1:50,000; and mouse anti-GAPDH (60004, ProteinTech Group, Inc.), 1:30,000. Goat anti-rabbit (SC-2004, Santa Cruz Biotechnology) and goat anti-mouse (SC-2005, Santa Cruz Biotechnology) horseradish peroxidase-conjugated secondary antibodies were diluted at 1:3000 in TBS containing 2% low-fat milk. Signal was detected using Clarity Western ECL Substrate reagent (Bio-Rad Laboratories, CA, USA) according to manufacturer’s instructions. A GS-800 calibrated densitometer with Quantity One 1-D Analysis Software 4.6 (Bio-Rad Laboratories) was used for quantitative analysis of protein levels. Uncropped scans of all blots in the main manuscript and supplementary figures are provided in Supplementary Fig. 11 . Lentiviral plasmids H2B–GFP 69 was amplified as a BglII–H2B–GFP–T2A-BamHI–NotI fragment. This PCR fragment was digested with BglII + NotI and ligated into pRetrox-Tight-Puro (Clontech, CA, USA) digested with BamHI + NotI, thus destroying the 5′ BamHI/BglII site, while reintroducing a BamHI site 3′ of H2B–GFP–T2A. In parallel, α-Tubulin 69 was amplified as a BglII–α-Tubulin–BamHI–NotI fragment and ligated into pRetrox-Tight-Puro digested with BamHI + NotI, again destroying the 5′ BamHI/BglII site, while reintroducing a BamHI site 3′ of α-Tubulin. mCherry was amplified from pExchange-1-Cherry (Agilent Technologies, CA, USA) as a BglII–mCherry–NotI fragment and was ligated into pRetrox–α-Tubulin digested with BamHI–NotI, yielding pRetrox–α-Tubulin–mCherry. Finally, α-Tubulin–mCherry was PCR-amplified as a BglII–α-Tubulin–mCherry–NotI fragment and ligated into pRetrox–H2B–GFP–T2A digested with BamHI + NotI, yielding pRetrox–H2B–GFP–T2A–α-Tubulin–mCherry. To obtain pLVX–Tight-Puro–H2B–GFP–T2A–α-tubulin–mCherry, a BglII–H2B–GFP–T2A–α-Tubulin–mCherry–NotI fragment was amplified from pRetroX–H2B–T2A–GFP–α-Tubulin–mCherry and ligated into pLVX–Tight-Puro (Clontech) digested with BamHI + NotI. To generate pLVX–Tight-Puro–FoxM1-dNdK, a BglII–FOXM1–dNdK–NotI fragment was amplified from pcDNA3–Flag-ΔN-ΔKEN–FoxM1 45 and ligated into pLVX–Tight-Puro digested with BamHI + NotI. Primers used are described in Supplementary Table 4 .
Lentiviral production and infection
Lentiviruses were produced according to the protocol described in Lenti-X Tet-ON Advanced Inducible Expression System (Clontech). Lentiviruses carrying empty pLVX–Tight-Puro, pLVX––Tight-Puro–H2B–GFP–α-Tubulin–mCherry or pLVX–Tight-Puro–FoxM1-dNdK, as well as lentiviruses carrying pLVX–Tet-On Advanced (which expresses rtTA), were generated in HEK293T helper cells transfected with packaging plasmids (pMd2.G and psPAX2) using Lipofectamine 2000 (Life Technologies, Thermo Scientific, CA, USA). Human fibroblasts were co-infected for 12–16 h with responsive and transactivator lentiviruses at 2:1 ratio, in the presence of 8 µg/ml polybrene (AL-118, Sigma-Aldrich, MO, USA). In the following day, 750 ng/ml doxycycline (D9891, Sigma-Aldrich, MO, USA) was added to the medium to induce co-transduction. Phenotypes were analyzed and quantified 48–72 h later, and transfection efficiency monitored by scoring the number of fluorescent cells or by western blotting. FoxM1 RNA interference Cells were transfected 1 h after plating, with 45 nM FoxM1 small interfering RNA (SASI_Hs01_00243977 from Sigma-Aldrich, MO, USA) using Lipofectamine RNAiMAX (Thermo Scientific) according to manufacturer’s instructions. Phenotypes were analyzed and quantified 72 h post transfection, and depletion efficiency monitored by western blotting. Real-time PCR Total RNA was obtained from mitotic fibroblasts (collected as depicted in Fig. 3a and in the Western blotting section) using the RNeasy® Mini kit (Qiagen, Hilden, Germany). RNA purity and integrity was confirmed in the Experion™ system (Bio-Rad Laboratories). cDNA was synthesized from total RNA (1 μg) using iScript Advanced Select cDNA Synthesis kit (Bio-Rad Laboratories). The 2 −∆∆Ct method was used to quantify the transcript levels of FOXM1 , CDKN1A , MMP1 , CXCL8 , TSPAN13 , and FAM214B against the transcript levels of the housekeeping gene ( TBP ). Primers were designed to span at least one exon–intron junction (Supplementary Table 3 ). Amplification was performed in a C1000 Touch Thermal Cycler (CFX384 Real-Time System, Bio-Rad Laboratories) and analyzed using CFX Manager Software (Bio-Rad Laboratories).
RNA-seq and bioinformatics
RNA was isolated from mitotic human fibroblasts and validated as described above for Real-time PCR. RNA-sequencing libraries were prepared using TruSeq Stranded Total RNA with Ribo-Zero Human/Mouse/Rat (RS-122-2201; Illumina, CA, USA) according to manufacturer’s protocol. Pooled libraries were sequenced on an Illumina HiSeq 2500 (single-end 50 bp). Raw unaligned sequencing reads (fastq-format) were deposited in the European Nucleotide Archive (ENA) under the accession number PRJEB27047. Reads were aligned to the human genome (hg19) using a splicing-aware aligner (StarAligner). Aligned reads were fragments per million (FPM) normalized, excluding low abundance genes (mean FPM > 1). Differential gene expression analysis was performed using a likelihood ratio test constructed under the R-package edgeR (v3.14.0 available from Bioconductor at http://www.bioconductor.org/packages/release/bioc/html/edgeR.html ). Significant differential gene expression of aged fibroblasts was defined as p -value < 0.05 and 2logFC cutoff value < −0.5 or > 0.5; and in case of genetic manipulations as p -value < 0.05, 2logFC cutoff value < −0.5 or > 0.5, and FDR < 0.05. For generation of RNA-seq heatmaps, transcript counts were normalized to the sample library size. These values were subsequently scaled by gene using normalized scores or z -scores (i.e. a value of 0 corresponds to the mean gene expression of that gene across all libraries, and ± 1, ± 2, etc. represent 1, 2, etc. SDs from the gene mean). Hierarchical clustering was performed using the R library heatmap.2. RNA-seq data represent two independent experimental replicates of each biological sample. GO term enrichment analysis of differentially expressed genes was performed using Database for Annotation, Visualization and Integrated Discovery Functional Annotation Tool v6.7 70 ( www.david-d.ncifcrf.gov ). To calculate the significance of gene set enrichment, empirical p-values were generated using DAVID tool.
Statistical analysis
Sample sizes and statistical tests for each experiment are indicated in the fugure legends. p -values were obtained using GraphPad Prism version 6 (GraphPad, San Diego, CA, USA). Data were tested for parametric vs. non-parametric distribution using D’Agostino–Pearson omnibus normality test. Spearman’s rank correlation, Mann–Whitney, two-tailed χ 2 , or one-way analysis of variance for multiple comparisons tests were then applied accordingly. NS, p > 0.05, * p ≤ 0.05, ** p ≤ 0.01, *** p ≤ 0.001, and **** p ≤ 0.0001. Values are shown as mean ± SD or mean ± SEM.
Data availability
Raw unaligned sequencing reads (fastq-format) that support the findings of this study have been deposited in the ENA and are available under the accession number PRJEB27047 . The authors declare that data supporting the findings of this study are available in the main manuscript and supplemental information, or otherwise available from the corresponding author upon request.
Electronic supplementary material Supplementary Information Peer Review File Description of Additional Supplementary Files Supplementary Movie 1 Supplementary Movie 2 Supplementary Movie 3 Supplementary Movie 4 Supplementary Movie 5 Supplementary Movie 6 Supplementary Movie 7 Supplementary Movie 8 Supplementary Movie 9 Supplementary Movie 10 Supplementary Movie 11 Supplementary Data 1 Supplementary Data 2 Supplementary Data 3 Supplementary Data 4 Supplementary Data 5 Supplementary Data 6 Supplementary Data 7 Supplementary Data 8 Supplementary Data 9 Supplementary Data 10 Supplementary Data 11 Supplementary Data 12 Supplementary Data 13 Supplementary Data 14 Supplementary Data 15 Supplementary Data 16 Supplementary Data 17
📊 Figures
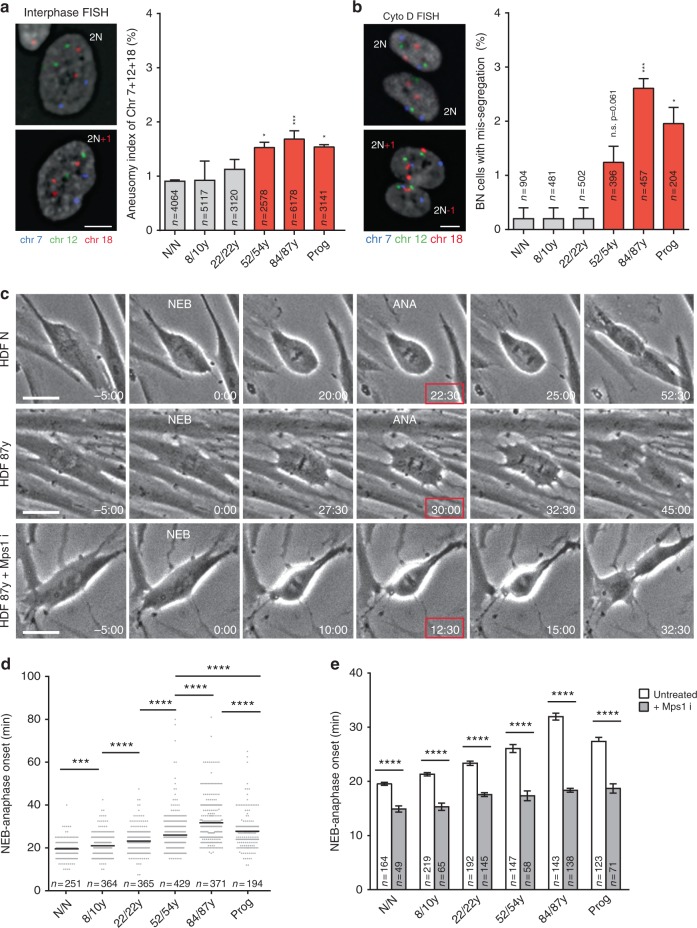
Fig. 1
Aneuploidy and mitotic duration increase during normative aging. a Aneusomy index of three chromosome pairs (7, 12, and 18) in interphase cells from different age donors. b Percentage of cytochalasin ...
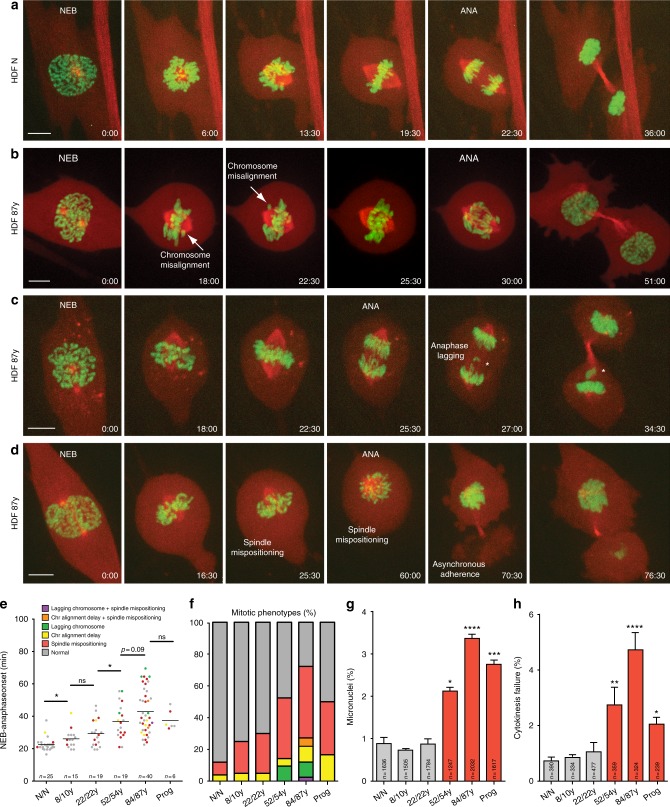
Fig. 2
Mitotic defects associated with advanced age. a u2013 d Frame series of spinning-disk confocal movies of neonatal (HDF N) and elderly (HDF 87u2009y) dividing cells expressing H2Bu2013GFP/u03b1-Tubulin...
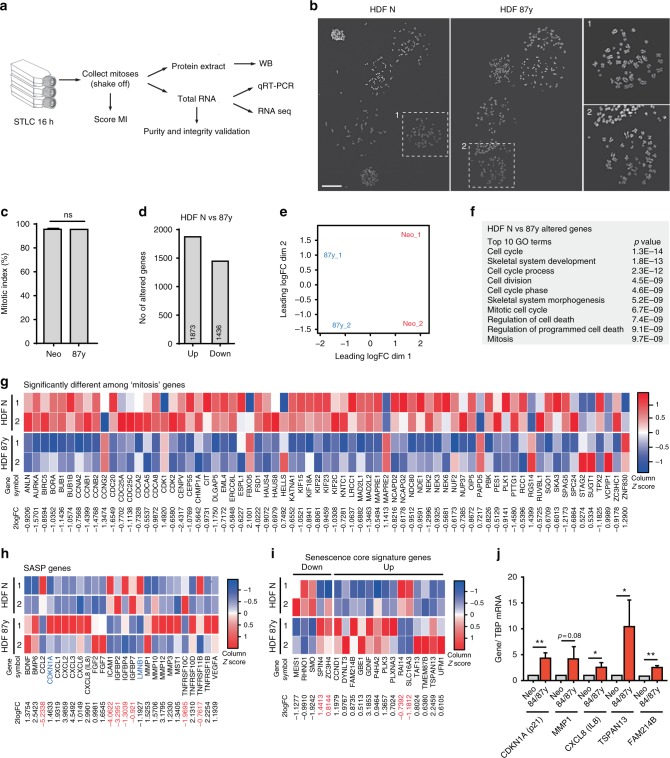
Fig. 3
Mitotic gene downregulation and senescence gene signature in elderly mitotic fibroblasts. a Experimental layout. Fibroblast cultures from different age donors were treated with kinesin-5 inhibitor (ST...
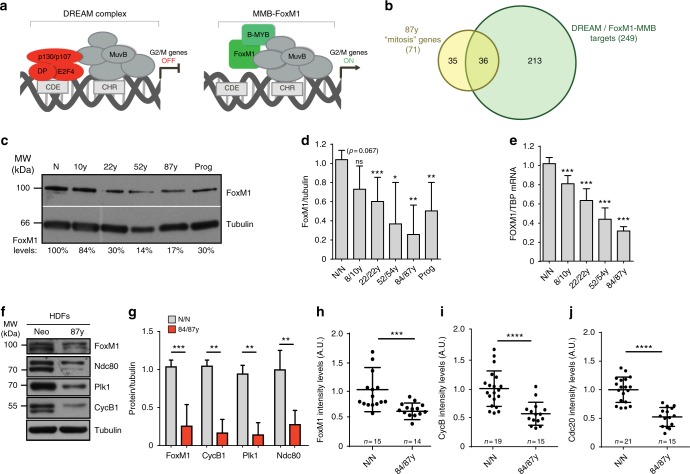
Fig. 4
Aging cells express low levels of FoxM1 and mitotic transcripts during mitosis. a Regulation of G2/M cell cycle genes by competitive binding of DREAM and FoxM1-MMB transcriptional complexes to CDE/CHR...
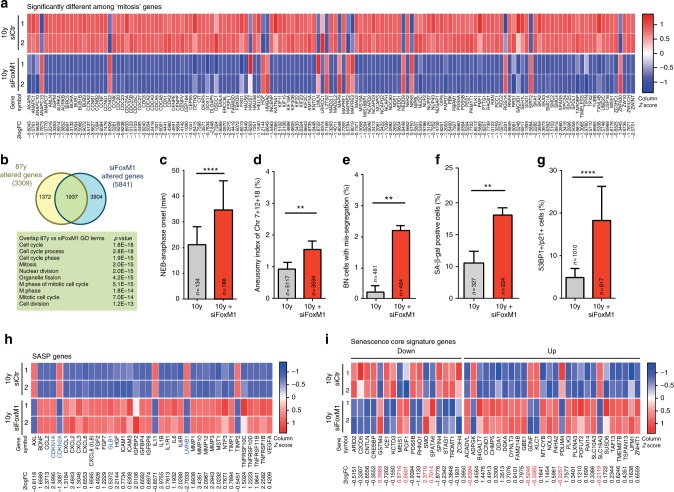
Fig. 5
FoxM1 repression dictates cellular phenotypes associated with aging. a Heatmap of genes within the u201cmitotisu201d GO term differentially expressed between control and FoxM1 siRNA-depleted 10-year-o...
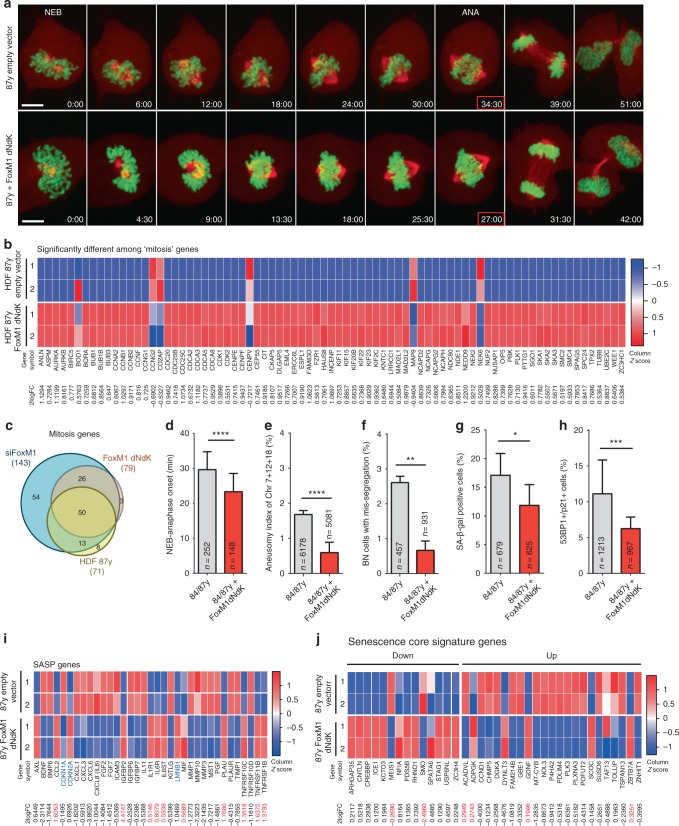
Fig. 6
Constitutively active FoxM1 ameliorates mitotic fitness and aging markers in elderly cells. a Movie frames of elderly dividing cells expressing H2Bu2013GFP/u03b1-Tubulinu2013mCherry (upper panel) and ...
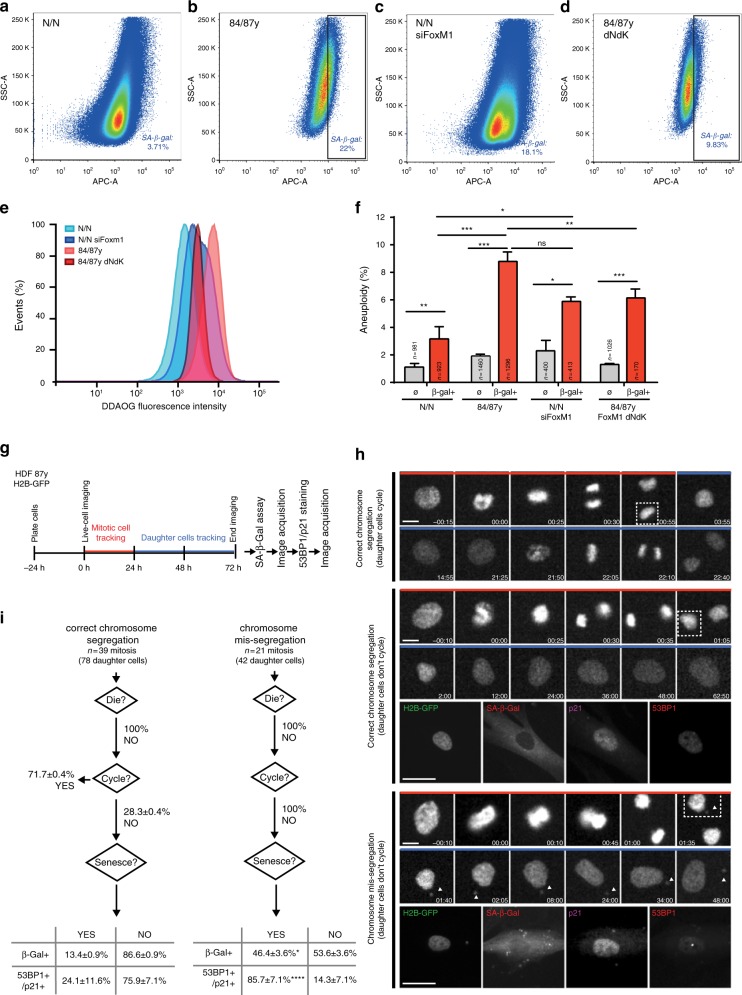
Fig. 7
FoxM1 governs aneuploidization-driven cellular senescence in elderly cells. a u2013 d FACS sorting of senescent cells from neonatal a , elderly b , FoxM1 siRNA-depleted neonatal c , and 84u2009y/87u20...
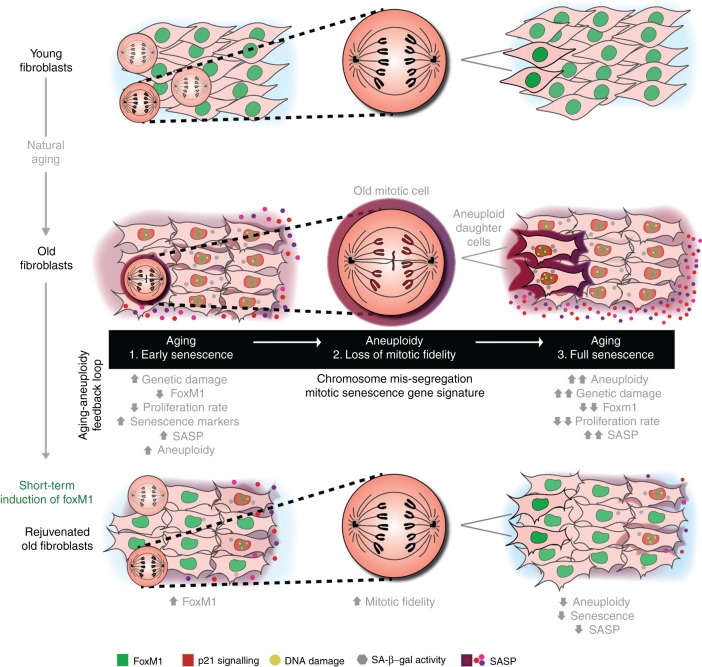
Fig. 8
Positive feedback loop between aging and aneuploidy. Model summarizing the molecular basis of age-associated mitotic decline and accumulation of senescent cells induced by aneuploidy. FoxM1 repression...
Figure images are served from the NIH/NLM PubMed Central Open Access Subset or Europe PMC; copyright remains with the publishers and authors.
💬 Discussion
0 commentsNo comments yet. Be the first to start a discussion!
Leave a Comment