Abstract
AbstractThe application of multiphoton microscopy in the field of biomedical research and advanced diagnostics promises unique insights into the pathophysiology of inflammatory skin diseases. In the present study, we combined multiphoton-based intravital tomography (MPT) and fluorescence lifetime imaging (MPT-FLIM) within the scope of a clinical trial of atopic dermatitis with the aim of providing personalised data on the aetiopathology of inflammation in a non-invasive manner at patients’ bedsides. These ‘optical biopsies’ generated via MPT were morphologically analysed and aligned with classical skin histology. Because of its subcellular resolution, MPT provided evidence of a redistribution of mitochondria in keratinocytes, indicating an altered cellular metabolism. Two independent morphometric algorithms reliably showed an even distribution in healthy skin and a perinuclear accumulation in inflamed skin. Moreover, using MPT-FLIM, detection of the onset and progression of inflammatory processes could be achieved. In conclusion, the change in the distribution of mitochondria upon inflammation and the verification of an altered cellular metabolism facilitate a better understanding of inflammatory skin diseases and may permit early diagnosis and therapy.
🔬 Techniques
🧪 Sample Preparation
🔬 Cell Lines
🏭 Microscope Brands
🧪 Reagent Suppliers
🔴 Lasers
📷 Detectors
💻 Software Details
🏛️ Research Organizations (ROR)
Affiliated research institutions:
📋 Methods
Multiphoton tomography
In the present study, we applied a certified CE-marked five-dimensional intravital multiphoton tomographic system (MPT). The technical setup, based on a DermaInspect multiphoton microscope, was established within the framework of the BMBF project ‘5D-IVT’ by JenLab (JenLab GmbH, Jena, Germany). Near-infrared laser pulses with a pulse length of 100 fs provided by a Titanium:Sapphire tuneable laser system (Mai Tai, Newport Spectra-Physics, Santa Clara, CA, USA) were used for the excitation of endogenous fluorophores in human skin. The excitation laser beam was attenuated by the use of a Glan calcite polariser and scanned by two galvanometric mirrors. After passing a beam expander and collimator, the laser pulses are reflected by a dichroic beam splitter into a 40x oil immersion microscope objective with a numerical aperture of 1.3 (Carl Zeiss Jena GmbH, Jena, Germany). The emitted fluorescence light was transmitted and cleared by an additional shortwave-pass filter (F37-490 BrightLine HC 490/LP and F75-680 Multiphoton-Emitter HC 680/SP, F39-461 BrightLine HC 460/60, F39-390 BrightLine HC 390/40; Semrock Inc., Rochester, NY, USA) and was split into three distinct spectral regions by a set of dichroic beam splitters (F43-031 425DCXR, F33-499 495DCXR; Chroma Technology Corp., Bellows Falls, VT, USA). Three separate photomultipliers (PMTs) provided intensity images of the sample, and each PMT was readout via time-correlated single photon counting to calculate wavelength-range-specific fluorescence lifetime values (MPT-FLIM). The PMT data were processed by a high-resolution time-correlated single photon counting imaging module (SPC 830, Becker & Hickl GmbH, Berlin, Germany). This setup allows us to non-invasively excite fluorophores in human skin in vivo to create high-resolution autofluorescence images and fluorescence lifetime images with a penetration depth of 150 μm. An excitation wavelength of 710 nm and an emission bandpass filter (460/60 nm) were used to match the spectrum of NADH.
Show full methods section
Multiphoton tomography
In the present study, we applied a certified CE-marked five-dimensional intravital multiphoton tomographic system (MPT). The technical setup, based on a DermaInspect multiphoton microscope, was established within the framework of the BMBF project ‘5D-IVT’ by JenLab (JenLab GmbH, Jena, Germany). Near-infrared laser pulses with a pulse length of 100 fs provided by a Titanium:Sapphire tuneable laser system (Mai Tai, Newport Spectra-Physics, Santa Clara, CA, USA) were used for the excitation of endogenous fluorophores in human skin. The excitation laser beam was attenuated by the use of a Glan calcite polariser and scanned by two galvanometric mirrors. After passing a beam expander and collimator, the laser pulses are reflected by a dichroic beam splitter into a 40x oil immersion microscope objective with a numerical aperture of 1.3 (Carl Zeiss Jena GmbH, Jena, Germany). The emitted fluorescence light was transmitted and cleared by an additional shortwave-pass filter (F37-490 BrightLine HC 490/LP and F75-680 Multiphoton-Emitter HC 680/SP, F39-461 BrightLine HC 460/60, F39-390 BrightLine HC 390/40; Semrock Inc., Rochester, NY, USA) and was split into three distinct spectral regions by a set of dichroic beam splitters (F43-031 425DCXR, F33-499 495DCXR; Chroma Technology Corp., Bellows Falls, VT, USA). Three separate photomultipliers (PMTs) provided intensity images of the sample, and each PMT was readout via time-correlated single photon counting to calculate wavelength-range-specific fluorescence lifetime values (MPT-FLIM). The PMT data were processed by a high-resolution time-correlated single photon counting imaging module (SPC 830, Becker & Hickl GmbH, Berlin, Germany). This setup allows us to non-invasively excite fluorophores in human skin in vivo to create high-resolution autofluorescence images and fluorescence lifetime images with a penetration depth of 150 μm. An excitation wavelength of 710 nm and an emission bandpass filter (460/60 nm) were used to match the spectrum of NADH.
Study design
Twenty healthy volunteers and 25 patients affected by AD who were undergoing basic therapy were enrolled in this study. For each subject, two different skin areas were analysed during four clinical visits over three months to obtain a survey of the diverse states of inflammation. In each visit, a physician diagnosed the state of inflammation according to the SCORAD 28 , and a local score of inflammatory manifestation in the investigated skin areas was assigned via clinical inspection. To offer the patients the most comfortable examination, we chose one lesional and one non-lesional skin area of the volar forearm. The targeted skin area was directly coupled to MPT using an in vivo adapter provided by JenLab. Sequences of confocal sections with 10 μm penetration steps, an edge length of 100 μm and an exposure time of 25 s per image were recorded, starting at the outmost epidermal layer ( Stratum corneum ), defined as a depth of 0 μm, and ending at the papillary dermis, at approximately 150 μm. The study was conducted conforming to the guidelines of the Declaration of Helsinki 29 and The International Conference on Harmonisation of Technical Requirements for Registration of Pharmaceuticals for Human Use (ICH) 30 . It was approved by the Bundesinstitut für Arzneimittel und Medizinprodukte (BfArM) of Germany and the Ethics Committee of the Medical Association Westfalen-Lippe (Münster, Germany). Appropriate informed consent was obtained from all subjects.
Histological alignment
Immediately after the last clinical visit, punch biopsies were taken from target skin areas in three healthy subjects and three affected patients. The biopsies were split for standard vertical and horizontal histological preparation and stained with haematoxylin-eosin, for classical histological examination, or with the anti-mitochondrial antibody MTC02 ab3298 (Abcam, Cambridge, MA, USA), for alignment of the mitochondrial distribution, and were examined by a histopathologist and aligned to the corresponding MPT images.
Data preparation and analysis of the cellular mitochondrial distribution
Cell segmentation
Because the mitochondrial distribution is defined per cell, the cytoplasm of different typical cells must be segmented in a preceding step. This segmentation is performed manually by defining (Software MIPAV 31 ) two non-self-intersecting polygons: an inner polygon P nucleus tracing the nucleus and an outer polygon P cell tracing the cell membrane. The cytoplasm polygon is then defined by the difference P cytoplasm = P cell − P nucleus , which is the region of interest ( ROI ) for the subsequent steps. To correct irregular illumination, we used a previously reported Gaussian filtering-based method (see Supplementary Methods and Supplementary Fig. S2 ) 32 33 .
Mitochondrial pixel classification
The mitochondrial regions of the cytoplasm are defined by a strong NADH signal resulting in a high photon count at the corresponding positions. The shading corrected photon count image I corr used for the quantitative analysis of MD consists of a 128 × 128 matrix and each pixel I ( x , y ) contains the number of detected photons. To identify all pixels representing mitochondrial areas, an automatic thresholding algorithm is used 34 . The algorithm assumes that I corr consists of two classes, foreground (high intensity) and background (low intensity) pixels, and iteratively calculates the optimal threshold by minimising the variance within each class. The detected mitochondrial pixels are coloured red in Figs 3 and 5 . Annuli filling analysis (AFA) To measure the spatial distribution of mitochondrial pixels within the cytoplasm of each cell, the is divided into 10 circular regions (annuli) from the centre to the periphery ( A 0 , …, A 9 ) defined by concentric circles C 0 , …, C 9 (see upper right of Fig. 3a–d ). With as the centroid of the inner polygon P nucleus , the radius r 0 of the innermost circle C 0 is defined by the maximum distance between c and the bounding box of P nucleus . The radius r 9 of the outer circle C 9 is the minimum distance between and the bounding box of P cell . The radii r 1 , …, r 8 are defined by /9 with . Given the Euclidian distance , a pixel resides in annulus if . Following this scheme, every mitochondrial pixel can be assigned to exactly one annulus A i , and a relative mitochondrial count m i can be calculated per A i by dividing the number of mitochondrial pixels by the number of all pixels in A i . In the next step, the relative mitochondrial counts m 0 , …, m 9 (black points in the graphs of Figs 3 and 5 ) are used to calculate a 4 th degree polynomial via weighted polynomial interpolation (green plot in the graphs of Figs 3 and 5 ). Two extra points and (not shown in Figs 3 and 5 ) with a high weight are included in the interpolation to force the polynomial maxima within the range of 0 and 9. Furthermore, higher m i values receive a higher weight to map the polynomial to the maxima. The gradient of the inflexion point (red points in Figs 3 and 5 ) with the smallest distance from the dominant maximum (grey points in Figs 3 and 5 ) describes the mitochondrial distribution. For complete mitochondrial centralisation the gradient becomes minimal ( ; Fig. 3a ). In the case of complete peripheralisation, the gradient is maximal ( ; Fig. 3c ) and a homogeneous MD is denoted by a close to 0 ( Fig. 3b ). Radial profiles analysis (RPA) Although the AFA method works well in cells with a relatively circular shape, problems arise in cells with extremely ragged outlines or eccentric nuclei. Thus, we have developed an alternative method based on a previously published algorithm 35 , which is unaffected by these problems. In general, RPA works by generating a number of radial profiles within the cytoplasm, and subsequent analysis is performed on the grey level distribution. In the first step, l equiangular radial line segments within P cytoplasm are generated ( Fig. 4b,h , coloured lines). Each line is then sampled at equidistant points and the bilinear interpolated grey values at these sampling points form one radial profile p . All profiles are stacked together to form a s × l matrix, which represents the unrolled length-normalised cytoplasm ( Fig. 4e,f ). To reduce the effect of non-mitochondrial pixels and background noise, each column profile p is thresholded separately via Otsu’s method 34 , depicted in Fig. 4c (before thresholding) and Fig. 4d (after thresholding). For quantification of the mitochondrial distribution, the grey values of each column profile p are summed from the inner to the outer sampling point until 50% of the cumulative grey value of p is reached. The index of this point is the distribution value Distr of one profile, and the normalised mean of all profiles represents the mitochondrial distribution of the cell. Distinct eccentric nuclei might be indicative of tilted optical sectioning, resulting in a single-sided impaired information density. Therefore, extraordinarily long and short radial profile line outliers are filtered out using the median absolute deviation (MAD) 36 . Cell culture and in vitro measurement of cell metabolism using MPT-FLIM The human keratinocyte cell line HaCaT was cultivated as previously reported 37 38 . Briefly, HaCaT cells were maintained at 37 °C under 5% CO 2 in RPMI 1640 medium supplemented with 10% foetal calf serum, 1% L-glutamine and 1% penicillin/streptomycin. Twenty-four hours prior to the experiment, the cells were seeded into a 0.2 μm luer slide (ibidi GmbH, Munich, Germany). Multiphoton tomography was carried out 4 hours after treatment with 5 μM rotenone or 20 mM glucose (both Sigma-Aldrich, Steinheim, Germany) or 10 nM recombinant human TNF-alpha. The experiments were performed in HEPES-buffered Ringer’s solution containing (in mmol/L): 140 NaCl, 5 KCl, 1 MgCl, 1 CaCl 2 , 5 glucose, and 10 HEPES (N-2-hydroxyethylpiperazin-N0-2-ethanesulfonic acid), adjusted to a pH of 7.4, at 37 °C.
Preparation and analysis of in vivo MPT-FLIM data
Because of the vast amount of obtained image and FLIM data, a specialised system for structured data storage, retrieval and analysis was needed. For this purpose, we used the Open Microscopy Environment (OME). OME consists of OME-XML 27 , an open standard format for the description and annotation of microscopy image data, and OMERO (OME Remote Objects) 39 , an open source software for the management and analysis of image data. To enrich the existing image data with histological parameters, all images were first categorised by a dermatologist with expertise in the field of histopathology. For categorisation, a region of interest consisting only of cells from one single epidermal layer was defined for each image. Additional examples of parameters are the image quality with regard to suitability for automatic analysis and diagnosis from a histological perspective. Categorisation parameters, clinical values (e.g., medication and the SCORAD) and technical image acquisition data (e.g., excitation wavelength and laser energy) were transformed into the OME-XML format, merged with the associated image and FLIM data and then imported to the OMERO server. Various clients (OMERO.insight, OMERO.web) can be used for manual image and metadata browsing. Furthermore, the functionality of the OMERO server can be used and extended to implement algorithms for analysis. To obtain a tool for specialised and explorative data analysis and quantification, we have chosen a two-staged approach. In the first step, the user creates a subset of all images by defining various metadata constraints (e.g., image quality: high to very high; epidermal layers: Stratum granulosum and spinosum , and SCORAD: 10 to 50), and in a second step, the parameters for quantitative analysis (e.g., SCOARD vs. tau m ) are chosen. For rapid evaluation of results, different visualisation methods, such as box or scatter plots, are available, and the quantitative results can be exported for further analysis.
Statistical computation
Mean data from the experiments are presented with the standard error of the mean (SEM). Statistical computations were performed with SAS 9.2 (SAS Institute Inc., Cary, NC, USA).
📊 Figures
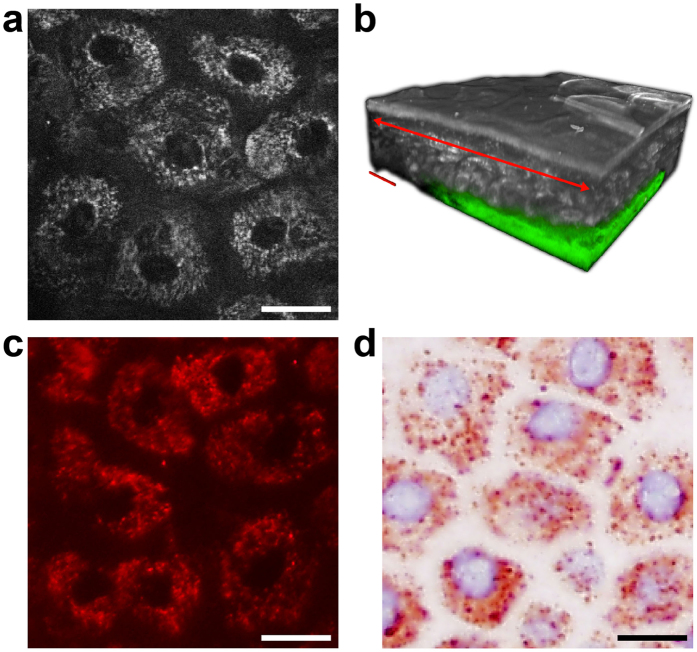
Figure 1
Multiphoton tomographic optical biopsy and mitochondria staining of healthy human skin.
( a ) A representative multiphoton optical section of the Stratum granulosum of healthy skin in vivo . ( b ) A multiphoton tomographic three-dimensional reconstructed skin cube. The examined target se...
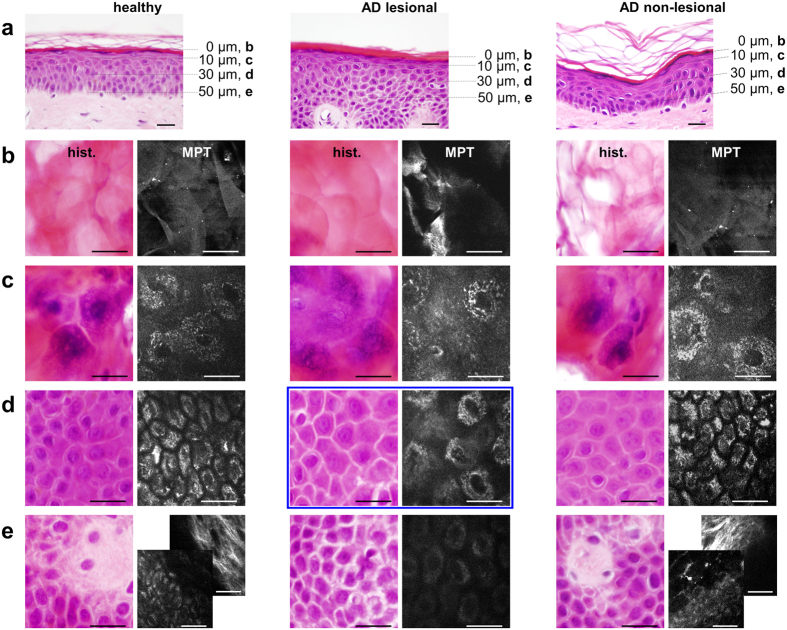
Figure 2
Gold standard alignment of intravital multiphoton tomography.
( a ) Standard vertical histological sections of the skin from healthy subjects (healthy), the ostensibly healthy skin of a patient affected by AD (AD non-lesional) and lesional atopic skin (AD lesion...
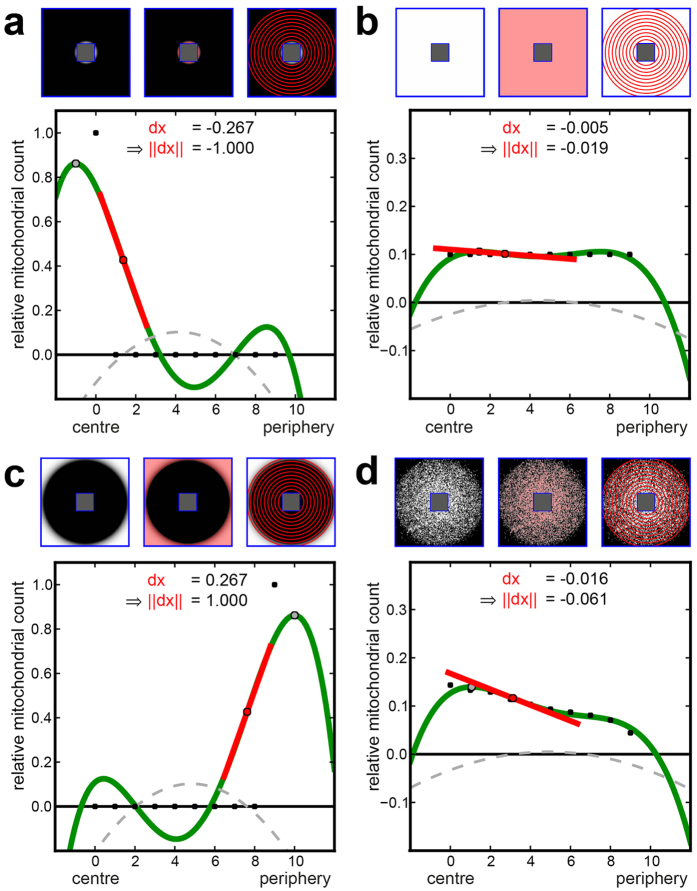
Figure 3
Annuli filling analysis (AFA) of generated dummy cells.
( a u2013 d ) Upper row: Quadratic dummy cells with nuclear (central rectangle) and cell membranes marked in blue; the cytoplasm lying in between is the used for AFA. Upper left: An intensity image of...
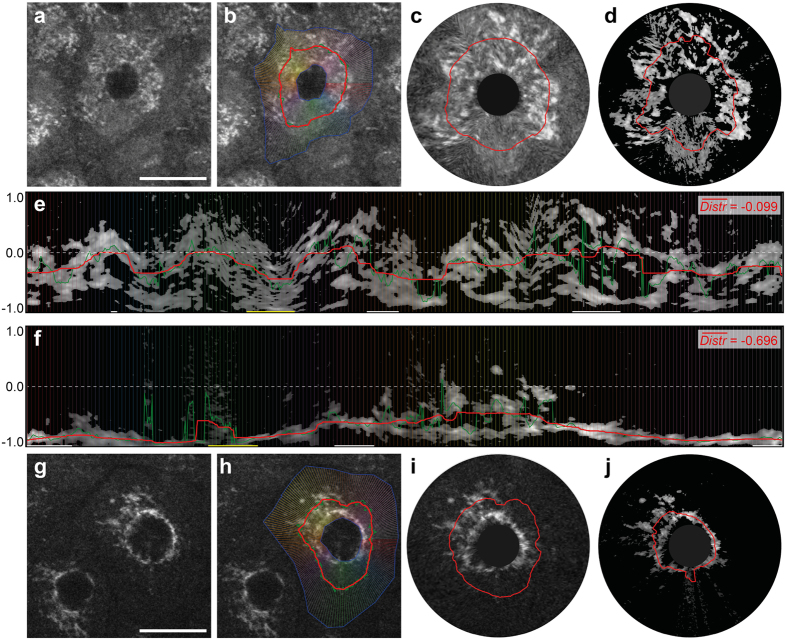
Figure 4
Radial profiles analysis (RPA) of human epidermal cells of the Stratum granulosum .
Archetypical keratinocytes of the Stratum granulosum in healthy ( au2013e ) and lesional ( fu2013j ) skin areas have been selected. ( a,g ) Representative multiphoton tomographic cell images. ( b,h ) ...
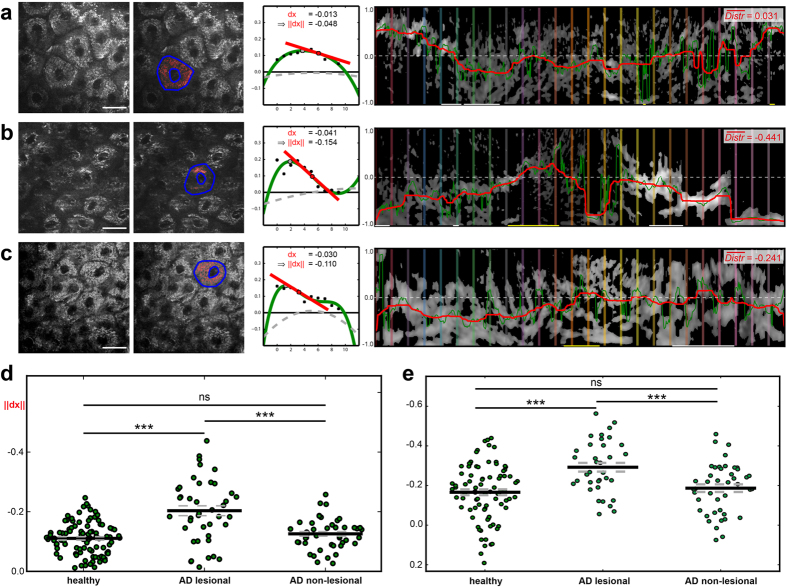
Figure 5
Mitochondrial distribution of patientsu2019 epidermal cells calculated via AFA and RPA.
( a ) Within a typical Stratum granulosum cell layer in healthy skin (left image), the selected cell marked in blue (second image) shows a homogenous mitochondrial distribution based on AFA, correspon...
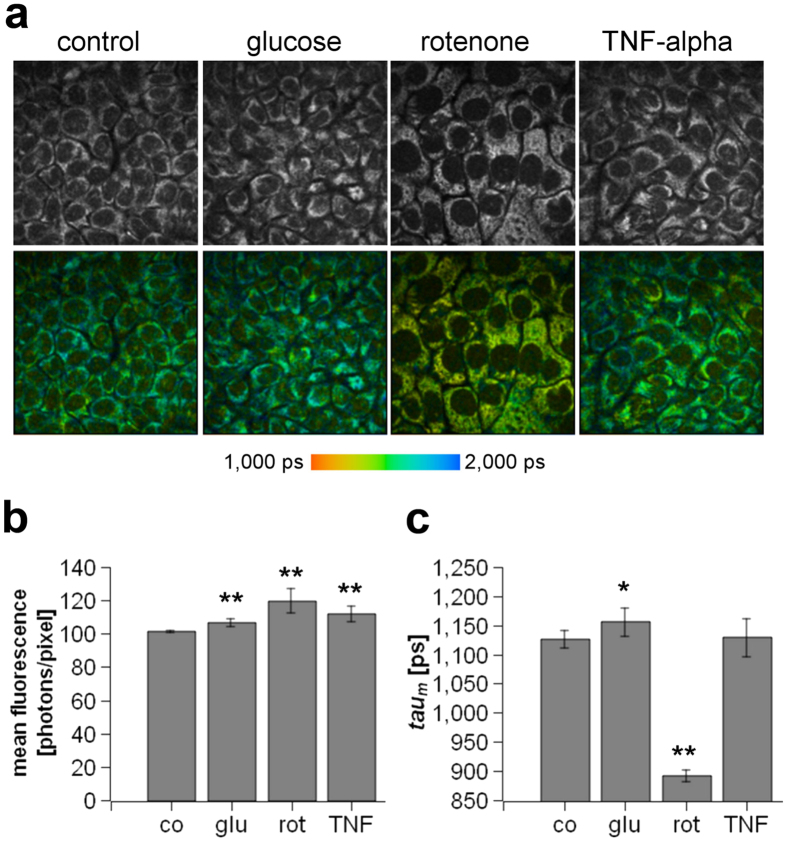
Figure 6
Evaluation of the energy status of human keratinocytes in vitro .
( a ) Fluorescence intensity images reflecting the total amount of cellular NADH (first row) and fluorescence lifetime images (FLIM) (second row) of non-treated keratinocytes (control) or keratinocyte...
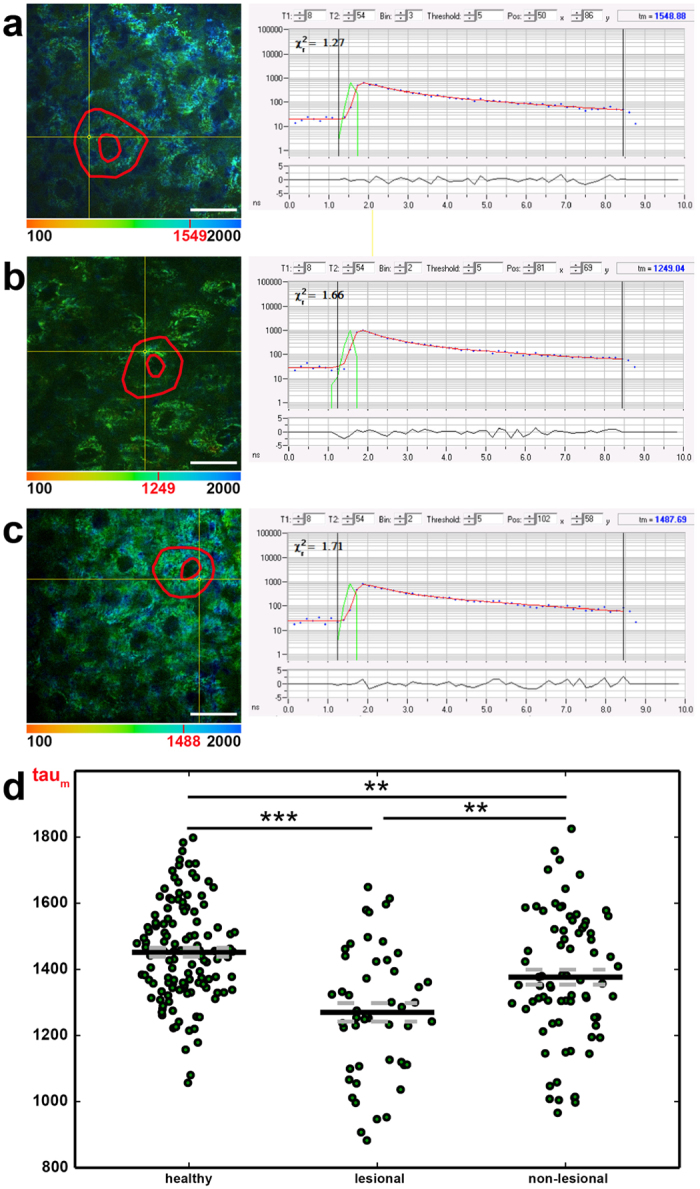
Figure 7
Comparison of the fluorescence lifetime (tau m ) of healthy, lesional and non-lesional Stratum granulosum cells.
Overlay images of MPT morphology and colour-coded tau m values of representative healthy ( a ), lesional ( b ) and non-lesional ( c ) cell layers, with one segmented cell contoured in red. A low tau m...
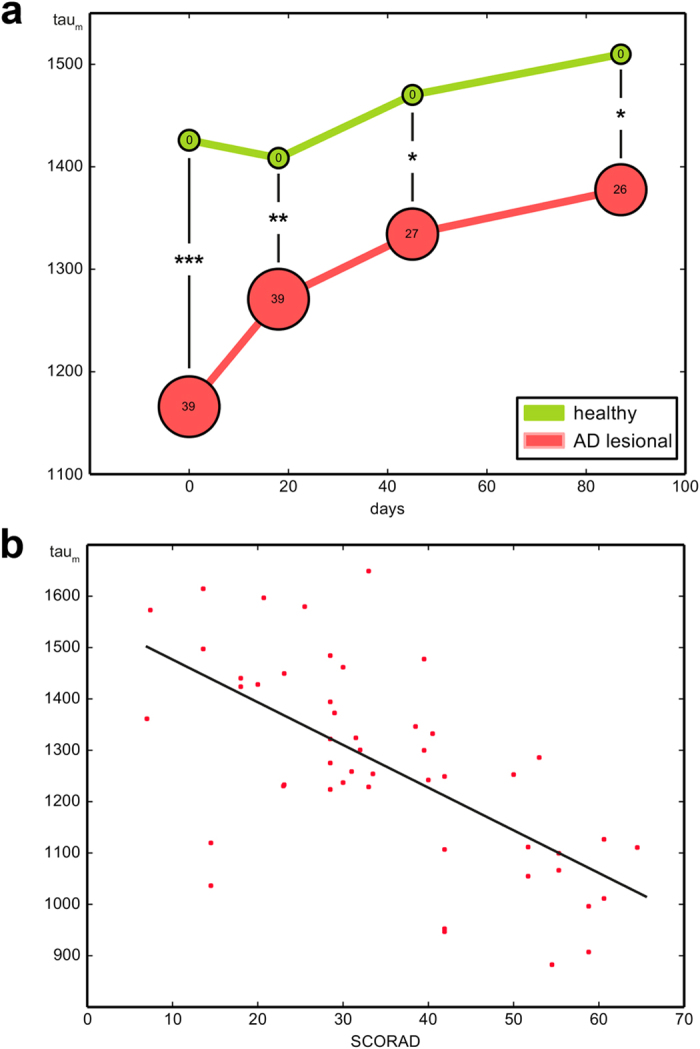
Figure 8
Overall fluorescence lifetime (tau m ) in the course of the clinical trial.
( a ) Mean tau m values of lesional skin areas in all patients suffering from AD continuously show a significant difference in the tau m of healthy skin over the entire term. The bubble size represent...
Figure images are served from the NIH/NLM PubMed Central Open Access Subset or Europe PMC; copyright remains with the publishers and authors.
💬 Discussion
0 commentsNo comments yet. Be the first to start a discussion!
Leave a Comment