Abstract
Phospholipase C-β (PLCβ) is directly activated by Gαq, but the molecular basis for how its distal C-terminal domain (CTD) contributes to maximal activity is poorly understood. Herein we present both the crystal structure and cryo-EM three-dimensional reconstructions of human full-length PLCβ3 in complex with mouse Gαq. The distal CTD forms an extended monomeric helical bundle consisting of three antiparallel segments with structural similarity to membrane-binding bin-amphiphysin-Rvs (BAR) domains. Sequence conservation of the distal CTD suggests putative membrane and protein interaction sites, the latter of which bind the N-terminal helix of Gαq in both the crystal structure and cryo-EM reconstructions. Functional analysis suggests that the distal CTD has roles in membrane targeting and in optimizing the orientation of the catalytic core at the membrane for maximal rates of lipid hydrolysis.
🔬 Techniques
✨ Fluorophores
🏭 Microscope Brands
🧪 Reagent Suppliers
📷 Detectors
💻 Software Details
💾 Data Repositories
🏛️ Research Organizations (ROR)
Affiliated research institutions:
📋 Methods
Protein expression, purification, and mutagenesis N-terminally His-tagged human PLCβ3 (residues 10–1234) and variants were expressed in baculovirus infected insect cells and purified as described previously 19 , with the modification that resuspended cells were lysed by douncing on ice. Murine Gα q (residues 7–359) and variants were expressed and purified with a TEV-cleavable N-terminal His-tag as described previously 19 , with some modifications. Following elution from an Ni-NTA column, the protein was concentrated and applied to two tandem Superdex S200 columns equilibrated with 20 mM HEPES pH 8, 200 mM NaCl, 2 mM DTT, 1 mM MgCl 2 , and 10 µM GDP. Gα q used for complex crystallization had the His-tag removed by the addition of TEV protease at 2% (w/w) of Gα q , then dialyzed overnight at 4 °C in Buffer B (20 mM HEPES pH 8, 100 mM NaCl, 10 mM βME, 3 mM MgCl 2 , and 10 µM GDP). Following dialysis, the proteins were applied to a Ni-NTA column pre-equilibrated with Buffer B. The flow-through, containing TEV-cleaved Gα q , was collected, passed through the column three times, then concentrated and applied to two tandem Superdex S200 columns. Point mutations and internal deletions in the coding regions of PLCβ3 and Gα q were introduced using QuikChange Site-Directed Mutagenesis (Stratagene), and were confirmed by sequencing over the entire open reading frame.
Purification of the Gα q –PLCβ3 Complex TEV-cleaved
Gα q was incubated on ice with Buffer C (20 mM HEPES pH 8, 200 mM NaCl, 2mM DTT, 0.9 mM CaCl 2 , 5 mM MgCl 2 , 10 mM NaF, 30 µM AlCl 3 , and 50 µM GDP) for 15–20 min. Purified PLCβ3 was added to Gα q in a 1:1.2 molar ratio, and incubated for an additional 30 min on ice. The reaction was loaded on two tandem Superdex S200 columns equilibrated with Buffer C. Peak fractions containing Gα q –PLCβ3 were pooled and concentrated in a 100 kDa Amicon concentrator. Crystallization and Structure Determination of the Gα q –PLCβ3 Complex Gα q –PLCβ3 was suspended in hanging drops containing 1 µl Gα q –PLCβ3 at 6.2 mg ml −1 mixed with 1 µl well solution. The well solution contained 100 mM MES pH 6.75, 100–200 mM NaCl, and 11–12% PEG 3350, with crystals appearing in 4–7 d at 4 °C. Crystals were harvested in 20 mM HEPES pH 8, 400–500 mM NaCl, 2 M DTT, 0.9 mM CaCl 2 , 5 mM MgCl 2 , 10 mM NaF, 30 µM AlCl 3 , 50 µM GDP, 15% (w/v) PEG 3350, and 30% (v/v) 1,3-butanediol, then frozen on nylon loops in liquid nitrogen for data collection. Diffraction data was collected at the Advanced Photon Source at LS-CAT Beam line 21-ID-D and GM/CA-CAT beam line 23-ID-D from crystals maintained at 110 K at wavelengths of 1.13 Å and 1.03 Å respectively. Although initial diffraction to 3.3 Å spacings was observed, rapid decay limited useful data to 4.0 Å spacings ( Table 1 ). Data sets were reduced using HKL2000 48 , and initial phases were derived by molecular replacement using the 3OHM structure 18 as a search model. Models were refined via restrained refinement with TLS using the program REFMAC5 49 . Five TLS groups were used: one for each Gα q chain, its ligands (Mg 2+ , GDP, and AlF 4 − molecules) and its bound PLCβ3 proximal CTD (residues 863–881), one for each PLCβ3 catalytic core and its associated Ca 2+ atom, and one for the distal CTD. NCS restraints were imposed on the two Gα q chains (residues 39–353 and its ligands) and the two PLCβ3 chains (residues 16–194, 202–862, and the Ca 2+ atoms). Stereochemical correctness of the final model was assessed with MolProbity 50 . In the final model, 94.7% of residues were in favored regions of the Ramachandran plot, 4.9% of residues in allowed regions, and 0.4% in disallowed regions. Residues in disallowed regions were also observed the 2.7 Å Gα q –PLCβ3-Δ887 structure 18 . Electron density was observed for residues 11–470 and 573–881 in chain A of PLCβ3, and 10–196, 199–470, and 575–881 in the second. Residues 471–572 correspond to a region of the X-Y linker that has low sequence homology and is typically poorly ordered 18 , 19 , 40 , 43 . In the distal CTD, the Dα3-Dα4 (residues 1009–1025) and Dα4-Dα5 (residues 1108–1114) loops and C-terminal residues 1193–1234 lacked electron density, consistent with being disordered ( Supplementary Fig. 3a ). In Gα q , electron density was observed for residues 18–354 in the first molecule and 35–355 in the second. Cryo-EM Sample Preparation and Imaging 3 µl of purified Gα q –PLCβ3 was adsorbed on glow-discharged Quantifoil R2/2 200 mesh grids, and vitrified using a Vitrobot (FEI Mark IV). The specimen was imaged on a Tecnai F20 transmission electron microscope (FEI) equipped with a field emission gun and operated at 120kV. Images were recorded at a magnification of 71,138x on a Gatan US4000 CCD camera and defocus values ranging from –2 to –3 µm. All images were binned (2 × 2 pixels) to obtain a pixel size of 4.48 Å on the specimen level. Cryo-EM 3D reconstructions and molecular modeling 40,124 particle projections from Gα q –PLCβ3 images were interactively selected and excised using Boxer (EMAN 1.9 software suite) 51 . The CTF parameters for each micrograph were determined using ctfit, and CTF correction was applied accordingly using the program Applyctf (part of EMAN 1.9 package). Multiple 3D reference-supervised classification was applied to the data set, using four possible models of the complex observed in the crystal lattice. These unique particle datasets were used to calculate four independent 3D reconstructions using the same initial reference of the Gα q –PLCβ3 core but lacking the distal CTD. 20 Å-filtered volumes of Gα q –PLCβ3 structures observed in the crystal lattice were computationally fitted as rigid bodies in the EM maps and cross-correlation values obtained using Chimera 52 . For a more detailed description, see Supplementary Note .
Show full methods section
Protein expression, purification, and mutagenesis N-terminally His-tagged human PLCβ3 (residues 10–1234) and variants were expressed in baculovirus infected insect cells and purified as described previously 19 , with the modification that resuspended cells were lysed by douncing on ice. Murine Gα q (residues 7–359) and variants were expressed and purified with a TEV-cleavable N-terminal His-tag as described previously 19 , with some modifications. Following elution from an Ni-NTA column, the protein was concentrated and applied to two tandem Superdex S200 columns equilibrated with 20 mM HEPES pH 8, 200 mM NaCl, 2 mM DTT, 1 mM MgCl 2 , and 10 µM GDP. Gα q used for complex crystallization had the His-tag removed by the addition of TEV protease at 2% (w/w) of Gα q , then dialyzed overnight at 4 °C in Buffer B (20 mM HEPES pH 8, 100 mM NaCl, 10 mM βME, 3 mM MgCl 2 , and 10 µM GDP). Following dialysis, the proteins were applied to a Ni-NTA column pre-equilibrated with Buffer B. The flow-through, containing TEV-cleaved Gα q , was collected, passed through the column three times, then concentrated and applied to two tandem Superdex S200 columns. Point mutations and internal deletions in the coding regions of PLCβ3 and Gα q were introduced using QuikChange Site-Directed Mutagenesis (Stratagene), and were confirmed by sequencing over the entire open reading frame.
Purification of the Gα q –PLCβ3 Complex TEV-cleaved
Gα q was incubated on ice with Buffer C (20 mM HEPES pH 8, 200 mM NaCl, 2mM DTT, 0.9 mM CaCl 2 , 5 mM MgCl 2 , 10 mM NaF, 30 µM AlCl 3 , and 50 µM GDP) for 15–20 min. Purified PLCβ3 was added to Gα q in a 1:1.2 molar ratio, and incubated for an additional 30 min on ice. The reaction was loaded on two tandem Superdex S200 columns equilibrated with Buffer C. Peak fractions containing Gα q –PLCβ3 were pooled and concentrated in a 100 kDa Amicon concentrator. Crystallization and Structure Determination of the Gα q –PLCβ3 Complex Gα q –PLCβ3 was suspended in hanging drops containing 1 µl Gα q –PLCβ3 at 6.2 mg ml −1 mixed with 1 µl well solution. The well solution contained 100 mM MES pH 6.75, 100–200 mM NaCl, and 11–12% PEG 3350, with crystals appearing in 4–7 d at 4 °C. Crystals were harvested in 20 mM HEPES pH 8, 400–500 mM NaCl, 2 M DTT, 0.9 mM CaCl 2 , 5 mM MgCl 2 , 10 mM NaF, 30 µM AlCl 3 , 50 µM GDP, 15% (w/v) PEG 3350, and 30% (v/v) 1,3-butanediol, then frozen on nylon loops in liquid nitrogen for data collection. Diffraction data was collected at the Advanced Photon Source at LS-CAT Beam line 21-ID-D and GM/CA-CAT beam line 23-ID-D from crystals maintained at 110 K at wavelengths of 1.13 Å and 1.03 Å respectively. Although initial diffraction to 3.3 Å spacings was observed, rapid decay limited useful data to 4.0 Å spacings ( Table 1 ). Data sets were reduced using HKL2000 48 , and initial phases were derived by molecular replacement using the 3OHM structure 18 as a search model. Models were refined via restrained refinement with TLS using the program REFMAC5 49 . Five TLS groups were used: one for each Gα q chain, its ligands (Mg 2+ , GDP, and AlF 4 − molecules) and its bound PLCβ3 proximal CTD (residues 863–881), one for each PLCβ3 catalytic core and its associated Ca 2+ atom, and one for the distal CTD. NCS restraints were imposed on the two Gα q chains (residues 39–353 and its ligands) and the two PLCβ3 chains (residues 16–194, 202–862, and the Ca 2+ atoms). Stereochemical correctness of the final model was assessed with MolProbity 50 . In the final model, 94.7% of residues were in favored regions of the Ramachandran plot, 4.9% of residues in allowed regions, and 0.4% in disallowed regions. Residues in disallowed regions were also observed the 2.7 Å Gα q –PLCβ3-Δ887 structure 18 . Electron density was observed for residues 11–470 and 573–881 in chain A of PLCβ3, and 10–196, 199–470, and 575–881 in the second. Residues 471–572 correspond to a region of the X-Y linker that has low sequence homology and is typically poorly ordered 18 , 19 , 40 , 43 . In the distal CTD, the Dα3-Dα4 (residues 1009–1025) and Dα4-Dα5 (residues 1108–1114) loops and C-terminal residues 1193–1234 lacked electron density, consistent with being disordered ( Supplementary Fig. 3a ). In Gα q , electron density was observed for residues 18–354 in the first molecule and 35–355 in the second. Cryo-EM Sample Preparation and Imaging 3 µl of purified Gα q –PLCβ3 was adsorbed on glow-discharged Quantifoil R2/2 200 mesh grids, and vitrified using a Vitrobot (FEI Mark IV). The specimen was imaged on a Tecnai F20 transmission electron microscope (FEI) equipped with a field emission gun and operated at 120kV. Images were recorded at a magnification of 71,138x on a Gatan US4000 CCD camera and defocus values ranging from –2 to –3 µm. All images were binned (2 × 2 pixels) to obtain a pixel size of 4.48 Å on the specimen level. Cryo-EM 3D reconstructions and molecular modeling 40,124 particle projections from Gα q –PLCβ3 images were interactively selected and excised using Boxer (EMAN 1.9 software suite) 51 . The CTF parameters for each micrograph were determined using ctfit, and CTF correction was applied accordingly using the program Applyctf (part of EMAN 1.9 package). Multiple 3D reference-supervised classification was applied to the data set, using four possible models of the complex observed in the crystal lattice. These unique particle datasets were used to calculate four independent 3D reconstructions using the same initial reference of the Gα q –PLCβ3 core but lacking the distal CTD. 20 Å-filtered volumes of Gα q –PLCβ3 structures observed in the crystal lattice were computationally fitted as rigid bodies in the EM maps and cross-correlation values obtained using Chimera 52 . For a more detailed description, see Supplementary Note .
PLCβ3 activity assays
PLCβ3 basal and Gα q -stimulated activity was determined by measuring the amount of free [ 3 H]-IP 3 released from [ 3 H]-PIP 2 -containing liposomes, as previously described 19 , 53 . PLCβ3 variants were assayed at a final concentration that resulted in activity within the linear range over the time course of the experiment. PLCβ3, PLCβ3 EEE, and PLCβ3-Δ882–937 were assayed at 0.3 ng µl −1 and PLCβ3 T652E at 3 ng µl −1 . PLCβ3-L876A, PLCβ3 L876A EEE, and PLCβ3-Δ882–937 L876A were assayed at 0.05 ng µl −1 . PLCβ3- Δ892 was assayed at 10 ng µl −1 and PLCβ3-Δ892 T652E at 20 ng µl −1 . Flow Cytometry Protein Interaction Assay (FCPIA) Equilibrium binding of PLCβ3 variants to Gα q variants was measured using FCPIA as described previously 19 , wherein a PLCβ3 variant with high affinity for Gα q (PLCβ3-Δ892 R872A L876A L879A) 19 was fluorescently labeled with Alexa-Fluor-488 (AF488) C 5 -maleimide (Invitrogen). Gα q proteins were biotinylated (b-Gα q ) 19 , 54 and linked to SPHERO Streptavidin Coated Particles (Spherotech). Unlabeled PLCβ3 variants were added to the bead-bound b-Gα q proteins over a range of concentrations, after which AF488-labeled PLCβ3-Δ892 R872A L876A L879A was added at its measured K D (40 nM) and incubated for 1 h prior to being processed with an Accuri C6 flow cytometer 19 .
Detection of Palmitoylated Gα q Purified His-tagged
Gα q variants at identical concentrations were diluted to a final volume of 400 µl in 50 mM HEPES pH 7.5, 150 mM NaCl, 1% Triton X-100, 25 mM N-ethylmaleimide (USB), protease inhibitors, and 0.1% SDS, then rotated overnight at 4 °C with 35 µl Ni-NTA beads. Samples were divided in half, with controls incubated with 0.5 M HEPES pH 7.5, and all other samples with 0.25 M HEPES pH 8 and 0.25 M hydroxylamine (Sigma-Aldrich). Samples were incubated and rocked for 4 h at room temperature. Ni-NTA beads were washed twice with PBS, and resuspended in 225 µl PBS. Samples were treated with 0.4 mM N-[6-(biotinamido)hexyl]-3'-(2'-pyridyldithio)propionamide (HPDP-biotin, Thermo Scientific) and incubated and rocked for 2 h at room temperature. Beads were washed once with PBS, and resuspended in SDS loading dye. Protection of cysteines via palmitoylation was then detected by western blot using a biotin antibody (StrepTactin-HRP Conjugate at 1:10,000 dilution, Biorad) 55 , 56 . Multi-Angle Light Scattering Purified PLCβ3 or Gα q –PLCβ3 were filtered and applied to a 50S size exclusion column with a molecular weight range of 15,000–5,000,000 Da connected to multi-angle wavelength detector (Wyatt Technology). The system was equilibrated with either PLCβ3 Buffer A (20 mM HEPES pH 8, 200 mM NaCl, 2 mM DTT, 0.1 mM EGTA, and 0.1 mM EDTA), or Gα q –PLCβ3 Buffer C. The molecular weights of PLCβ3 and Gα q –PLCβ3 were determined by fitting the elution peak of the protein using ASTRA software.
Statistical Methods
Statistical analyses used analysis of variance
(ANOVA) with a Tukey’s post test as implemented in Prism (version 5.0a). All comparisons deemed significant had P values of at least < 0.01. Figures . Structure images were generated using Pymol Version 1.5.0 (Schrödinger, LLC), and electrostatic surfaces were calculated using APBS 57 . Figures were created using Adobe ® Photoshop and Illustrator.
Statistical Methods
Statistical analyses used analysis of variance
(ANOVA) with a Tukey’s post test as implemented in Prism (version 5.0a). All comparisons deemed significant had P values of at least < 0.01. Figures . Structure images were generated using Pymol Version 1.5.0 (Schrödinger, LLC), and electrostatic surfaces were calculated using APBS 57 . Figures were created using Adobe ® Photoshop and Illustrator.
Supplementary Material 1
📊 Figures
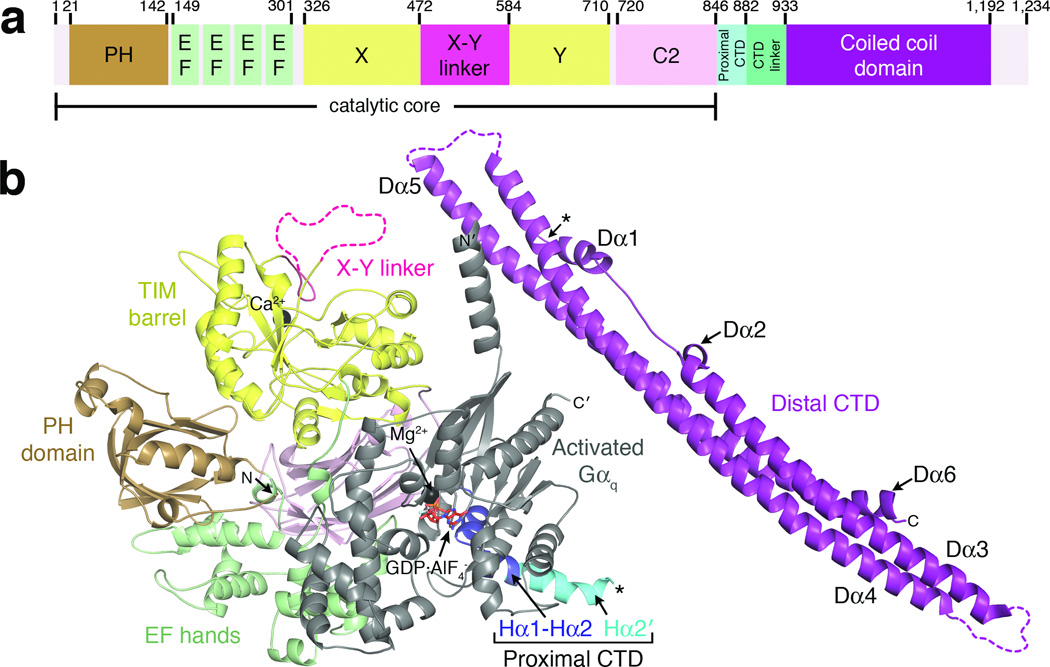
Figure 1
Crystal structure of Gu03b1 q u2013PLCu03b23 reveals the C-terminal coiled-coil domain (distal CTD) in the context of a fully active signaling complex. (a) Primary structure of human PLCu03b23. Number...
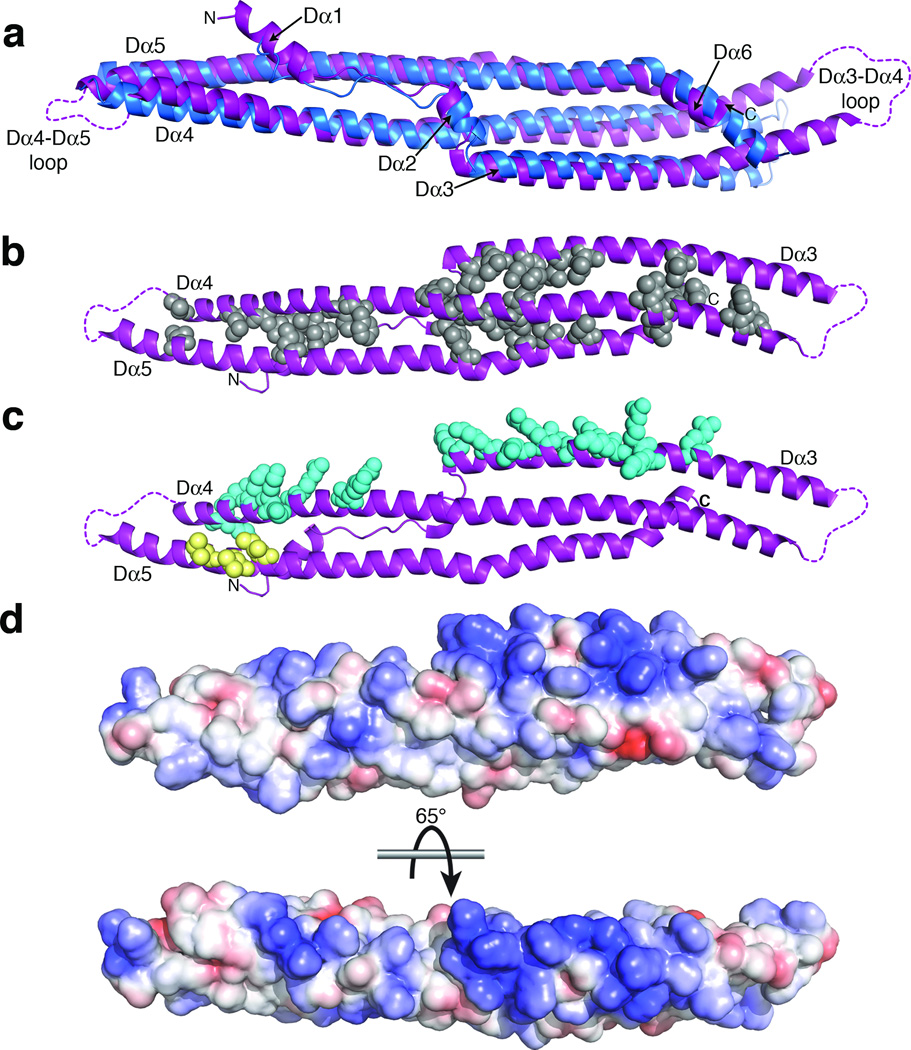
Figure 2
Structural comparison and sequence conservation of the PLCu03b2 distal CTD. (a ) Superposition of the distal CTDs from PLCu03b23 (purple) and turkey PLCu03b2 (blue) 26 . Although they have the same fo...
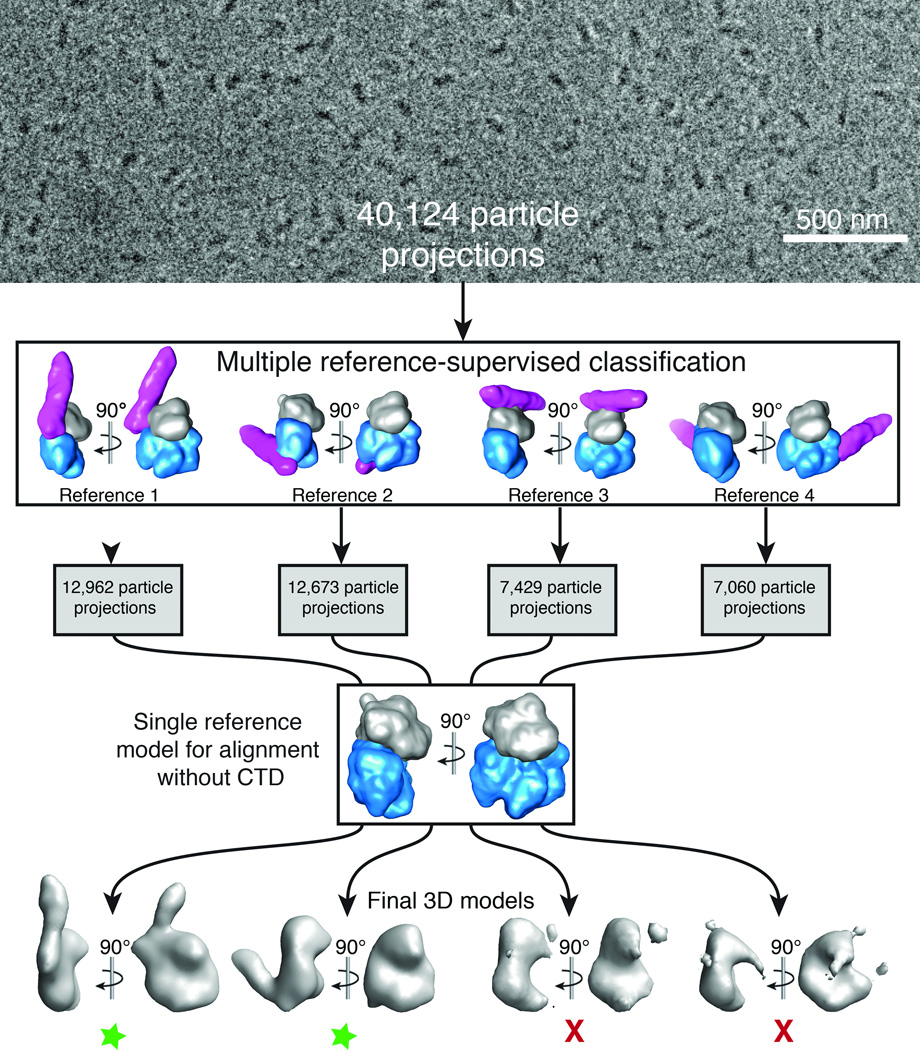
Figure 3
Cryo-EM projection classification and 3D reconstruction scheme. 40,124 particle projections were subjected to multiple 3D reference-supervised classification against volumes of four Gu03b1 q u2013PLCu...
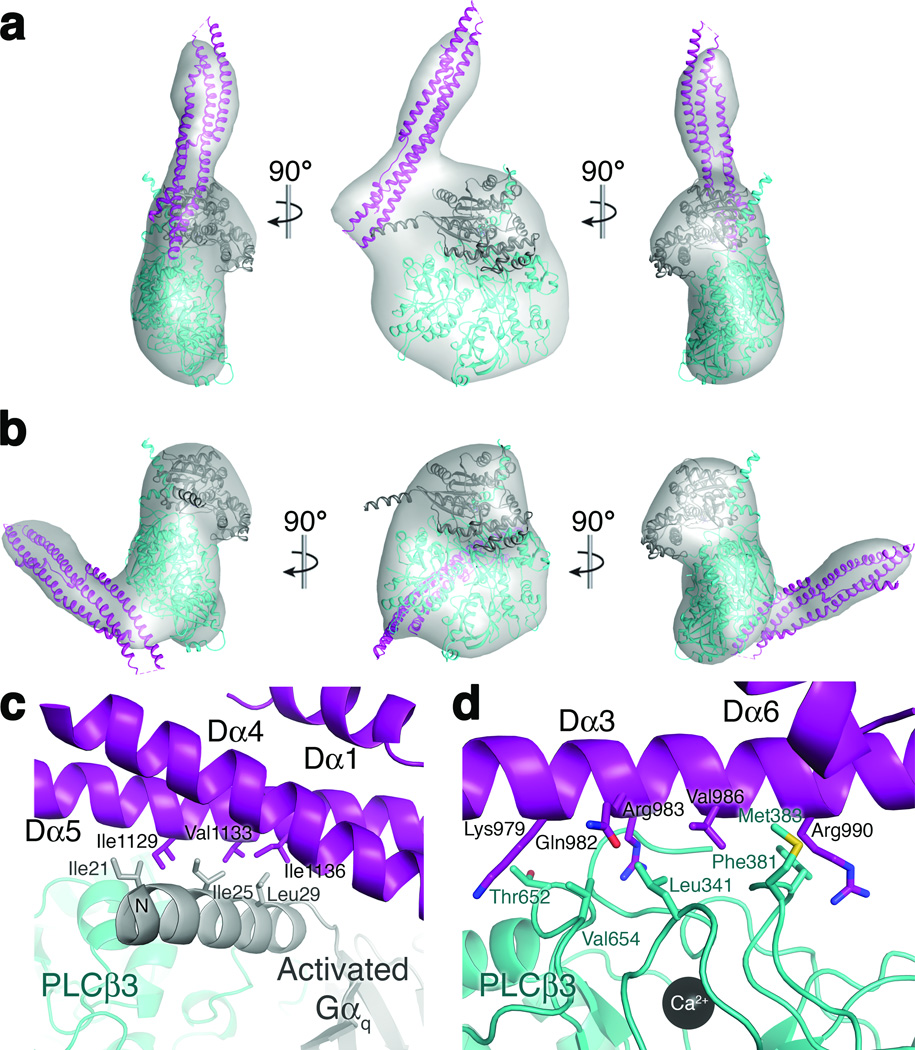
Figure 4
The distal CTD interacts with the N-terminal helix of Gu03b1 q and the PLCu03b23 catalytic core in solution and in crystals. ( a ) A 19 u00c5 3D EM reconstruction with docked crystal structure of the ...
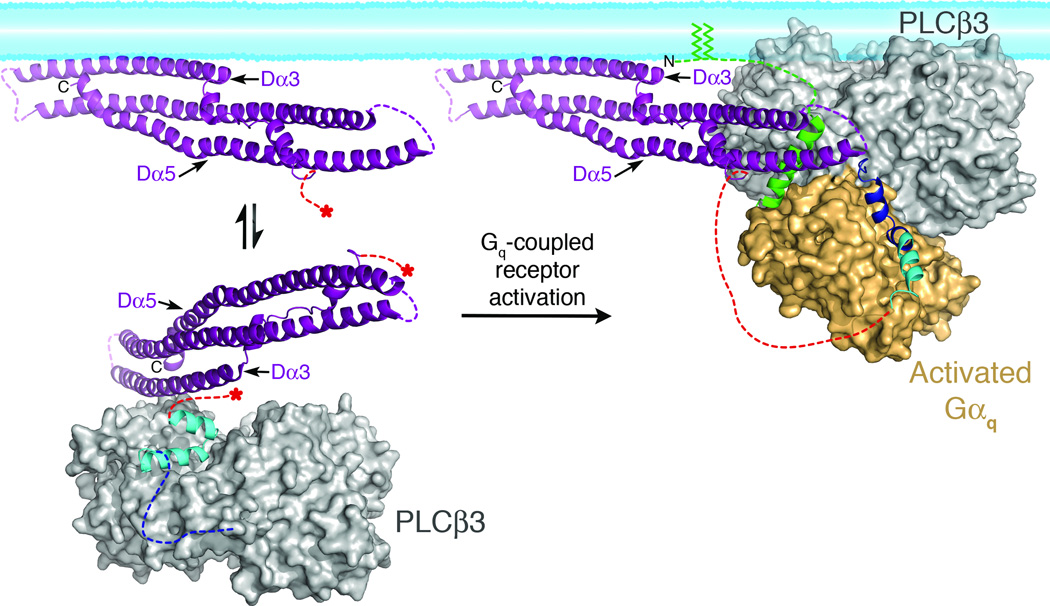
Figure 5
Model of PLCu03b23 regulation by the distal CTD and Gu03b1 q . In the absence of Gu03b1 q (left), the Hu03b12' inhibitory helix from the proximal CTD (cyan), is bound to the catalytic core (gray surfa...
Figure images are served from the NIH/NLM PubMed Central Open Access Subset or Europe PMC; copyright remains with the publishers and authors.
💬 Discussion
0 commentsNo comments yet. Be the first to start a discussion!
Leave a Comment