Abstract
The active properties of dendrites can support local nonlinear operations, but previous imaging and electrophysiological measurements have produced conflicting views regarding the prevalence and selectivity of local nonlinearities in vivo. We imaged calcium signals in pyramidal cell dendrites in the motor cortex of mice performing a tactile decision task. A custom microscope allowed us to image the soma and up to 300 μm of contiguous dendrite at 15 Hz, while resolving individual spines. New analysis methods were used to estimate the frequency and spatial scales of activity in dendritic branches and spines. The majority of dendritic calcium transients were coincident with global events. However, task-associated calcium signals in dendrites and spines were compartmentalized by dendritic branching and clustered within branches over approximately 10 μm. Diverse behavior-related signals were intermingled and distributed throughout the dendritic arbor, potentially supporting a large learning capacity in individual neurons.
🔬 Techniques
🔭 Microscopes
🧬 Organisms
💻 Software
✨ Fluorophores
🧪 Sample Preparation
🏭 Microscope Brands
🔴 Lasers
📷 Detectors
🔎 Objectives
🎨 Filters
💻 Software Details
💻 Code & Software
Repo for the paper: Functional clustering of dendritic activity during decision-making
Travelling Salesman Problem solver in pure Python + some visualizers
Python implementation of the constrained deconvolution algorithm
💾 Data Repositories
🏷️ Research Resource Identifiers (RRIDs)
Verified research resources used in this paper:
🏛️ Research Organizations (ROR)
Affiliated research institutions:
📋 Methods
Key resources table
Reagent type (species) or resource Designation Source or reference Identifiers Additional information Genetic reagent ( M. musculus ) Syt17 NO14 (Mouse) GENSAT MMRRC Cat# 034355-UCD, RRID: MMRRC_034355-UCD Genetic reagent ( M. musculus ) CamK2a-tTA JAX IMSR Cat# JAX:007004, RRID: IMSR_JAX:007004 Genetic reagent ( M. musculus ) Ai93 JAX IMSR Cat# JAX:024103, RRID: IMSR_JAX:024103 Genetic reagent ( M. musculus ) Chrna2 OE25 GENSAT MMRRC Cat# 036502-UCD, RRID: MMRRC_036502-UCD Genetic reagent ( M. musculus ) ZtTA JAX IMSR Cat# JAX: 012266, RRID: IMSR_JAX:012266 Software and Algorithms Matlab Mathworks RRID: SCR_001622 Software and Algorithms ScanImage Vidrio RRID: SCR_014307 Software and Algorithms Neuromantic University of Reading RRID: SCR_013597 Software and Algorithms Thunder Janelia RRID: SCR_016556 Software and Algorithms Spark Apache RRID: SCR_016557 Other MIMMS microscope 1.0 (2016) Janelia RRID: SCR_016511 Other Tip-Tilt-Z Sample Positioner Janelia RRID: SCR_016528 Animals All procedures were in accordance with protocols approved by the Janelia Institutional Animal Care and Use Committee. Triple transgenic mice (both male and female) sparsely expressing GCaMP6f in a subset of layer 2/3 (Syt17 NO14 x CamK2a-tTA x Ai93; MGI:4940641 x JAX:007004 x JAX:024103) and layer 5 (Chrna2 OE25 x ZtTA x Ai93; MGI:5311721 x JAX:012266 x JAX:024103), were housed in a 12 hr:12 hr reverse light:dark cycle. We never observed seizures in these mice, as has been reported for Emx1-Cre x Camk2a-tTa x Ai93 crosses ( Steinmetz et al., 2017 ). Surgical procedures were performed under isoflurane anesthesia (3% for induction, 1–1.5% during surgery). A circular (∼2.5 mm diameter) craniotomy was made above left ALM (centered at 2.5 mm anterior and 1.5 mm lateral to bregma). A window (triple #1 coverglass 2.5/2.5/3.5 mm diameter; Potomac Photonics, Baltimore, MD) was fixed to the skull using dental adhesive (C and B Metabond; Parkell, Edgewood, NY). A metal bar for head fixation was implanted posterior to the window with a metal loop surrounding the window using dental acrylic. After the surgery, mice recovered for 3–7 days with free access to water. Then, mice were water restricted to 1 mL daily. Training started 3–5 days after the start of water restriction. On days of behavioral training, mice were tested in experimental sessions lasting 1 to 2 hr where they received all their water. Unless otherwise noted in the figure legend, N = 14 neurons, seven mice for figure panels regarding layer 2/3 neurons and N = 5 neurons, four mice for figure panels regarding layer five neurons. Tactile decision task Mice solved an object localization task with their whiskers (modified from Guo et al., 2014a ; Guo et al., 2014b ). The stimulus was a metal pin (0.9 mm in diameter) mounted on a galvo motor to reduce vibrations. The pole swung into one of two possible positions ( Figure 2A ). The posterior pole position was approximately 5 mm from the center of the whisker pad. The anterior pole position was 4 mm anterior to the posterior position. A two-spout lickport (4.5 mm between spouts) delivered water reward and recorded the timing of licks. The sample epoch is defined as the time between the pole movement onset to pole retraction onset (sample epoch, 1.2 s total). The delay epoch lasted for another 2 s after the beginning of pole retraction (delay epoch, 2 s total). An auditory ‘response’ cue indicated the end of the delay epoch (pure tone, 3.4 kHz, 0.1 s duration). Licking early during the delay period resets the delay-period timer (2 s). Licking the correct lickport after the auditory ‘response’ cue led to a small drop of water reward. Licking the incorrect lickport was not rewarded nor punished. Trials in which mice did not lick after the ‘response’ cue were rare and typically occurred only at the end of a session. Animals were trained daily until they reached ∼70% correct. Thereafter behavior was combined with imaging (typically 20–40 days after surgery).
Show full methods section
Key resources table
Reagent type (species) or resource Designation Source or reference Identifiers Additional information Genetic reagent ( M. musculus ) Syt17 NO14 (Mouse) GENSAT MMRRC Cat# 034355-UCD, RRID: MMRRC_034355-UCD Genetic reagent ( M. musculus ) CamK2a-tTA JAX IMSR Cat# JAX:007004, RRID: IMSR_JAX:007004 Genetic reagent ( M. musculus ) Ai93 JAX IMSR Cat# JAX:024103, RRID: IMSR_JAX:024103 Genetic reagent ( M. musculus ) Chrna2 OE25 GENSAT MMRRC Cat# 036502-UCD, RRID: MMRRC_036502-UCD Genetic reagent ( M. musculus ) ZtTA JAX IMSR Cat# JAX: 012266, RRID: IMSR_JAX:012266 Software and Algorithms Matlab Mathworks RRID: SCR_001622 Software and Algorithms ScanImage Vidrio RRID: SCR_014307 Software and Algorithms Neuromantic University of Reading RRID: SCR_013597 Software and Algorithms Thunder Janelia RRID: SCR_016556 Software and Algorithms Spark Apache RRID: SCR_016557 Other MIMMS microscope 1.0 (2016) Janelia RRID: SCR_016511 Other Tip-Tilt-Z Sample Positioner Janelia RRID: SCR_016528 Animals All procedures were in accordance with protocols approved by the Janelia Institutional Animal Care and Use Committee. Triple transgenic mice (both male and female) sparsely expressing GCaMP6f in a subset of layer 2/3 (Syt17 NO14 x CamK2a-tTA x Ai93; MGI:4940641 x JAX:007004 x JAX:024103) and layer 5 (Chrna2 OE25 x ZtTA x Ai93; MGI:5311721 x JAX:012266 x JAX:024103), were housed in a 12 hr:12 hr reverse light:dark cycle. We never observed seizures in these mice, as has been reported for Emx1-Cre x Camk2a-tTa x Ai93 crosses ( Steinmetz et al., 2017 ). Surgical procedures were performed under isoflurane anesthesia (3% for induction, 1–1.5% during surgery). A circular (∼2.5 mm diameter) craniotomy was made above left ALM (centered at 2.5 mm anterior and 1.5 mm lateral to bregma). A window (triple #1 coverglass 2.5/2.5/3.5 mm diameter; Potomac Photonics, Baltimore, MD) was fixed to the skull using dental adhesive (C and B Metabond; Parkell, Edgewood, NY). A metal bar for head fixation was implanted posterior to the window with a metal loop surrounding the window using dental acrylic. After the surgery, mice recovered for 3–7 days with free access to water. Then, mice were water restricted to 1 mL daily. Training started 3–5 days after the start of water restriction. On days of behavioral training, mice were tested in experimental sessions lasting 1 to 2 hr where they received all their water. Unless otherwise noted in the figure legend, N = 14 neurons, seven mice for figure panels regarding layer 2/3 neurons and N = 5 neurons, four mice for figure panels regarding layer five neurons. Tactile decision task Mice solved an object localization task with their whiskers (modified from Guo et al., 2014a ; Guo et al., 2014b ). The stimulus was a metal pin (0.9 mm in diameter) mounted on a galvo motor to reduce vibrations. The pole swung into one of two possible positions ( Figure 2A ). The posterior pole position was approximately 5 mm from the center of the whisker pad. The anterior pole position was 4 mm anterior to the posterior position. A two-spout lickport (4.5 mm between spouts) delivered water reward and recorded the timing of licks. The sample epoch is defined as the time between the pole movement onset to pole retraction onset (sample epoch, 1.2 s total). The delay epoch lasted for another 2 s after the beginning of pole retraction (delay epoch, 2 s total). An auditory ‘response’ cue indicated the end of the delay epoch (pure tone, 3.4 kHz, 0.1 s duration). Licking early during the delay period resets the delay-period timer (2 s). Licking the correct lickport after the auditory ‘response’ cue led to a small drop of water reward. Licking the incorrect lickport was not rewarded nor punished. Trials in which mice did not lick after the ‘response’ cue were rare and typically occurred only at the end of a session. Animals were trained daily until they reached ∼70% correct. Thereafter behavior was combined with imaging (typically 20–40 days after surgery).
Microscope design
Ultrafast pulses (
📊 Figures
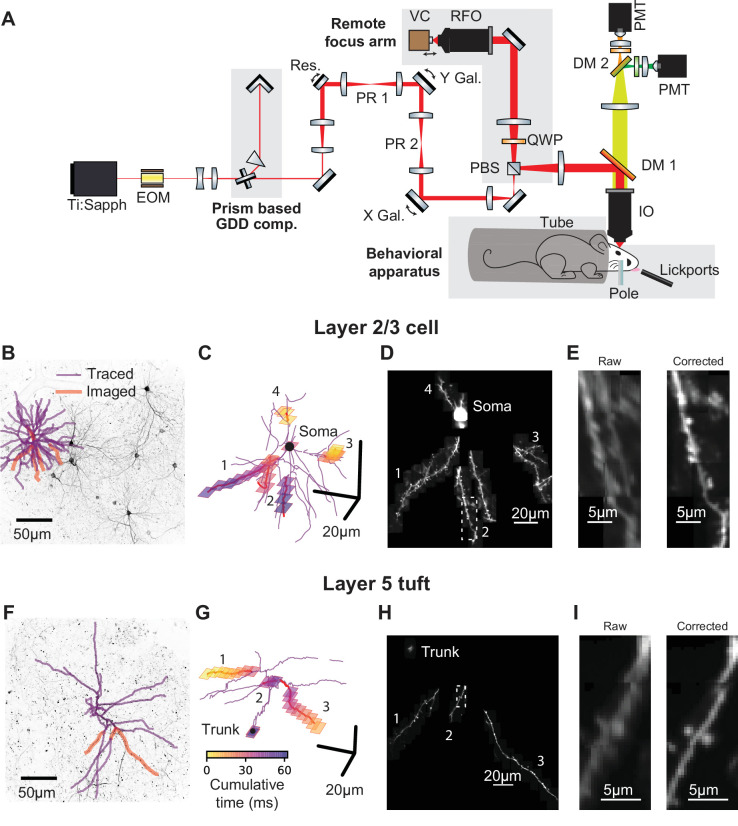
Figure 1.
Targeted high-speed imaging in behaving mice.
( A ) Optical layout for high-speed, high-resolution imaging in three dimensions. An x-axis mirror galvanometer, remote focusing arm, and prism-based GDD compensation unit were added to a high resolut...
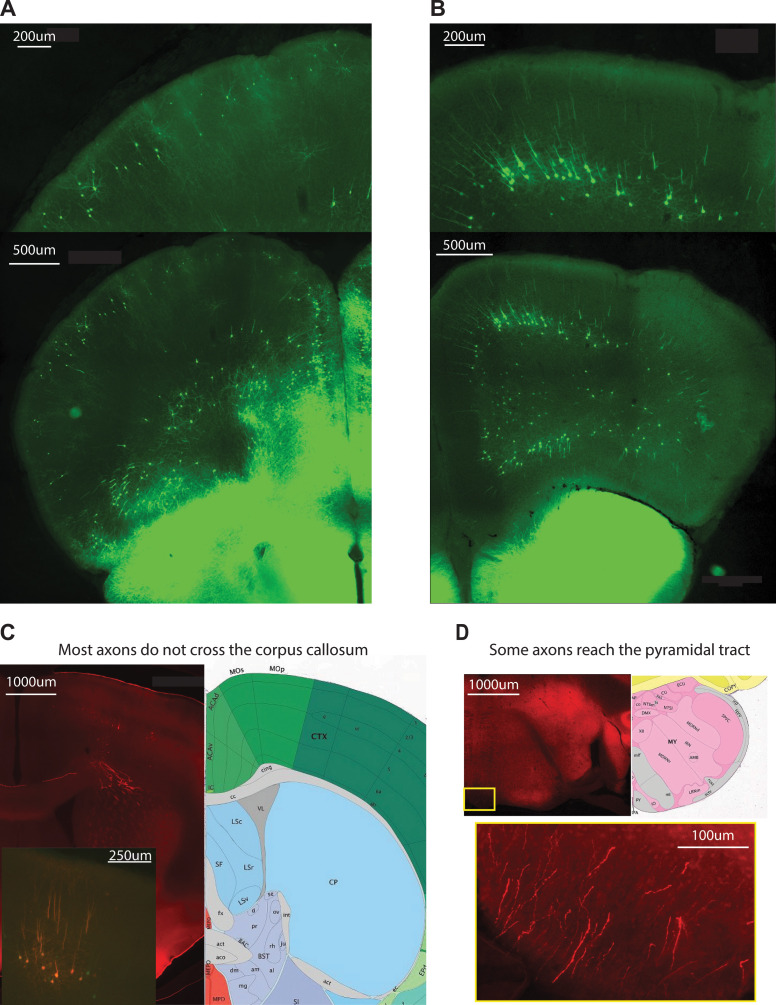
Figure 1u2014figure supplement 1.
Histological characterization of transgenic mouse lines.
( A )u00a0GCaMP labeling in an example coronal section of Syt17-Cre x Ai93 approximately 1.5 mm anterior to bregma. ( B ) GCaMP labeling in an example coronal section of OE25-Cre x Ai93 approximately ...
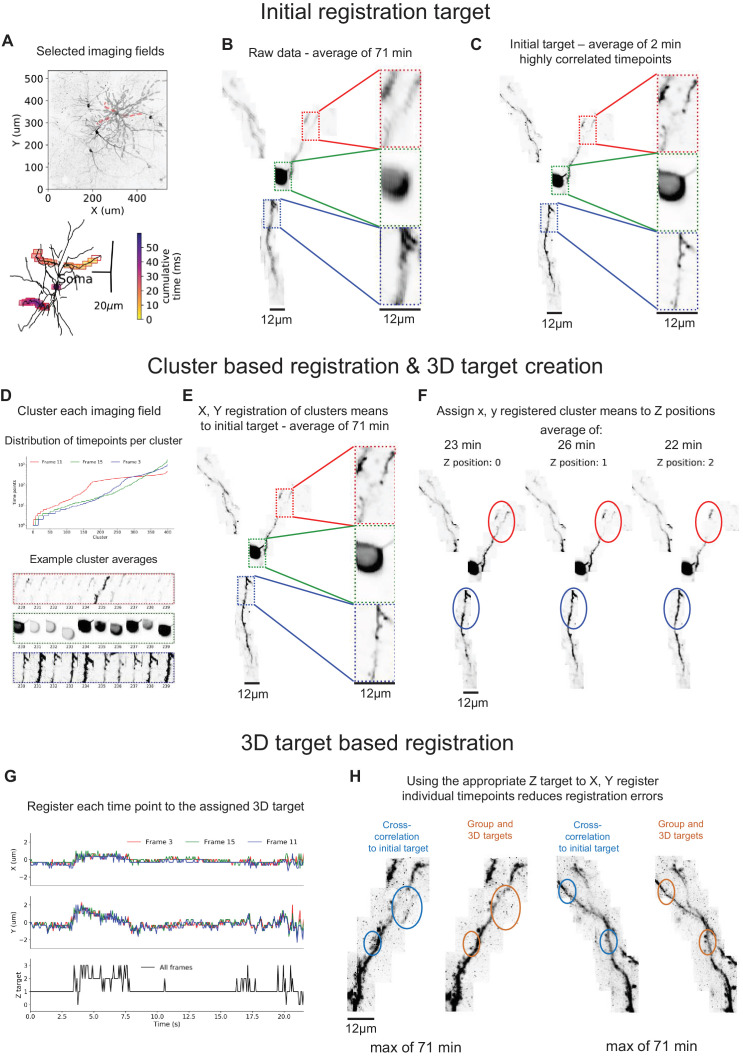
Figure 1u2014figure supplement 2.
Imageu00a0regestrationu00a0example.
( A )u00a0Tracing of dendrites (top) and spatiotemporal distribution of imaging frames (bottom) for an example L2/3 cell imaging session. ( B ) Maximum intensity projection (MIP, 80 u03bcm z-axis) of ...
Figure 1u2014video 1.
Registration Example.
Top, target for registration is in yellow, single timepoints are in blue. Red arrows indicate the calculated shifts per imaging field. Arrows are 3x real size to emphasize the pixel sized shifts. Bott...
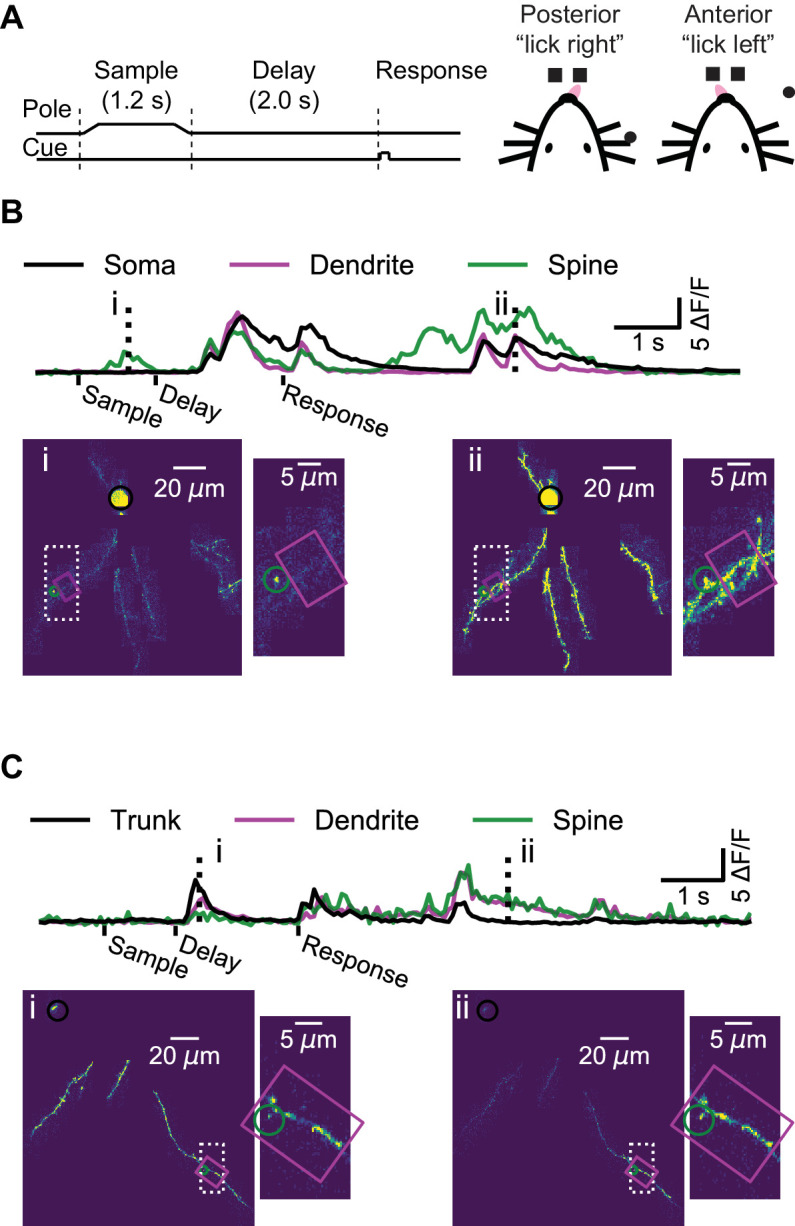
Figure 2.
Dendrite and spine calcium activity.
( A ) Mice were trained to lick either a right or left target based on pole location. The pole was within reach of the whiskers during the sample epoch. Mice were trained to withhold licks until after...
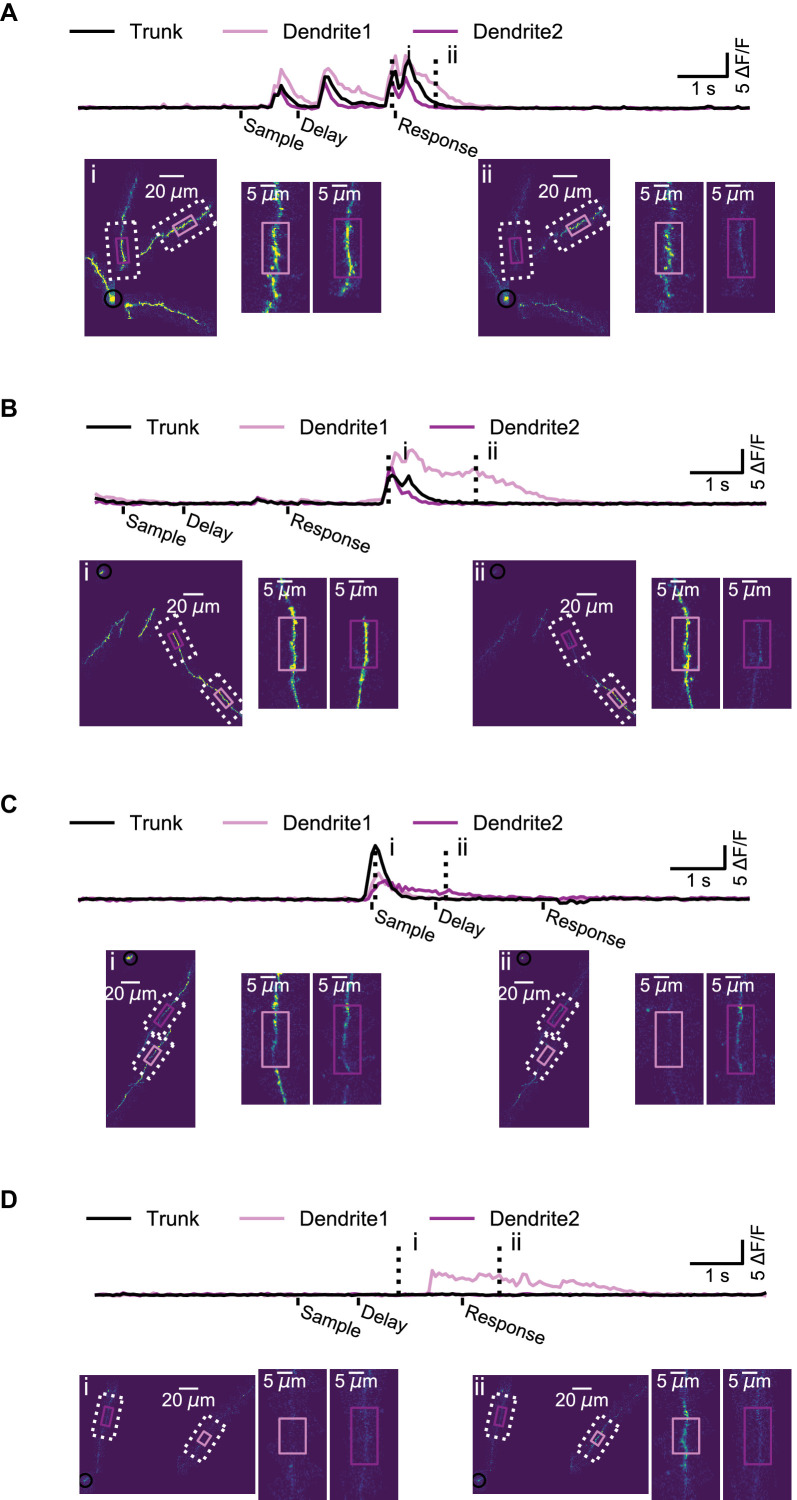
Figure 2u2014figure supplement 1.
Examples of branch-specific persistent calcium activity.
( A )u00a0Example of branch-specific persistence of calcium activity following multi-branch events in the dendrites of a L2/3 neuron (soma not imaged in this session). Top, example apical trunk (black...
Figure 2u2014video 1.
Layer 2/3 Example Calcium Activity.
Top, post-registration activity (AU) for the soma (white), an example spine (green circle), and a segment of dendrite (magenta arrow). Bottom, u0394F/F of the soma (white), spine (green), and dendrite...
Figure 2u2014video 2.
Layer 5 Example Calcium Activity.
Top, post-registration activity (AU) for the trunk (white), an example spine (green circle), and a segment of dendrite (magenta arrow). Bottom, u0394F/F of the soma (white), spine (green), and dendrit...
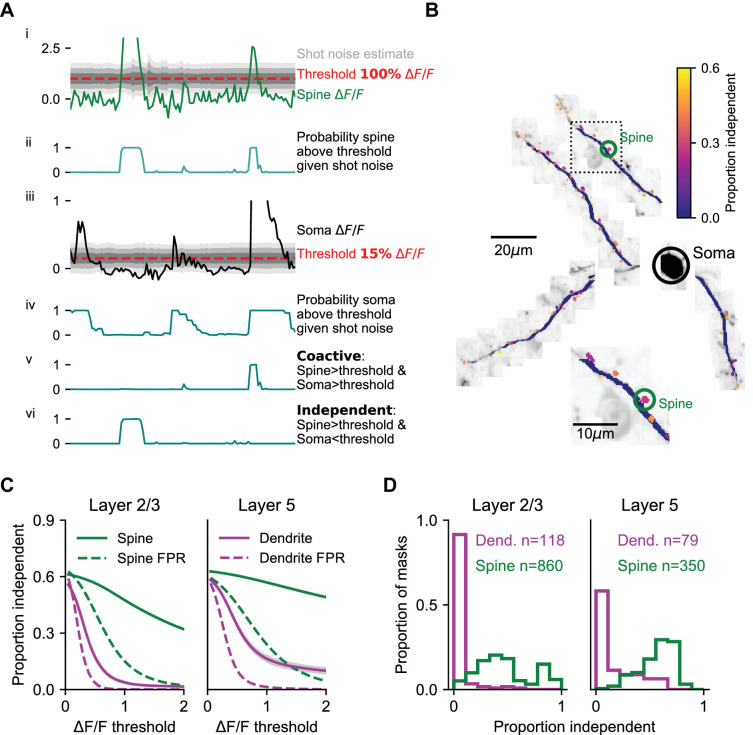
Figure 3.
Coincidence of dendritic calcium transients with events in the soma and apical trunk.
( A ) Estimation of isolated spine activity as a function of threshold. (i) Example spine u0394F/F (green), threshold (red - 100% u2206F/F) and estimated uncertainty in u0394F/F due to shot-noise (gra...
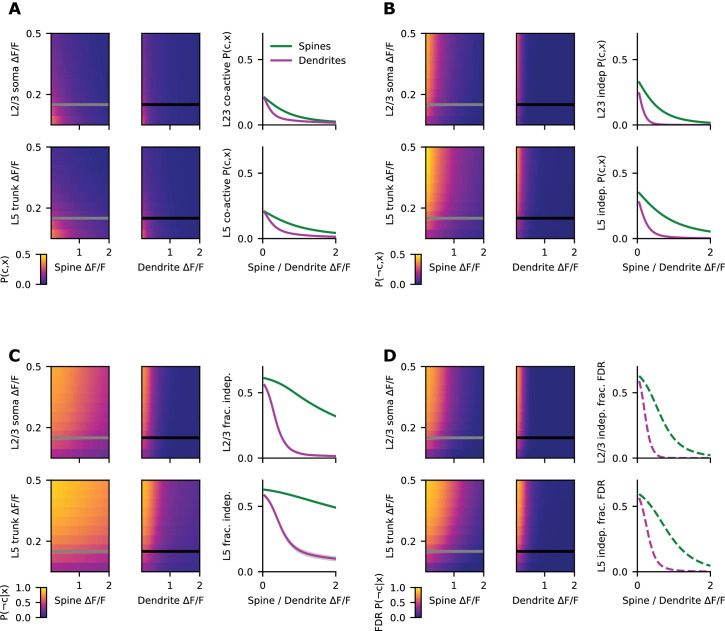
Figure 3u2014figure supplement 1.
Coincidence activity analysis with different thresholds.
( A )u00a0Proportion of time that dendritic spines (left heatmaps) or dendritic segments (right heatmaps) are co-active with the bAP reference signal (soma or apical trunk) as a function of arbitrary ...
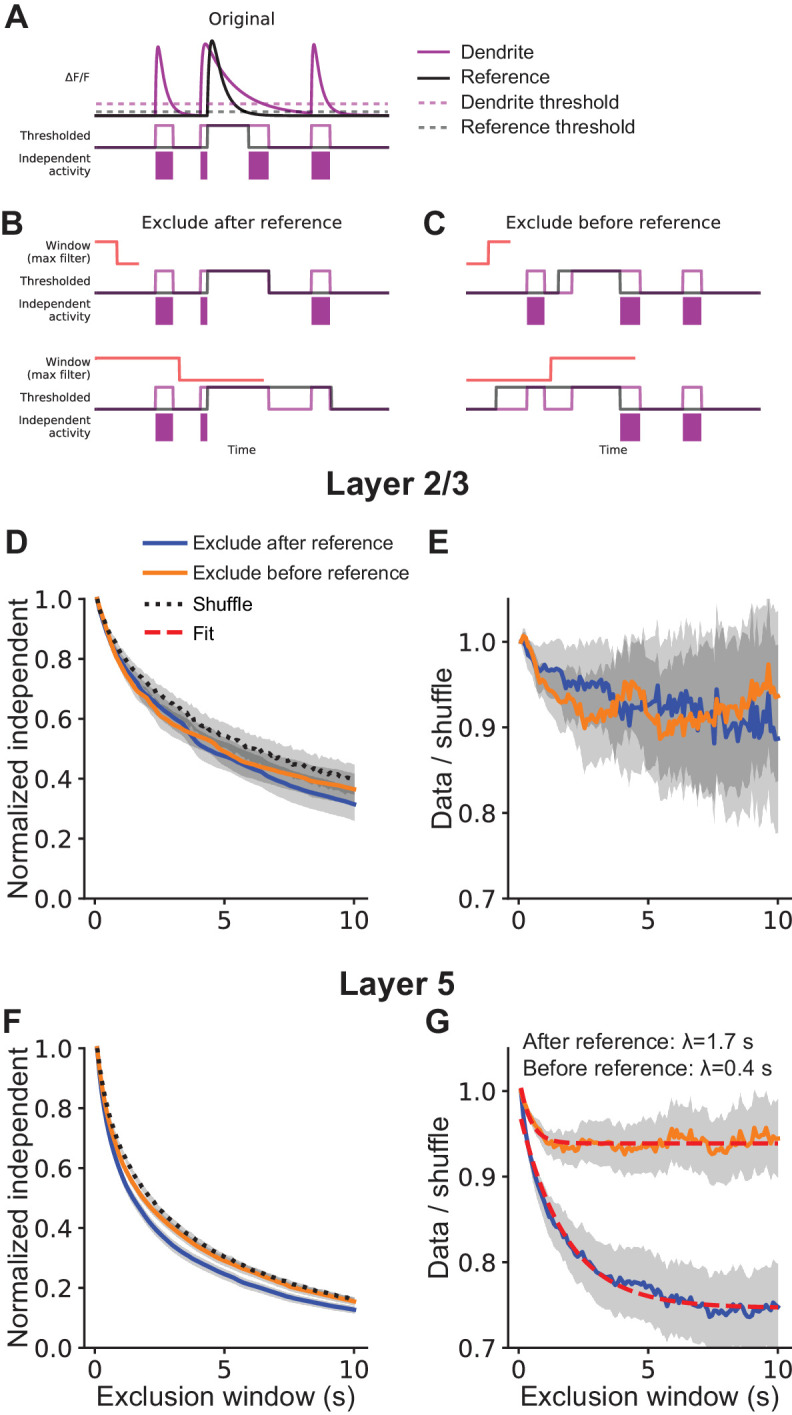
Figure 3u2014figure supplement 2.
Excluding independent activity before or after reference activity.
( A )u00a0Illustration of the transformation of reference (black) and dendritic (magenta) fluorescence signals to an estimate of independent activity (see Figure 3A ; Materialsu00a0andu00a0methods). (...
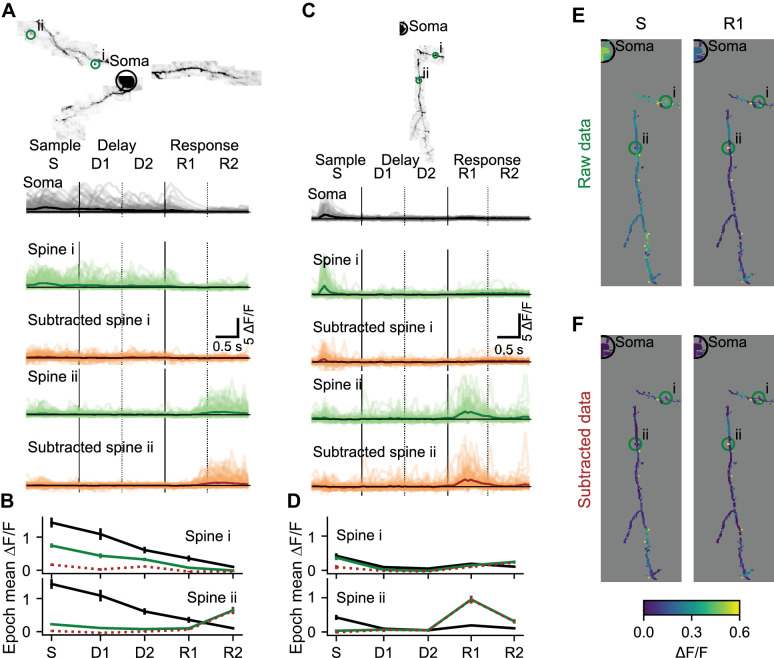
Figure 4.
Local selectivity after removing the bAP component.
( A ) Subtraction of the bAP component from spine signals and estimation of trial average responses for two example spines. Image: MIP of an example L2/3 cell. Light lines: u0394F/F for all 110 correc...
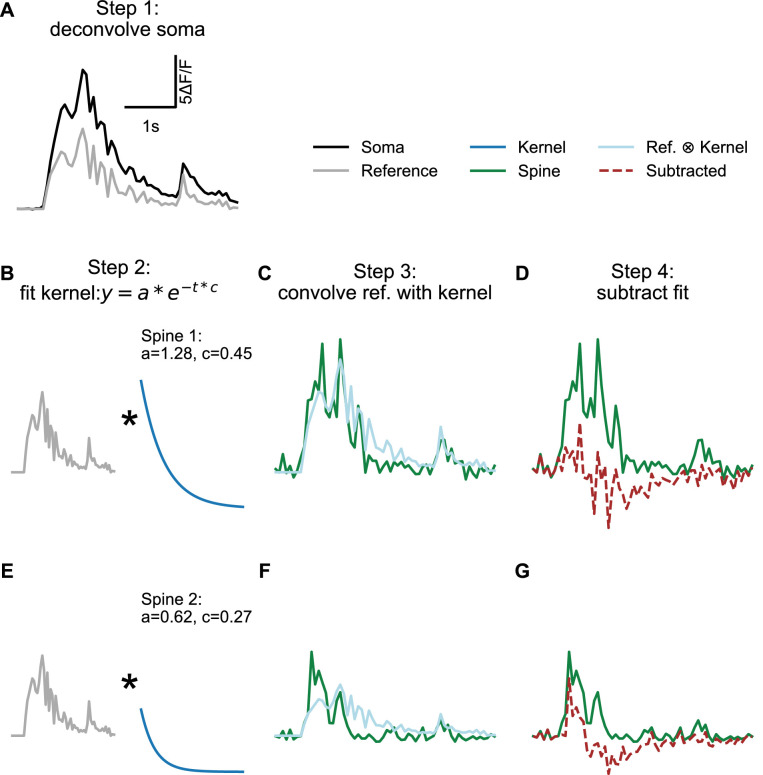
Figure 4u2014figure supplement 1.
Process for removing the estimated bAP-component of spine and dendritic segment signals.
( A )u00a0Example reference signal (soma; black line). The reference signal was deconvolved by FOOPSI ( Pnevmatikakis et al., 2016 ; Vogelstein et al., 2010 ) with parameters set to bias towards a den...
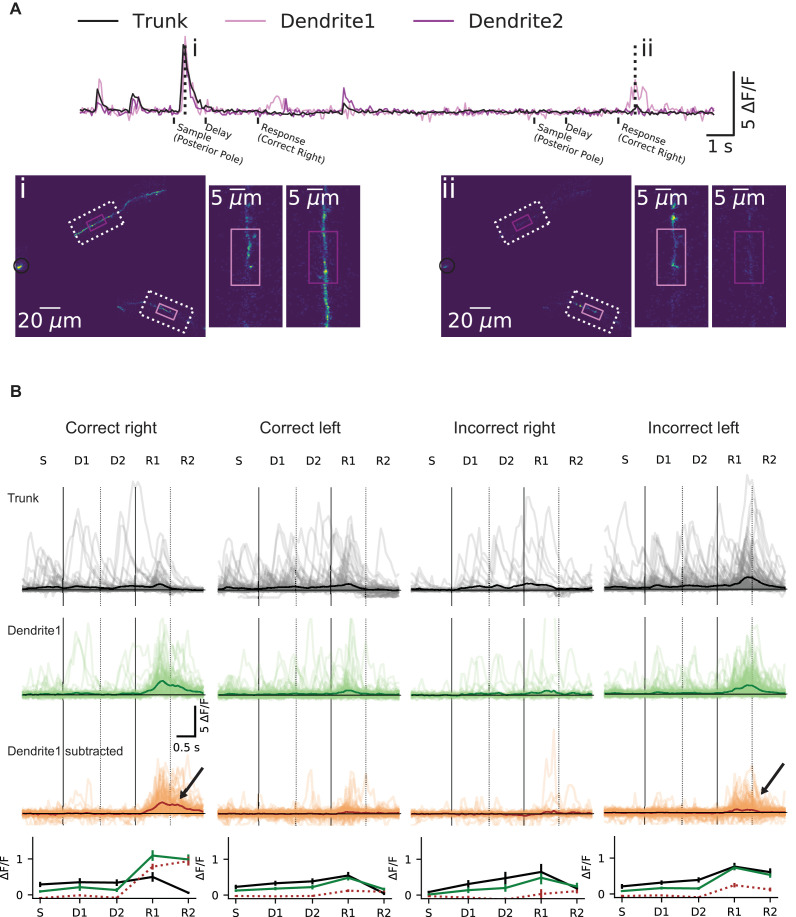
Figure 4u2014figure supplement 2.
Example of independent and trial averaged activity in a L5 tuft dendrite segment.
( A )u00a0Top, example apical trunk (black) and two dendritic branches (light and dark magenta) calcium signals. Bottom, maximum intensity projections (au) and branch insets at example times (dashed v...
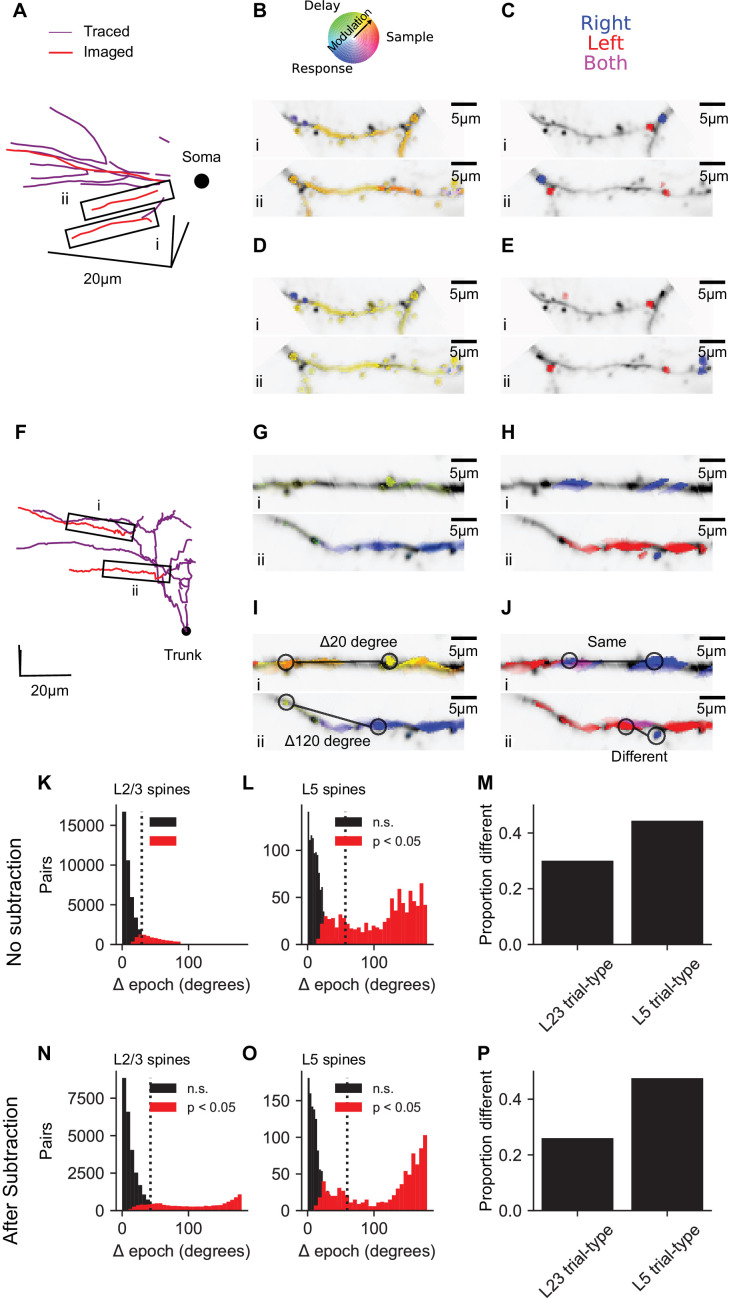
Figure 5.
Dendrite and spine calcium signals exhibit diverse selectivity for trial epoch and trial type.
( A ) Location of simultaneously imaged dendrite (red lines) relative to the soma (black dot) and connecting dendrite (purple) that was not imaged for an example imaging session of a L2/3 cell. ( B ) ...
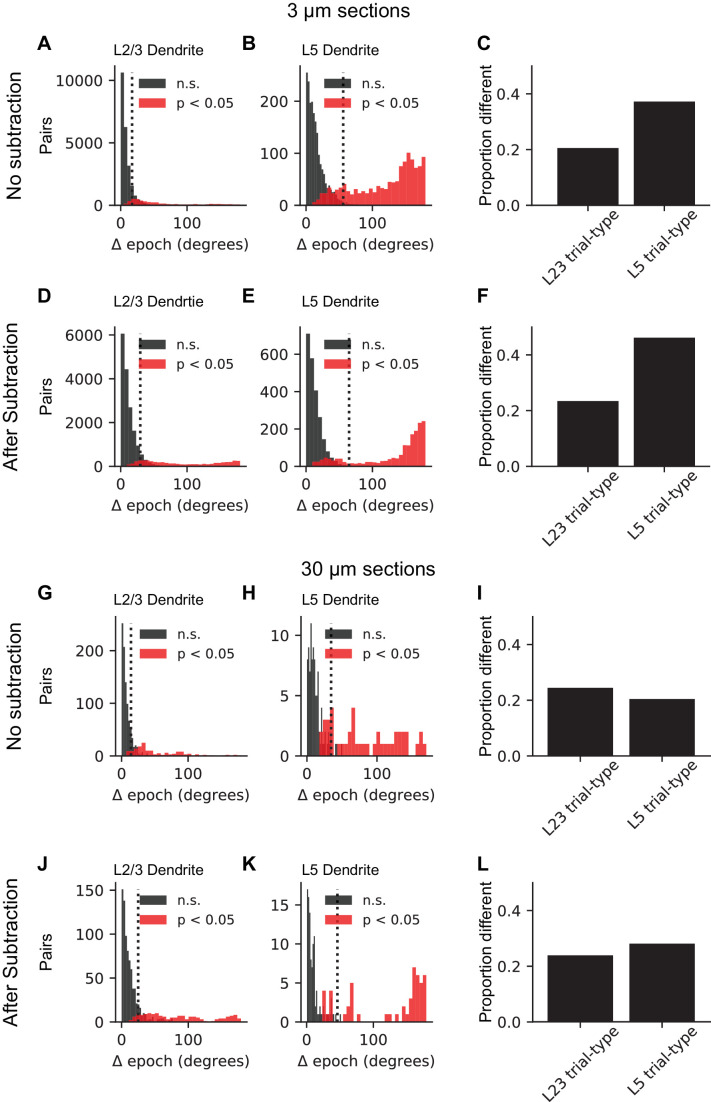
Figure 5u2014figure supplement 1.
Dendrite Signals Exhibit Diverse Selectivity for Trial Epoch and Trial Type.
( A ) Distribution for L2/3 neurons of differences in epoch selectivity between epoch selective dendrite segments of 3 um (epoch angle CIu00a0<30 degrees) on the same neuron for L2/3 neurons (Nu00a...
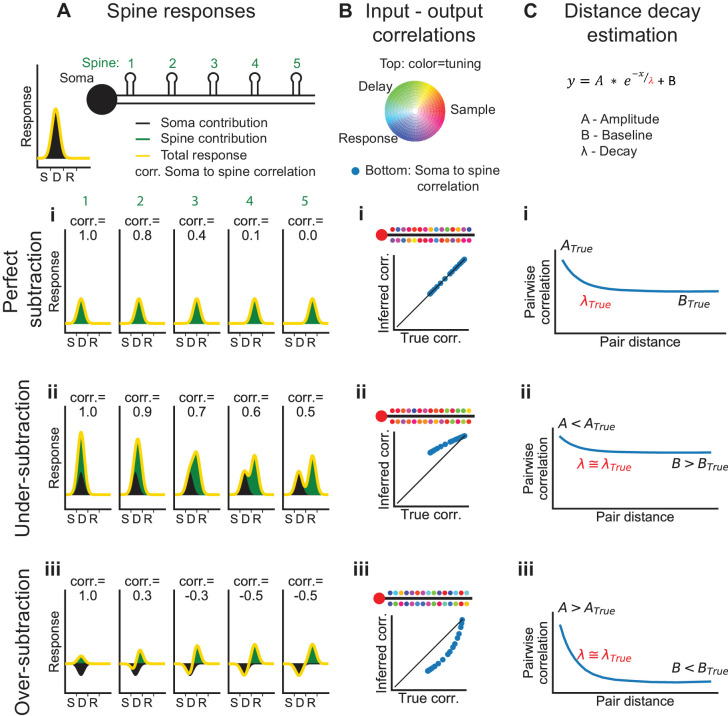
Figure 6.
Interpretation of dendritic calcium signals before and after removal of the estimated contribution from back-propagating action potentials (bAPs).
( A ) Spine responses under different bAP subtraction regimes. Top, Cartoon of the soma and spatial organization of five spines. Soma trial-average response (black curve) is centered between the sampl...
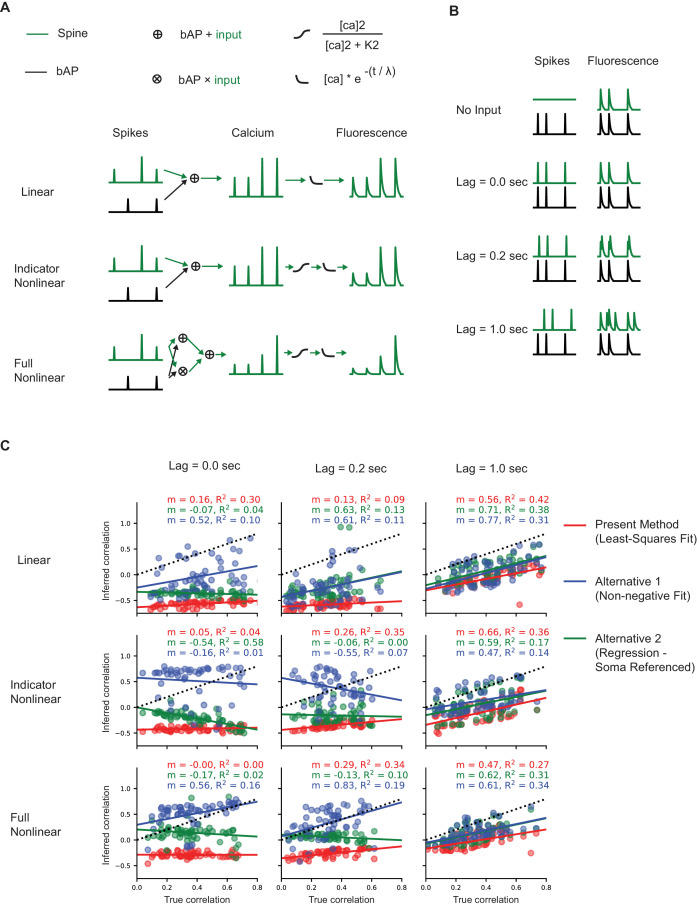
Figure 6u2014figure supplement 1.
Simulating the effects of removing the estimated bAP-component on the inferred correlation between spines and the reference signal.
( A )u00a0Conceptual diagram of three processes for simulating fluorescence at spines from pre- and post-synaptic spiking. Traces are normalized to maximum. ( B ) Illustration of how the temporal stru...
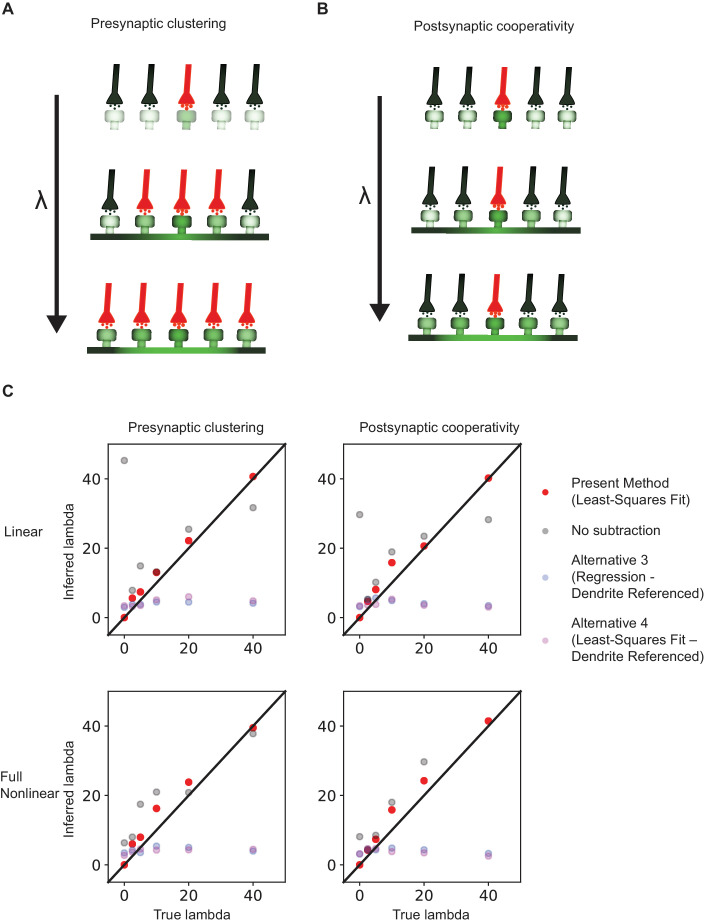
Figure 6u2014figure supplement 2.
Simulating the effects of removing the estimated bAP-component on the inferred length constant of correlation between spines.
( A )u00a0Illustration of simulating pre-synaptic clustering. Correlation in the spiking of pre-synaptic input varied as a function of distance between the inputs along the dendrite. ( B ) Illustratio...
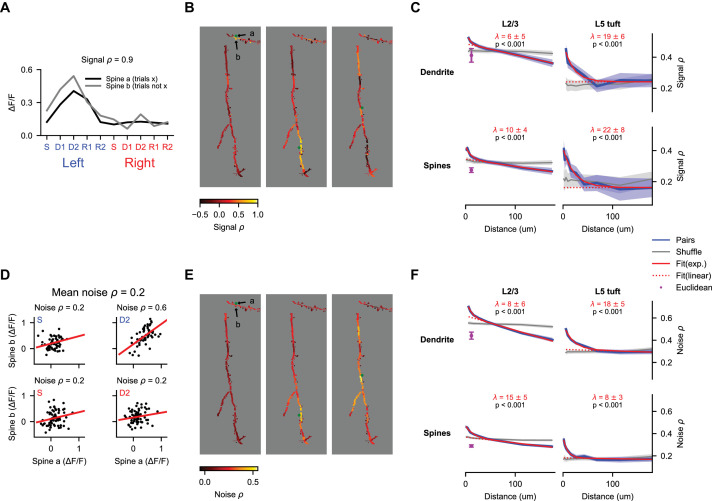
Figure 7.
Behavior-related calcium signals are organized in a distance-dependent manner within the dendritic tree.
( A ) Estimation of pairwise signal correlation after bAP subtraction for two example spines (denoted in ( B )). Trial average responses for each epoch and trial type are calculated for each mask from...
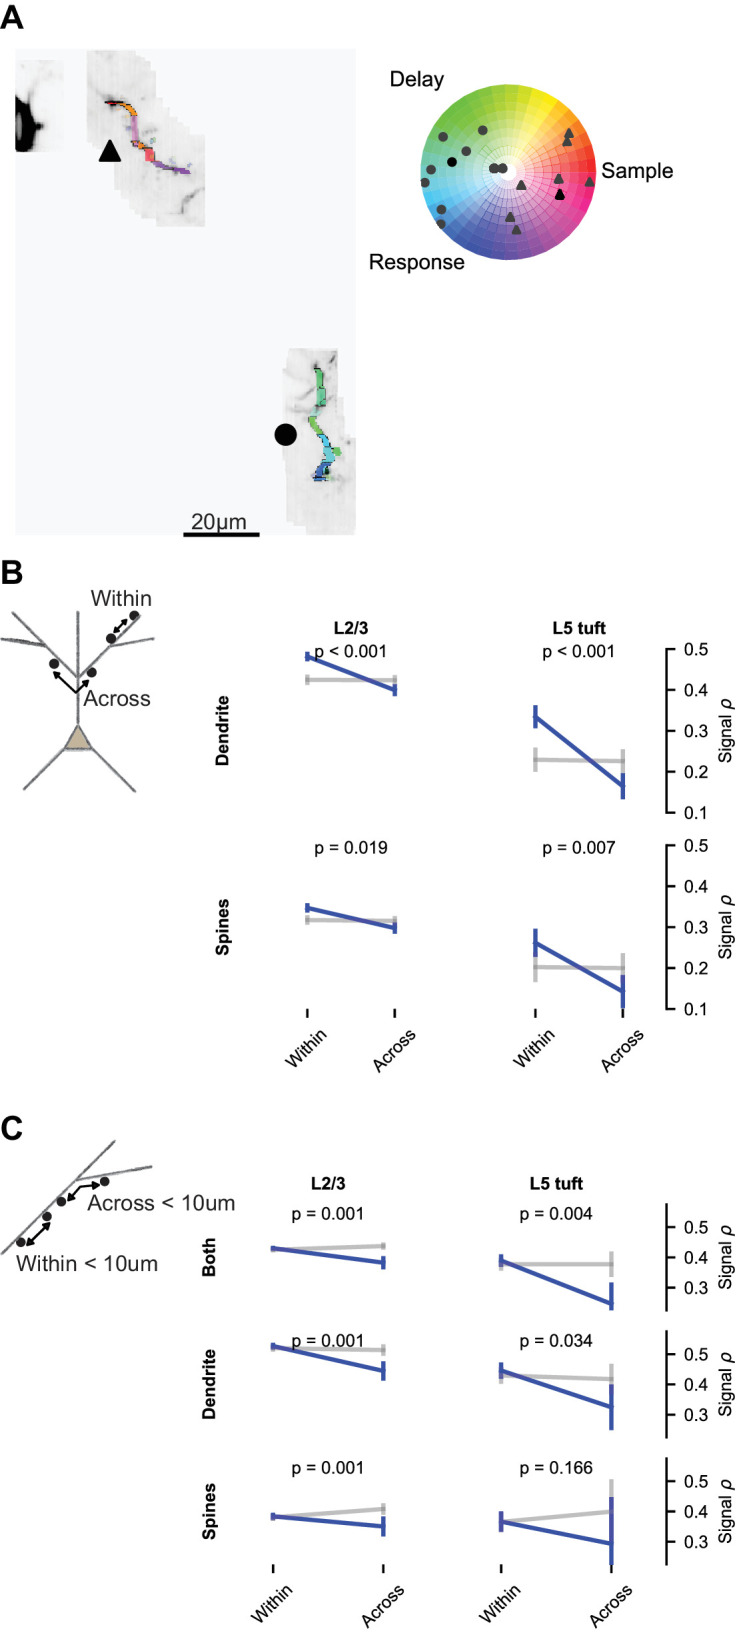
Figure 8.
Dendritic branching compartmentalizes behavior-related calcium signals.
( A ) Example of clustering of epoch selectivity for a L2/3 session. Hue and saturation were determined for each mask as in Figure 5B after bAP subtraction. Markers (gray: individual masks, black: mea...
Video 1.
Exploring the data online with SpineVis.
In this screencast we show how to use the SpineVis website to look at the data in Figure 2B . On top center is the main viewing area where dragging will change the view in 3D. Clicking on a mask in th...
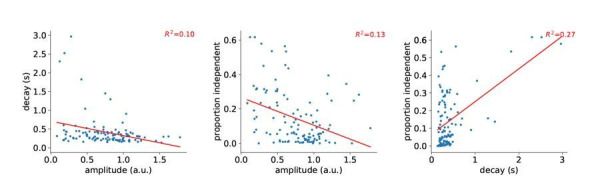
Author response image 1.
Correlation between decay, amplitude, and proportion independent.
Each point is a 30 u03bcm segment of a L5 tuft dendrite.
Figure images are served from the NIH/NLM PubMed Central Open Access Subset or Europe PMC; copyright remains with the publishers and authors.
💬 Discussion
0 commentsNo comments yet. Be the first to start a discussion!
Leave a Comment