Abstract
Abstract Single particle cryogenic-electron microscopy (cryo-EM) is used extensively to determine structures of activated G protein-coupled receptors (GPCRs) in complex with G proteins or arrestins. However, applying it to GPCRs without signaling proteins remains challenging because most receptors lack structural features in their soluble domains to facilitate image alignment. In GPCR crystallography, inserting a fusion protein between transmembrane helices 5 and 6 is a highly successful strategy for crystallization. Although a similar strategy has the potential to broadly facilitate cryo-EM structure determination of GPCRs alone without signaling protein, the critical determinants that make this approach successful are not yet clear. Here, we address this shortcoming by exploring different fusion protein designs, which lead to structures of antagonist bound A 2A adenosine receptor at 3.4 Å resolution and unliganded Smoothened at 3.7 Å resolution. The fusion strategies explored here are likely applicable to cryo-EM interrogation of other GPCRs and small integral membrane proteins.
🔬 Techniques
🧬 Organisms
🧪 Sample Preparation
🔬 Cell Lines
🏭 Microscope Brands
🧪 Reagent Suppliers
📷 Detectors
💻 Software Details
💾 Data Repositories
🏛️ Research Organizations (ROR)
Affiliated research institutions:
📋 Methods
SMO expression, purification, and Salipro reconstitution Recombinant mouse SMO gene (amino acids 64–566) was cloned into a pFastBac1-CMV vector containing an expression cassette with an HA signal sequence followed by a Flag epitope tag (sequence: DYKDDDDA), Strep-tag II peptide (sequence: WSHPQFEK), and tobacco etch virus (TEV) protease recognition site at the N-terminus, with PGS or BRIL fused in ICL3 and with a rhinovirus 3 C protease recognition site and 8xHis tag at the C terminus of SMO. Through the BacMam approach, Sf9 insect cells and HEK293S GnTI − cells were used to generate the baculovirus and 48 h expression of SMO with 10 mM sodium butyrate added after 24 h transduction, respectively. Cells were collected by moderate centrifugation and stored at −80 °C until further use. Frozen cell pellets were thawed in the buffer containing 25 mM HEPES, pH 7.4, 150 mM NaCl, and 400 uM TCEP, supplemented with protease inhibitor cocktail (sigma), and then solubilized with the working buffer containing 40 mM HEPES, pH 7.4, 150 mM NaCl, 0.75% (w/v) n-dodecyl-β-D-maltopyranoside (DDM, Anatrace)/0.15% (w/v) cholesteryl hemisuccinate (CHS, Sigma), 10% glycerol, and 400 uM TCEP for 2.5 h at 4 °C. After centrifugation, the resulting supernatant was loaded on Ni-NTA resin (Thermo Scientific) which was subsequently treated with 50 mM HEPES, pH 7.4, 150 mM NaCl, 0.03% DDM/0.006% CHS, 10% glycerol, and 100 uM TCEP plus 30 mM imidazole for washing and plus 200 mM imidazole for eluting, respectively. After incubation with ANTI-FLAG M2 Affinity Gel (sigma) overnight at 4 °C, the beads were washed extensively and the receptors were eluted with 50 mM HEPES, pH 7.4, 150 mM NaCl, 0.03% DDM/0.006% CHS, 10% glycerol, 100 uM TCEP, and 0.2 mg/ml 3xFlag peptide. For Salipro reconstitutions of both SMO-PGS and SMO-BRIL samples, membrane scaffold protein Saposin A was expressed and purified from Escherichia coli . Lipids mixture (55.2%POPC:36.8%POPG:8%cholesterol at mass ratio) was prepared as previously described 39 . Purified SMO protein in detergent (DDM/CHS) was mixed with Saposin A and lipids mixture using the malor ratio SMO:Saposin A:lipids = 1:3:47 and incubated on ice for 10-30 min. Detergents were removed by adding 2–3 batches of Bio-beads SM2 (Bio-Rad) with constant rotation overnight. The reconstituted receptors were cleared by moderate centrifugation via spin filter microtubes (Merck Millipore Ltd.) followed by size-exclusion chromatography using a Superdex 200 Increase 10/300 GL column (GE) equilibrated with buffer containing 20 mM HEPES-NaOH, pH 7.4, 150 mM NaCl, and 100 μM TCEP. The peak fractions corresponding to SMO in Salipro particles were pooled, concentrated to around 2.6 mg ml −1 using Amicon Ultra filter device (50 kDa MWCO, Millipore), and assessed by SDS-PAGE and negative-stain EM before cryo-EM grid preparation.
Show full methods section
SMO expression, purification, and Salipro reconstitution Recombinant mouse SMO gene (amino acids 64–566) was cloned into a pFastBac1-CMV vector containing an expression cassette with an HA signal sequence followed by a Flag epitope tag (sequence: DYKDDDDA), Strep-tag II peptide (sequence: WSHPQFEK), and tobacco etch virus (TEV) protease recognition site at the N-terminus, with PGS or BRIL fused in ICL3 and with a rhinovirus 3 C protease recognition site and 8xHis tag at the C terminus of SMO. Through the BacMam approach, Sf9 insect cells and HEK293S GnTI − cells were used to generate the baculovirus and 48 h expression of SMO with 10 mM sodium butyrate added after 24 h transduction, respectively. Cells were collected by moderate centrifugation and stored at −80 °C until further use. Frozen cell pellets were thawed in the buffer containing 25 mM HEPES, pH 7.4, 150 mM NaCl, and 400 uM TCEP, supplemented with protease inhibitor cocktail (sigma), and then solubilized with the working buffer containing 40 mM HEPES, pH 7.4, 150 mM NaCl, 0.75% (w/v) n-dodecyl-β-D-maltopyranoside (DDM, Anatrace)/0.15% (w/v) cholesteryl hemisuccinate (CHS, Sigma), 10% glycerol, and 400 uM TCEP for 2.5 h at 4 °C. After centrifugation, the resulting supernatant was loaded on Ni-NTA resin (Thermo Scientific) which was subsequently treated with 50 mM HEPES, pH 7.4, 150 mM NaCl, 0.03% DDM/0.006% CHS, 10% glycerol, and 100 uM TCEP plus 30 mM imidazole for washing and plus 200 mM imidazole for eluting, respectively. After incubation with ANTI-FLAG M2 Affinity Gel (sigma) overnight at 4 °C, the beads were washed extensively and the receptors were eluted with 50 mM HEPES, pH 7.4, 150 mM NaCl, 0.03% DDM/0.006% CHS, 10% glycerol, 100 uM TCEP, and 0.2 mg/ml 3xFlag peptide. For Salipro reconstitutions of both SMO-PGS and SMO-BRIL samples, membrane scaffold protein Saposin A was expressed and purified from Escherichia coli . Lipids mixture (55.2%POPC:36.8%POPG:8%cholesterol at mass ratio) was prepared as previously described 39 . Purified SMO protein in detergent (DDM/CHS) was mixed with Saposin A and lipids mixture using the malor ratio SMO:Saposin A:lipids = 1:3:47 and incubated on ice for 10-30 min. Detergents were removed by adding 2–3 batches of Bio-beads SM2 (Bio-Rad) with constant rotation overnight. The reconstituted receptors were cleared by moderate centrifugation via spin filter microtubes (Merck Millipore Ltd.) followed by size-exclusion chromatography using a Superdex 200 Increase 10/300 GL column (GE) equilibrated with buffer containing 20 mM HEPES-NaOH, pH 7.4, 150 mM NaCl, and 100 μM TCEP. The peak fractions corresponding to SMO in Salipro particles were pooled, concentrated to around 2.6 mg ml −1 using Amicon Ultra filter device (50 kDa MWCO, Millipore), and assessed by SDS-PAGE and negative-stain EM before cryo-EM grid preparation.
Expression and purification of A 2A R-BRIL
For expression, thermostabilized A 2A R-BRIL with an N-terminal HA signal sequence and FLAG epitope tag was cloned into a pcDNA™3.1/Zeo(+) vector containing a tetracycline-inducible expression cassette. This construct was transfected into inducible Expi293F cells (Thermo Fisher) using the ExpiFectamine transfection reagent per manufacturer instructions. For purification, cells were lysed with hypotonic buffer (20 mM HEPES pH 7.5, 1 mM EDTA) supplemented with protease inhibitors (20 μg/mL leupeptin, 160 μg/mL benzamidine). The membrane fraction was solubilized with 20 mM HEPES pH 7.5, 300 mM NaCI, 1% (w/v) lauryl maltose neopentyl glycol (L-MNG, Anatrace), 0.1% cholesteryl hemisuccinate (CHS, Steraloids), protease inhibitors, 5 mM ATP, 2 mM MgCl 2 , and 1 μM ZM241385 for 1 h at 4 °C. After high-speed centrifugation, the supernatant was affinity purified using M1 anti-FLAG antibody coupled to Sepharose beads. A 2A R-BRIL bound to M1-beads was washed to gradually decrease detergent and salt concentration and was eluted in 20 mM HEPES pH 7.5, 150 mM NaCI, 0.0075% (w/v) L-MNG, 0.0025% (w/v) glyco-diosgenin (GDN, Anatrace), 0.001% CHS, 1 μM ZM241385, 5 mM EDTA, and 0.2 mg/mL FLAG peptide (Genscript). Eluted A 2A R-BRIL was concentrated with a 50 kDa MWCO spin concentrator (Millipore) and purified to homogeneity with size-exclusion chromatography, using a Superdex S200 Increase 10/300 GL column (GE Healthcare) equilibrated in 20 mM HEPES pH 7.5, 150 mM NaCI, 0.0075% (w/v) L-MNG, 0.0025% (w/v) GDN, 0.001% CHS, and 1 μM ZM241385. Fractions containing monodisperse A 2A R-BRIL were pooled, mixed with 2× molar excess of BAG2 fab, and incubated overnight at 4 °C. The next day, the complex was concentrated with a 50 kDa MWCO spin concentrator, and excess fab was removed via size-exclusion chromatography, using a Superdex S200 Increase 10/300 GL column (GE Healthcare) equilibrated in 20 mM HEPES pH 7.5, 150 mM NaCI, 0.00075% (w/v) L-MNG, 0.00025% (w/v) GDN, 0.0001% CHS, and 1 μM ZM241385. The resulting A 2A R-BRIL BAG2 Fab complex was concentrated with a 50 kDa MWCO spin concentrator to 4.9 mg/mL for the preparation of cryo-EM grids.
Expression and purification of BAG2 Fab The BAG2
Fab in pRH2.2 vector was a gift from Kossiakoff lab 23 . This vector was transformed into BL21 Rosetta Escherichia coli cells and grown overnight in Luria Broth supplemented with 50 μg/mL kanamycin shaking at 225 rpm and 37 °C. The next day, the saturated overnight culture was used to inoculate 4 L of Terrific Broth (supplemented with 0.1% glucose, 2 mM MgCl 2 , and 50 μg/mL kanamycin), and cells were grown shaking at 225 rpm at 37 °C. When cells reached an OD600 = 0.6, expression was induced with the addition of 400 μM IPTG, and the temperature was reduced to 20 °C for 21 h. Cells were harvested by centrifugation and stored in the −80 °C until further use. For purification, cells were lysed by sonication in PBS, and the soluble fraction was heated in a 60 °C water bath for 30 min. After high-speed centrifugation, the supernatant was affinity purified using Protein A affinity resin (G-Biosciences) according to the manufacturer’s protocol. Eluted BAG2 Fab was concentrated with a 10 kDa MWCO spin and further purified with size-exclusion chromatography, using a Superdex S200 Increase 10/300 GL column equilibrated in 20 mM HEPES pH 7.5, 150 mM NaCI. Monodisperse fractions were concentrated and frozen for future use.
EM sample preparation and data acquisition
Regarding negative-stain EM, 2.5 μl of SMO samples at ~40 μg ml −1 were applied to a glow-discharged Cu grid covered by continuous carbon film, and then stained with 0.75% (w/v) uranyl formate 40 . A Tecnai T12 microscope (ThermoFisher FEI Company) operated at 120 kV was used to analyze these negatively stained grids. Images were recorded at a nominal magnification of 52,000× using an UltraScan 4000 camera (Gatan), corresponding to a pixel size of 2.21 Å on the specimen. To prepare cryo-EM grids of the reconstituted SMO, 3 μl of samples were applied onto a glow-discharged gold grid covered with holey carbon film (Quantifoil, 300 mesh 1.2/1.3) and blotted using a Vitrobot Mark IV (FEI Company) with 3-s blotting time and 100% humidity at 20 °C and plunge frozen in liquid ethane cooled by liquid nitrogen. Grids were imaged with a Titan Krios microscope (ThermoFisher FEI) operated at 300 keV, equipped with a Bio Quantum post-column energy filter with zero-loss energy selection slit set to 20 eV and a K3 camera (Gatan Inc), operating in super-resolution counting mode. Movie stacks were collected using SerialEM 41 . The detailed collecting parameters, including dose rate, total dose and total frames per movie stack, etc. are summarized in the Supplementary Table 1 . To prepare cryo-EM grids of the A 2A R-BRIL-BAG2 complex, 3 μL of samples at 4.9 mg/mL were added to 300 Mesh 1.2/1.3 R Au Quantifoil grids (glow discharged at 15 mA for 30 seconds with a Pelco easiGlow Glow discharge cleaning system). Grids were blotted with Whatman No. 1 qualitative filter paper in a Vitrobot Mark IV (Thermo Fisher) at 4 °C and 100% humidity for 3 second using a blot force of 1 prior to plunging into liquid ethane. Images of purified complex were acquired on Titan Krios I at the UCSF Cryo-EM Center for Structural Biology equipped with a BioQuantum K3 Imaging Filter (slit width 20 eV) and a K3 direct electron detector (Gatan) and operating at an acceleration voltage of 300 kV. Images were recorded at a defocus range of −1.0 to −2.0 μm with a nominal magnification of 105 K, resulting in a pixel size of 0.835 Å. Each image was dose-fractionated into 117 movie frames with a total exposure time of 5.9 s, resulting in a total dose of ~67 electrons per Å 2 . SerialEM was used for data collection.
Imaging processing
For the datasets of SMO in Salipro system, motion correction and dose weighting of movie stacks were performed on-the-fly using MotionCor2 42 . The contrast transfer function (CTF) was determined using Patch-Based CTF Estimation in cryoSPARC 43 . Particles were picked using a template selected from previous 2D averages followed by reference-free 2D classification (particles binned 4 × 4 during extraction) in cryoSPARC. After removing particles within junk classes, An ab initio 3D reference model was generated using cryoSPARC, which is used for the following 3D classification with a global mask (particles binned 4 × 4) in RELION-3. Particles with bad shape for the sample mSMO-PGS1 and without well-defined 7TM density for the sample mSMO-PGS2 were removed, respectively, and the remaining particles were re-extracted (particles binned 2 × 2) for another round of 3D classification in RELION-3. The particle projections from 2 out of 4 classes for the sample mSMO-PGS1 and 3 out of 8 classes for the sample mSMO-PGS2 were subjected to the 3D classification (Relion options:—tau2_fudge 20 –skip align) with a global or receptor-focused mask, respectively. The remaining particles in one class with well-defined receptor density were retained for 3D refinement in RELION-3. The reported resolution of the reconstruction map was further improved after refinement in RELION-3 using the particle stacks with Salipro disc subtraction. Directional Fourier Shell Correlation (dFSC) curves are calculated as described 44 . Apart from the resolution values reported by RELION, the nominal resolution is also estimated from the averaged FSC using FSC = 0.143 criterion 45 . Local resolution maps were calculated in RELION-3. Conversion of star files from cryoSPARC to RELION-3 was performed using UCSF pyem ( https://zenodo.org/record/3576630#.XuczyFVKjIU ). For the dataset of A 2A R-BRIL-BAG2 complex, a total of 2539 movie stacks were motion corrected and electron-dose weighted using MotionCor213. The CTF parameters were determined, and all subsequent 2D and 3D classifications were performed using cryoSPARC. The initial particle picking was performed by cryoSPARC blob picker. 278,828 particles were selected after several rounds of 2D classification from 1,636,914 particles. The following ab initio reconstruction, heterogeneous refinement, and nonuniform refinement enable us to reconstruct the 4 Å structure with 135,287 particles, from which we generated the template to auto-pick particles. With processing 2,788,578 particles, the map quality is significantly improved after heterogeneous refinement and nonuniform refinement, finally yielding the 3.7 Å map with 335,610 particles. To further improve the resolution, the final particle sets being used for nonuniform refinement from blob picker and template picker were combined after removing the duplicated particles, the following additional round heterogeneous refinement, RELION-based bayesian polishing, and cisTEM-based manual refinement were performed, yielding the 3.4 Å map with 215,946 particles. The cisTEM-based focused refinement enables the further improvement of map quality in terms of TMs region. The structure determination mainly rests on cryoSPARC, through which the features of Fab, BRIL, and 7TM domain are distinguishable even from the 2D classification result. Multiple rounds of heterogeneous refinement were performed to deal with the flexibility between A 2A R-BRIL and Fab. To further improve the map quality, RELION-based bayesian polishing and cisTEM-based manual refinement were performed to better determine particles’ Euler angles, Model building Atomic models of SMO (PDB ID: 6O3C), PGS (PDB ID: 5U09), and A 2A R-BRIL (PDB ID: 4EIY) were initially docked into the postprocessed density maps with UCSF Chimera 46 and manually adjusted in Coot 47 . All models were refined over multiple rounds using the module ‘phenix.real_space_refine’ 48 in PHENIX and ISOLDE 49 implemented in ChimeraX 50 . The quality of all refined models was assessed using the ‘comprehensive model validation’ function in PHENIX and wwPDB validation server 51 . UCSF Chimera and ChimeraX were used to make figures. Reporting summary Further information on research design is available in the Nature Research Reporting Summary linked to this article.
Supplementary information Supplementary Information Peer Review File Reporting Summary
📊 Figures
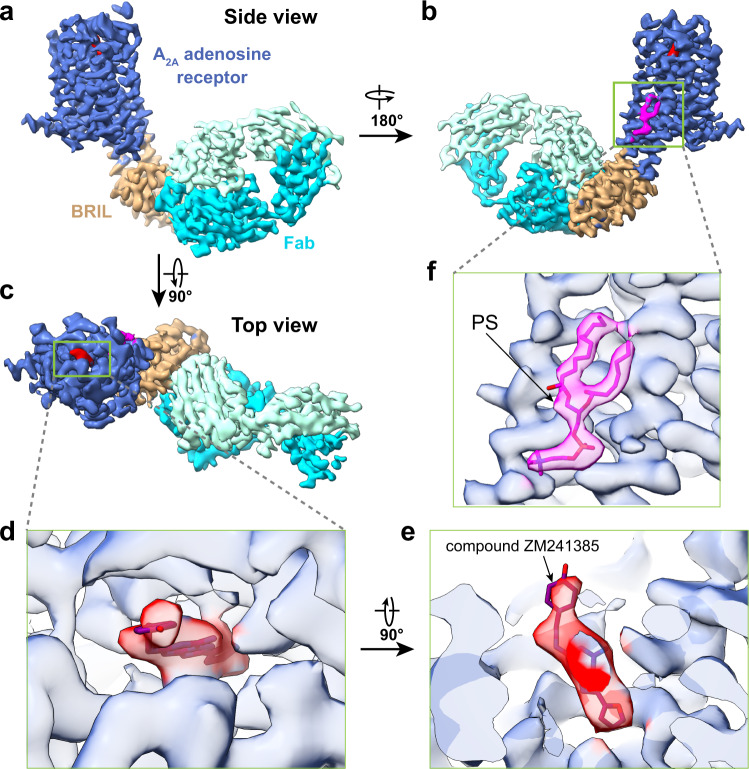
Fig. 1
Single-particle cryo-EM structure of A 2A R-BRIL.
a u2013 c Three different views of cryo-EM density map of A 2A R-BRIL bound with an anti-BRIL Fab. d , e Close-up views of compound ZM241385 in the binding pocket. f The location of lipid density high...
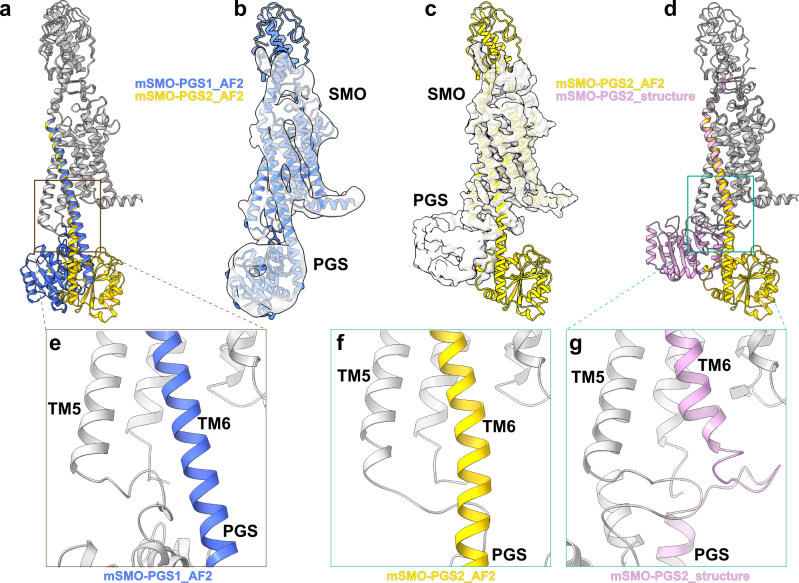
Fig. 2
Single-particle cryo-EM structures of mSMO-PGS.
a The atomic models of mSMO-PGS1 (blue) and mSMO-PGS2 (yellow) predicted by alphaFold2 (AF2). Note that the inserted PGS are predicted to be oriented in two opposite directions in these two constructs...
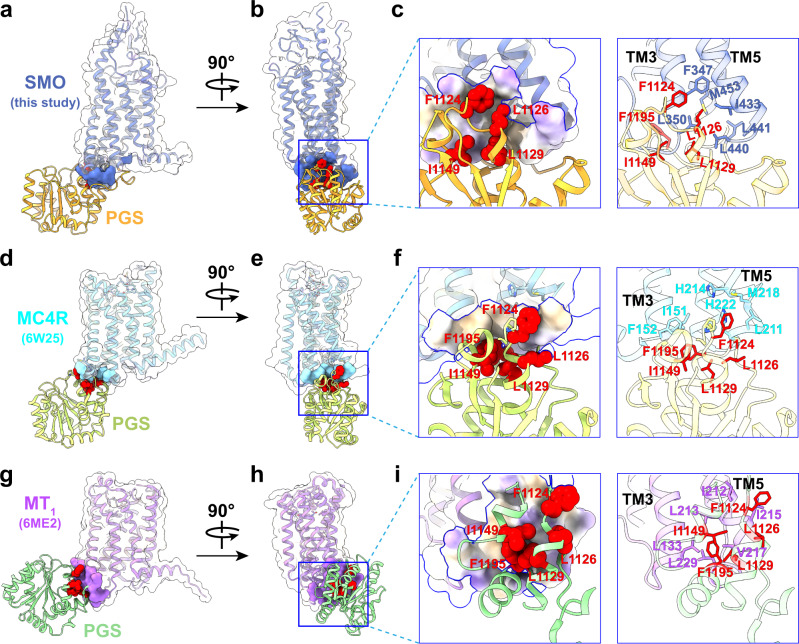
Fig. 3
Hydrophobic interfaces between SMO/MC4R/MT1 and the PGS fusion protein.
a, b Two different views of mSMO-PGS2 structure showing the relative orientation of the receptor and PGS. The contact area of SMO with PGS is indicated by blue surface. c An enlarged view of the hydro...
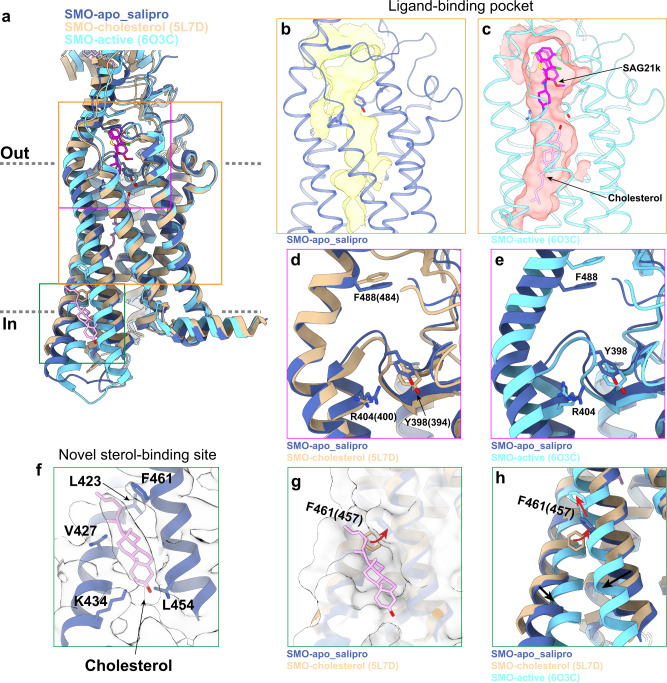
Fig. 4
Structure of mSMO in the apo state.
a Comparisons of structures of mSMO in apo state (this study) with antagonist-bound inactive (PDB ID: 5L7D) and agonist bound active (PDB ID: 6O3C) states. Three structures are color labeled. b The li...
Figure images are served from the NIH/NLM PubMed Central Open Access Subset or Europe PMC; copyright remains with the publishers and authors.
💬 Discussion
0 commentsNo comments yet. Be the first to start a discussion!
Leave a Comment