Abstract
Current light microscopic methods such as serial sectioning, confocal microscopy or multiphoton microscopy are severely limited in their ability to analyse rather opaque biological structures in three dimensions, while electron optical methods offer either a good three-dimensional topographic visualization (scanning electron microscopy) or high-resolution imaging of very thin samples (transmission electron microscopy). However, sample preparation commonly results in a significant alteration and the destruction of the three-dimensional integrity of the specimen. Depending on the selected photon energy, the interaction between X-rays and biological matter provides semi-transparency of the specimen, allowing penetration of even large specimens. Based on the projection-slice theorem, angular projections can be used for tomographic imaging. This method is well developed in medical and materials science for structure sizes down to several micrometres and is considered as being non-destructive. Achieving a spatial and structural resolution that is sufficient for the imaging of cells inside biological tissues is difficult due to several experimental conditions. A major problem that cannot be resolved with conventional X-ray sources are the low differences in density and absorption contrast of cells and the surrounding tissue. Therefore, X-ray monochromatization coupled with a sufficiently high photon flux and coherent beam properties are key requirements and currently only possible with synchrotron-produced X-rays. In this study, we report on the three-dimensional morphological characterization of articular cartilage using synchrotron-generated X-rays demonstrating the spatial distribution of single cells inside the tissue and their quantification, while comparing our findings to conventional histological techniques.
🔬 Techniques
🧬 Organisms
🧪 Sample Preparation
🔬 Cell Lines
🏭 Microscope Brands
📷 Detectors
🏛️ Research Organizations (ROR)
Affiliated research institutions:
📋 Methods
A cylindrical cartilage-bone plug was harvested from the joint of a 24-month-old cow and was immediately fixed, according to Lillie (1954) , in phosphate-buffered (pH 7.0) formaldehyde (3.5%) at 4°C for 24 hours. Afterwards, it was first rinsed in water for 2 hours and then decalcified at room temperature using EDTA, according to Romeis (1989) for 4 days and daily change of EDTA. After EDTA treatment, the sample was rinsed again in water for 2 hours. Dehydration was done using a series of graded ethanol (rinsing in 70, 80, 96 and twice in 100% for 4 hours each). Finally, the sample was rinsed twice in methyl benzoate for 20 min and sectioned into two halves, before embedding in paraffin. One half was used for histological characterization using light microscopy, while the other half was used for the SR-μCT analysis and SEM/FIB. 2.1. Histology and SEM The bovine tissue sample was sequentially sectioned into 20 slices of approximately 4 μm thickness followed by deparaffination and staining (haematoxylin and eosin, Leica ST 4040 autostainer). Additionally, two approximately 10 μm thick slices were prepared for manual staining with haematoxylin and eosin and Hale-PAS. Out of 20 slices, 17 slices were actually considered for the later computer-assisted three-dimensional tissue reconstruction, as strong sectioning artefacts were found on three slices. All slices were imaged with a Leica DMRM microscope at approximately the same image region with a 5× objective (Leica N Plan) using a Leica DFC 320 digital camera for image acquisition at a combined magnification of 50×. For each imaged slice, the same settings for brightness and contrast were used. Subsequently, the images were automatically aligned using I mage J ( Abramoff et al. 2004 ) and the S tack R eg plug-in ( Thévenaz et al. 1998 ) and were afterwards cropped, delivering a square-shaped region of interest featuring all structural details (calcified tissue, decalcified tissue by EDTA treatment and cartilage). The stack was further resampled in the direction of the z -axis with a resampling factor of four, to approximate the sectioning thickness (4 μm) to the xy -pixel size at 50× magnification (spatial resolution of 1.1 μm). After each slice, a spacing was included to indicate possible sectioning losses between two subsequent slices and missing volume information on account of the reduction to a single focal plane. The resulting image stack was rendered using VGS tudio MAX (Volume Graphics, Heidelberg, Germany) to yield a three-dimensional representation of the serial sections. SEM imaging in combination with FIB milling was performed after SR-μCT analysis using a Zeiss Cross Beam EsB 1540. The sample was previously gold sputter-coated in an argon atmosphere at 1.0×10 −2 mbar using a Balzers SCD050. Previous to SEM imaging, the region of interest was FIB milled using a gallium source ion beam to give a completely planar (on the nanometre scale) surface. 2.2.
Show full methods section
A cylindrical cartilage-bone plug was harvested from the joint of a 24-month-old cow and was immediately fixed, according to Lillie (1954) , in phosphate-buffered (pH 7.0) formaldehyde (3.5%) at 4°C for 24 hours. Afterwards, it was first rinsed in water for 2 hours and then decalcified at room temperature using EDTA, according to Romeis (1989) for 4 days and daily change of EDTA. After EDTA treatment, the sample was rinsed again in water for 2 hours. Dehydration was done using a series of graded ethanol (rinsing in 70, 80, 96 and twice in 100% for 4 hours each). Finally, the sample was rinsed twice in methyl benzoate for 20 min and sectioned into two halves, before embedding in paraffin. One half was used for histological characterization using light microscopy, while the other half was used for the SR-μCT analysis and SEM/FIB. 2.1. Histology and SEM The bovine tissue sample was sequentially sectioned into 20 slices of approximately 4 μm thickness followed by deparaffination and staining (haematoxylin and eosin, Leica ST 4040 autostainer). Additionally, two approximately 10 μm thick slices were prepared for manual staining with haematoxylin and eosin and Hale-PAS. Out of 20 slices, 17 slices were actually considered for the later computer-assisted three-dimensional tissue reconstruction, as strong sectioning artefacts were found on three slices. All slices were imaged with a Leica DMRM microscope at approximately the same image region with a 5× objective (Leica N Plan) using a Leica DFC 320 digital camera for image acquisition at a combined magnification of 50×. For each imaged slice, the same settings for brightness and contrast were used. Subsequently, the images were automatically aligned using I mage J ( Abramoff et al. 2004 ) and the S tack R eg plug-in ( Thévenaz et al. 1998 ) and were afterwards cropped, delivering a square-shaped region of interest featuring all structural details (calcified tissue, decalcified tissue by EDTA treatment and cartilage). The stack was further resampled in the direction of the z -axis with a resampling factor of four, to approximate the sectioning thickness (4 μm) to the xy -pixel size at 50× magnification (spatial resolution of 1.1 μm). After each slice, a spacing was included to indicate possible sectioning losses between two subsequent slices and missing volume information on account of the reduction to a single focal plane. The resulting image stack was rendered using VGS tudio MAX (Volume Graphics, Heidelberg, Germany) to yield a three-dimensional representation of the serial sections. SEM imaging in combination with FIB milling was performed after SR-μCT analysis using a Zeiss Cross Beam EsB 1540. The sample was previously gold sputter-coated in an argon atmosphere at 1.0×10 −2 mbar using a Balzers SCD050. Previous to SEM imaging, the region of interest was FIB milled using a gallium source ion beam to give a completely planar (on the nanometre scale) surface. 2.2.
Synchrotron X-ray imaging
The non-sectioned half of the specimen was deparaffinized in xylene until the sample was completely removed from the surrounding paraffin. This step was considered beneficial to increase contrast in both absorption and phase contrast imaging modes, exchanging the paraffin intermedium with air. Afterwards, the sample was stored in dry atmosphere using silica gel as a desiccant. Subsequently, SR-μCT measurements were performed at the BAMline (BAM, Federal Institute for Materials Research and Testing) at BESSY Berlin (Berlin electron storage ring company for synchrotron radiation). A detailed description of the BAMline set-up is available online ( Riesemeier et al. 2007 ). The monochromatic synchrotron radiation used in combination with a thin single CdWO 4 crystal as a scintillator, microscope optics and CCD camera (2048×2048 pixels) arranged behind, allowed for a spatial resolution of approximately 1.6 μm. The spatial resolution was determined geometrically in projection by displacing a known test object. Owing to the non-equivalence of projection data and reconstructed data, this methodology allows only for an approximation and is probably not as exact as a determination using an edge phantom and calculation of the modulation transfer function, as described, for example, by Müller et al. (2002) . 2.2.1. Phase contrast versus absorption contrast As pure absorption contrast was considered to be insufficient for the retrieval of structural details in the soft tissue part of the sample, a validation experiment for phase contrast versus absorption contrast was performed on a different cartilage specimen but from the same animal and joint, which was embedded in resin (poly(methyl methacrylate)), mounted on a polymer microscope slide and polished down to approximately 20 μm. This specimen was exposed to the synchrotron generated X-rays at different stage positions and two different X-ray energies according to figure 2 . Figure 2 Influence of the beam energy and the distance between the scintillator and the sample resulting in the attenuation of phase contrast or absorption contrast and the impact on the visual detail. Non-decalcified histological cartilage sample embedded in epoxy resin mounted on a polymer microscope slide. Sample to scintillator distances greater than 2 cm increase the visual detail. The higher beam energy of ( b ) 15 keV compared with ( a ) 10 keV slightly increases the visual detail. Owing to the low thickness of the specimen, experiments were only performed in projection mode, recording a single magnified image of the sample. 2.2.2. Qualitative and quantitative SR-μCT The sample was positioned 15 cm away from the scintillator screen to permit both phase contrast and absorption contrast as detailed above. The region of interest recorded by the CCD camera was set to 2048×1500 pixels allowing for a maximum sample width of 3.3 mm. The sample was rotated in steps of 180°/1200 and was exposed to the beam at 14 keV for an exposure time of 2.0 s. Both dark-field (removal of camera-specific artefacts) and flat-field corrections (removal of beam-related artefacts) were applied to limit formation of ring artefacts during reconstruction. Persistent ring artefacts were compensated later via sinogram correction according to Boin & Haibel (2006) . Reconstruction of the obtained projected images was performed using filtered back projection as described by Basu & Bresler (2000) . The data were acquired in a camera-specific 16-bit RAW format, which was tone mapped to 8 bits while preserving a high contrast between all relevant tissue structures. These data were saved as a multi-image TIFF stack. The reduced data amount enabled processing on an Apple iMac Core 2 Duo (2.3 GHz, 3.3 Gbyte RAM). Two-dimensional sliced and three-dimensional rendered data were obtained using the software O siri X v. 3.0 ( http://www.osirix-viewer.com ) and VG Studio MAX v. 1.2.1 (Volume Graphics). To further enhance the cellular distribution and to more easily distinguish between soft and calcified tissues, the histogram grey-scale values were remapped corresponding to figure 3 . The depicted 16-bit colour lookup table (CLUT: pink, soft tissue; light yellow, calcified hard tissue; and white, chondrocytes/lacunae) and the applied opacity values were chosen to be visually similar to the haematoxylin and eosin-stained serial sections. An intensity minimum (black colour) was set at a grey value of 90 separating the large peak at grey value 85, while also applying an opacity minimum, resulting in high translucency of the soft tissue parts but visually preserving the cell lacunae. Figure 3 ( a ) Rendered SR-μCT data corresponding to ( b ) the applied histogram CLUT/opacity level indicating relevant structures and ( c ) rendered histological data from serial sectioning (see the electronic supplementary material, movie). The representation of a single chondrocyte inside its lacunae was achieved by digitally magnifying (10 times) and median filtering (8 pixel radius) of the cropped TIFF stack in each axial direction using I mage J. The filtered data were rendered using O siri X applying a CLUT, which was adapted to the slightly different grey-scale histogram. The volume of a single lacuna with its chondrocyte was demonstrated using the I mage J ‘three-dimensional object counter’ plug-in ( Müller et al. 2002 ) on the thresholded (binarized) data. Quantification of the cell density was performed on the basis of the volume estimation of the single cell in its lacunae, as described above and following the steps outlined in table 1 . Briefly, a cuboid region of interest was chosen, showing only the soft tissue cartilage near the surface. The grey-scale data were median filtered to remove most of the persistent artefacts. Binarization by thresholding delivered the lacunae. The threshold value of 78 was chosen to be at half of the left-hand side of the histogram peak (grey value 85), as shown in figure 3 . The data were again median filtered to remove thresholding artefacts. Using the three-dimensional object counter plug-in ( Bolte & Cordelières 2006 ) on the data delivered the total amount of lacunae and therefore the amount of cells inside the volume. The resulting histogram represents the acquired particle volumes (for objects larger than 750 μm 3 , which is half the peak volume of 1500 μm 3 , and considerably less than the calculated volume for a single cell in its lacunae of 1805 μm 3 , as depicted in figure 4 d ). Furthermore, circularity and orientation of the cell lacunae was analysed. Briefly, fit ellipses and circularity were calculated for each lacuna in the image stack using I mage J and its ‘analyse particles’ function. For each fit ellipse, the orientation angle and the circularity (values of 1.0 represent a circle, while a value of 0.0 indicates an elongated polygon) were recorded and plotted against each other as the density plot. The exact determination of circularity in I mage J is according to the formula: circularity=4 π (area/perimeter 2 ). Table 1 Processing steps in I mage J for cell density quantification. step visual example (sliced data) method and parameters (I mage J) description 1 region of interest 500×500×250 (voxel) 800×800×400 (μm 3 ) a cuboid region featuring only the cartilaginous part of the entire dataset was chosen 2 remove outliers radius: 16 pixel threshold: 50 median filter replacing a pixel by the median of pixels in the vicinity if it deviates from the median by more than the threshold value 3 threshold threshold: 78 image binarization by setting grey values to black and white corresponding to the threshold value 4 despeckle program default median filter replacing each pixel with the median value in its 3×3 vicinity 5 three-dimensional object counter threshold: 128 slice: 100 I mage J plug-in; Bolte & Cordelières (2006) voxel size: 750−62.5×10 6 Figure 4 Demonstration of cellular details in the soft tissue region of articular cartilage. ( a ) Original sliced data, ( b ) 10× digitally magnified (median-filtered) region of a lacuna doublet with their chondrocytes in the centres, ( c ) correspondence with SEM/FIB and ( d ) rendering of the 10× magnified data and volume estimation for the frontal lacuna (three-dimensional reconstruction).
📊 Figures
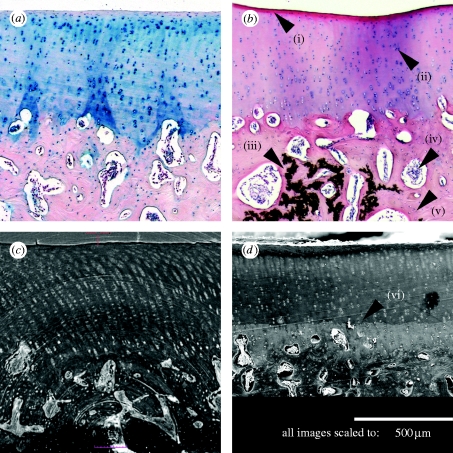
Figure 1
Comparison of stained histological slices with SEM and SR-u03bcCT of the same sample at the same magnification (scale bar, 500u2005u03bcm). ( a ) Histology, Hale-PAS stained; ( b ) histology, haematox...
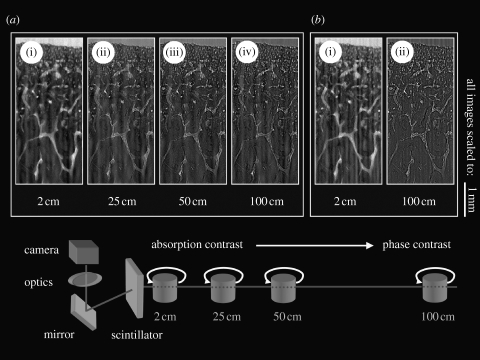
Figure 2
Influence of the beam energy and the distance between the scintillator and the sample resulting in the attenuation of phase contrast or absorption contrast and the impact on the visual detail. Non-dec...
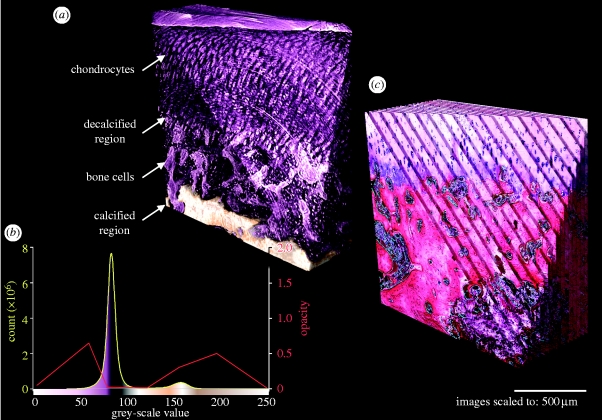
Figure 3
( a ) Rendered SR-u03bcCT data corresponding to ( b ) the applied histogram CLUT/opacity level indicating relevant structures and ( c ) rendered histological data from serial sectioning (see the elect...
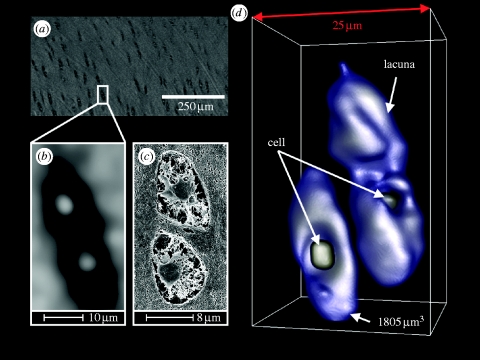
Figure 4
Demonstration of cellular details in the soft tissue region of articular cartilage. ( a ) Original sliced data, ( b ) 10u00d7 digitally magnified (median-filtered) region of a lacuna doublet with thei...
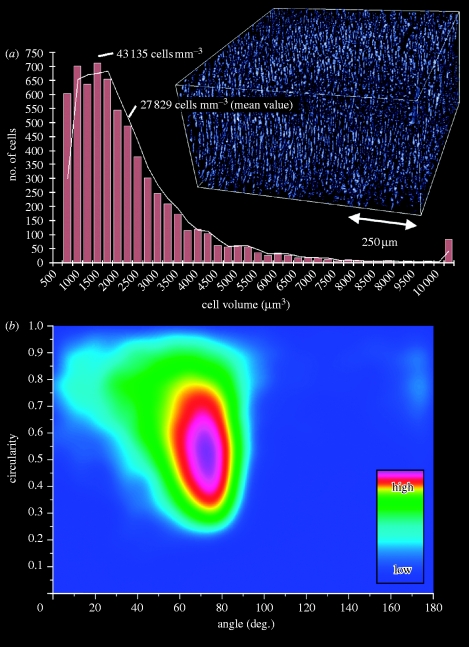
Figure 5
( a ) Quantification of the cell density in a 0.256u2005mm 3 volume of the soft tissue region of articular cartilage. ( b ) Density plot of the lacunae circularity against the orientation (cell number...
Figure images are served from the NIH/NLM PubMed Central Open Access Subset or Europe PMC; copyright remains with the publishers and authors.
💬 Discussion
0 commentsNo comments yet. Be the first to start a discussion!
Leave a Comment