Abstract
Microtubule-based transport by the kinesin motors, powered by ATP hydrolysis, is essential for a wide range of vital processes in eukaryotes. We obtained insight into this process by developing atomic models for no-nucleotide and ATP states of the monomeric kinesin motor domain on microtubules from cryo-EM reconstructions at 5-6 Å resolution. By comparing these models with existing X-ray structures of ADP-bound kinesin, we infer a mechanistic scheme in which microtubule attachment, mediated by a universally conserved 'linchpin' residue in kinesin (N255), triggers a clamshell opening of the nucleotide cleft and accompanying release of ADP. Binding of ATP re-closes the cleft in a manner that tightly couples to translocation of cargo, via kinesin's 'neck linker' element. These structural transitions are reminiscent of the analogous nucleotide-exchange steps in the myosin and F1-ATPase motors and inform how the two heads of a kinesin dimer 'gate' each other to promote coordinated stepping along microtubules.
🔬 Techniques
🔭 Microscopes
💻 Software
✨ Fluorophores
🧪 Sample Preparation
🏭 Microscope Brands
🧪 Reagent Suppliers
📷 Detectors
💻 Software Details
📋 Protocols
💾 Data Repositories
🏛️ Research Organizations (ROR)
Affiliated research institutions:
📋 Methods
Protein expression and purification
The wild-type, monomeric human K349 construct was bacterially expressed and purified as described ( Kull et al., 1996 ), and 15% (wt/vol) sucrose was added before snap freezing in liquid nitrogen and storing at −80°C. A plasmid for the mutant N255K construct was generated from the wild-type plasmid using the QuikChange site-directed mutagenesis kit (Agilent Technologies; Santa Clara, CA). Thawed K349 (either wild-type or N255K) was exchanged into EM buffer (25 mM PIPES, 25 mM KCl, 1 mM EGTA, 1 mM DTT) using three rounds of dilution and concentration in a Microcon ultracentrifugal filter (EMD Millipore; Billerica, MA). Microtubule batches were grown from 250 µg of lyophilized bovine brain tubulin (Cytoskeleton; Denver, CO), resuspended in 25 µl EM buffer and clarified (Beckman TLA 120.2, 100K RPM, 4°C) prior to incubation at 37°C. Taxol (2 mM in DMSO) was added to equimolar levels with tubulin after 10 min of incubation. Following ∼45 min of polymerization, microtubules were brought to room temperature and a ∼twofold excess of K349 was added prior to pelleting through a glycerol cushion (50 µl of EM buffer + 60% glycerol wt/vol + 200 µM taxol) in order to remove unbound motor and unpolymerized tubulin (20 min, Beckman TLA 120.2, 50K RPM, 24°C). The motor–microtubule complex was resuspended in ∼10 µl of EM buffer plus 200 µM taxol.
Mant-ADP release measurements
Stopped-flow measurements were performed at 298 K using an SF-300X (Indiana University) stopped-flow apparatus (KinTek Corp.; Austin, TX) equipped with a Xenon arc lamp (Hamamatsu; Japan). Kinetics of the interaction of mant-ADP with kinesin was measured by equilibrating a kinesin·mant-ADP (1:1) complex followed by rapid mixing with a high concentration of MgATP or varying MT concentrations plus MgATP to chase the mant-ADP from the active site as described ( Sadhu and Taylor, 1992 ). Mant fluorescence was monitored over time, I ex,max = 356 nm, I em,max = 448 nm (400 nm long-pass filter).
Show full methods section
Protein expression and purification
The wild-type, monomeric human K349 construct was bacterially expressed and purified as described ( Kull et al., 1996 ), and 15% (wt/vol) sucrose was added before snap freezing in liquid nitrogen and storing at −80°C. A plasmid for the mutant N255K construct was generated from the wild-type plasmid using the QuikChange site-directed mutagenesis kit (Agilent Technologies; Santa Clara, CA). Thawed K349 (either wild-type or N255K) was exchanged into EM buffer (25 mM PIPES, 25 mM KCl, 1 mM EGTA, 1 mM DTT) using three rounds of dilution and concentration in a Microcon ultracentrifugal filter (EMD Millipore; Billerica, MA). Microtubule batches were grown from 250 µg of lyophilized bovine brain tubulin (Cytoskeleton; Denver, CO), resuspended in 25 µl EM buffer and clarified (Beckman TLA 120.2, 100K RPM, 4°C) prior to incubation at 37°C. Taxol (2 mM in DMSO) was added to equimolar levels with tubulin after 10 min of incubation. Following ∼45 min of polymerization, microtubules were brought to room temperature and a ∼twofold excess of K349 was added prior to pelleting through a glycerol cushion (50 µl of EM buffer + 60% glycerol wt/vol + 200 µM taxol) in order to remove unbound motor and unpolymerized tubulin (20 min, Beckman TLA 120.2, 50K RPM, 24°C). The motor–microtubule complex was resuspended in ∼10 µl of EM buffer plus 200 µM taxol.
Mant-ADP release measurements
Stopped-flow measurements were performed at 298 K using an SF-300X (Indiana University) stopped-flow apparatus (KinTek Corp.; Austin, TX) equipped with a Xenon arc lamp (Hamamatsu; Japan). Kinetics of the interaction of mant-ADP with kinesin was measured by equilibrating a kinesin·mant-ADP (1:1) complex followed by rapid mixing with a high concentration of MgATP or varying MT concentrations plus MgATP to chase the mant-ADP from the active site as described ( Sadhu and Taylor, 1992 ). Mant fluorescence was monitored over time, I ex,max = 356 nm, I em,max = 448 nm (400 nm long-pass filter).
Cryo-EM sample preparation
Samples were plunge-frozen in liquid ethane, using Quantifoil holey carbon grids with 1 µm hole diameter, 1.5 µm spacing (Quantifoil Micro Tools GmbH; Germany). In order to optimize motor decoration on the microtubules, glow discharge was not applied to the grids and samples were diluted ∼5–10× into distilled water (0.35 µl sample plus 3 µl d(H 2 O)) on a piece of Parafilm prior to grid application, in order to compensate for evaporation that occurs prior to contact with liquid ethane ( Sindelar and Downing, 2007 ). For the ADP, AMPPNP, and ADP•Al•F x conditions, the grid droplet mixture was supplemented by 2 mM nucleotide (2 mM ATP + 2 mM AlCl 3 + 10 mM NaF for the latter condition). Following our previously published protocol ( Sindelar and Downing, 2007 ), most of the initially applied buffer on the grids was wicked away by touching the grid edgewise with a piece of filter paper (Whatman). The grids were then blotted completely, and after a 0.5–1 s delay, immersed into liquid ethane using a home-built plunge-freezing apparatus. Consistent with our prior experience ( Sindelar and Downing, 2007 ), failure to dilute the sample buffer ∼5–10× prior to plunge freezing led to poor and/or inconsistent kinesin decoration of the microtubules.
Data collection and image processing
Micrographs of the microtubules decorated by the wild-type K349 construct were collected using the SerialEM package to collect data semi-automatically on 300 kV FEG-equipped electron microscopes (FEI F30 for the no-nucleotide data set, FEI Titan for the ADP•Al•Fx data set), using K2 direct electron detecting cameras (Gatan; Pleasanton, CA) in video mode. For bare microtubules, and microtubules decorated by the N255K construct, micrographs were collected using a TF-20 FEG-equipped instrument and a Gatan US4000 CCD detector. In all cases, the defocus was systematically varied from approximately 1 to 2.5 µM through the course of the data collection. The total dose was ∼15 electrons/Angstrom squared, distributed over 15 or 16 video frames. The no-nucleotide data set was collected at ∼13K magnification using the camera's super-resolution mode and subsequently binned 2×, yielding 4K by 4K image dimensions with an effective pixel size of 1.99 Å. The ADP•Al•Fx data set was collected at approximately the same magnification as the no-nucleotide data set but in regular counting mode, resulting in 4K by 4K images with an effective pixel size of 2.097 Å. After performing drift analysis ( Li et al., 2013 ), whole-image video frames were aligned and averaged (K2 data only) before manually selecting overlapping boxed segments corresponding to individual microtubules. Defocuses and astigmatism parameters were estimated using the CTFFIND3 program ( Mindell and Grigorieff, 2003 ). Single-particle analysis and 3D reconstruction was then performed as described ( Sindelar and Downing, 2010 ), with some modifications. Initial reference models were generated by applying a parametric model of the microtubule ( Chrétien and Wade, 1991 ) to PDB models of the no-nucleotide kinesin-microtubule complex ( Sindelar and Downing, 2007 ), converting the atomic coordinates to EM density using the SPIDER package ( Frank et al., 1996 ), and applying a low-pass filter with a 20 Å cutoff frequency. Multi-reference analysis performed using a range of different microtubule assemblies (12–15 protofilaments) established that 14-protofilament microtubules outnumbered 13-protofilament by approximately 3:1, with only marginal populations of other symmetry forms. Based on this determination, the 13- and 14-protofilament sub-populations were separately selected for further analysis. Initial estimates of the in-plane rotation of individual segments were made using the Radon transform, as described ( Li et al., 2002 ). Automated scripts using the SPIDER package ( Frank et al., 1996 ) were used for semi-exhaustive searching of XY shifts and Euler angles (out-of-plane tilt range: +/−15°). Reference alignment was used to determine the position of the microtubule seam on a per-microtubule basis as described ( Sindelar and Downing, 2007 ), as was the filament polarity, and then every segment was subjected to local refinement using the established seam orientation and polarity. Evidently due to disorder in the N255K kinesin head orientations, the correlation scores used to identify the seam orientation were far noisier for this mutant. Following initial refinement of the Euler angles and shifts for each box, the estimated position of each 8 nm repeat of the microtubule was mapped back onto the micrograph and a new stack of boxes was extracted for a final round of SPIDER refinement. Thus, the final data set included exactly one box for each 8 nm repeat identified in the selected microtubules. Subsequent structure refinement and 3D reconstruction was performed using the FREALIGN package ( Grigorieff, 2007 ) with specific modifications for helical image processing ( Alushin et al., 2010 ). For the FREALIGN refinements, four rounds of refinement and reconstruction were initially performed, using successively higher resolution cutoffs for the refinement target (20 Å, 15 Å, 12 Å, 10 Å). For each reconstruction, 13- or 14-fold pseudo-helical symmetry was applied in order to transform all imaged asymmetric subunits onto a single ‘good’ protofilament, as previously described ( Sindelar and Downing, 2007 ). Helical parameters were derived from the corresponding, canonical microtubule form ( Chrétien and Wade, 1991 ) but adapted for the measured axial repeat distance in our data sets. The reconstructed ‘good’ protofilament (along with the remainder of the reconstruction) was subsequently replicated and transformed 13 or 14 times using the same symmetry parameters in order to generate protofilament models for the entire microtubule. The transformed ‘good’ protofilaments were subsequently selected by complementary wedge-shaped masks and summed in order to obtain the final asymmetric microtubule model. To reduce the influence of solvent noise in the refinement, a tight mask around the protein density was generated from a thresholded low-resolution version of the current map, and then smoothed with a soft Gaussian filter (∼10 Å half-width). This mask was then applied to the reconstructed volume prior to the next round of refinement. The same mask was employed for FSC calculations. Once the FREALIGN steps were completed, the resulting 3D map was then filtered to 20 Å and fed back into the SPIDER/FREALIGN pipeline, in order to reduce errors related to seam identification, polarity, and local searches. This additional step was omitted from the refinement of the N255K mutants. Following the second cycle of SPIDER/FREALIGN analysis, FSC calculations indicated that the resolution of the wild-type reconstructions was approximately 6 Å (0.143 criterion; Figure 1—figure supplement 1A,B ), and no signs of higher-resolution features were apparent. We then subdivided the aligned video frames corresponding to each micrograph into summed groups of three (5 frames each), and re-extracted a new FREALIGN image stack from these sub-frames, resulting in a threefold larger number of stacked images. We then performed four more rounds of FREALIGN analysis with the new stack, using Euler angles and shifts determined previously as starting parameters. The resulting reconstructions resolved individual beta strands and alpha helical pitch in some portions of the map ( Figure 1—figure supplement 1F,G ), although as noted in the main text the kinesin density was more poorly resolved and there was evidence of anisotropic blurring in the tubulin density (results not shown). The final resolution, obtained through FSC comparison of reconstructed half-data set volumes after applying a soft mask, was ∼5 Å (0.143 criterion) for both nucleotide states ( Figure 1—figure supplement 1A,B ). For the final no-nucleotide reconstruction, a total of 10,029 8 nm repeats were used, for a total of ∼140000 asymmetric units (14 protofilaments). A total of 2394 8 nm repeats, for a total of ∼33,600 asymmetric units, were used for the final ADP•Al•F x reconstruction (14 protofilaments). Molecular dynamics flexible fitting calculations In order to derive an atomic model for the microtubule complex of ATP-bound kinesin, we subjected the coordinates of tubulin and kinesin from the 4HNA structure to a hybrid all-atom molecular dynamics method (MDFF) in which cryo-EM density contributes a force field term (steering potential) designed to guide the simulation toward the experimentally observed structure ( Trabuco et al., 2008 ). Version 1.91 of NAMD was used for all molecular dynamics calculations ( Phillips et al., 2005 ). We used an explicit solvation model (TIP3P), because conformational instabilities were observed in trial simulations that used a less expensive continuum solvent model. All simulations were run using periodic boundary conditions, but no attempt was made to model the longitudinal or lateral interfaces of tubulin. While this omission likely produced artifacts near the boundaries between the simulated tubulin heterodimer and neighboring tubulin subunits, these boundaries are remote from the motor–microtubule interface. Moreover, the EM steering potential used in these simulations conformation strongly clamps the conformation of tubulin. Thus, our simulation setup is expected to minimize or eliminate the propagation of any boundary artifacts toward kinesin and its interface with tubulin, which is the focus of the current study. To complete the starting model, twenty water molecules were manually placed within the kinesin nucleotide pocket at sites corresponding to crystallographic waters identified in a high-resolution (1.7 Å) X-ray structure of KIF4 kinesin co-complexed with AMPPNP ( Chang et al., 2013 ). Hydrogen atoms were added to protein atoms and crystallographic water molecules using the ‘guesscoord’ command from the NAMD package ( Phillips et al., 2005 ). The system was then placed in a TIP3P water box of dimensions 125 × 125 × 95 Å, and sodium and chloride ions were randomly added to this water box to a concentration of 50 μM, at a ratio that neutralized the charge of the system. After energy minimization (600 steps), the system was subjected to a three-phase equilibration, in which protein atoms were initially subjected to positional restraints that were then progressively released. The equilibration simulations were performed in the NPT ensemble, using a Nosé–Hoover Langevin piston with a target pressure of 1 atm, a decay period of 200 fs and a time constant of 100 fs. The temperature was maintained at 310 K using a Langevin temperature bath with a time constant of 5 ps −1 . In the first equilibration phase, which ran for 50 ps, all protein and ligand atoms were restrained by a 20 kcal/mol/Å harmonic potential; the second equilibration step restrained protein backbone atoms only and the nucleotide ribose rings (50 ps); and the final step removed all harmonic constraints and was run for 600 ps. For all simulations, the CHARMM27 force field was used, with long-distance electrostatic interactions computed by the particle-mesh Ewald method and a non-bonded cutoff distance of 10 Å. Force field terms for GDP and GTP were adapted from ADP and ATP, respectively. Following equilibration, we performed MDFF simulations, but with substantial modifications in order to reduce the possibility of overfitting, which has been shown to be a significant concern with this method ( Bai et al., 2013 ). Importantly, we limited the influence of the EM steering potential to include only protein backbone atoms and nucleotide ligands. Thus, side chain atoms in our MDFF simulations are subjected exclusively to physics-based force field terms, which is reasonable because side chains were not visualized in our maps. Related to this point, as noted in the main text, a low-pass filter was used to remove signal beyond 6 Å resolution in the cryo-EM map, in order to reduce the level of contaminating noise prior to generating the EM steering potential. Limiting the EM steering potential to backbone atoms tends to moderate the contribution of the EM term in the simulated energy function, thus compensating for the limited number of experimental constraints available from our cryo-EM maps. Convergence of the fitted structures within the MDFF trajectories In conventional applications of MDFF, the EM steering potential is introduced as a step function after an initial equilibration period, and the relative strength of the potential (compared with the physics-based terms in the molecular dynamics force field) is described by an adjustable parameter, ξ, whose magnitude must be empirically determined. If the value of ξ is too low, it will not force a conformational transition within an achievable amount of simulation time; on the other hand, if the value is too high the molecular conformation becomes distorted (‘overfitting’). However, a quantitative method for choosing an appropriate value for the ξ parameter has not been presented. To address this problem, we developed a modified MDFF protocol in which the value of ξ follows a linear ramp function, starting at zero and slowly increasing over the course of 10 nanoseconds. We then monitored the system for convergence by calculating the root mean squared deviation between the coordinates of the fitted structure and the starting model ( Figure 2—figure supplement 1 ). The resulting simulation trajectory exhibits a rapid conformational transition that occurs within the first 2 nanoseconds of the simulation, corresponding to relatively low values of the GSCALE parameter (GSCALE
📊 Figures
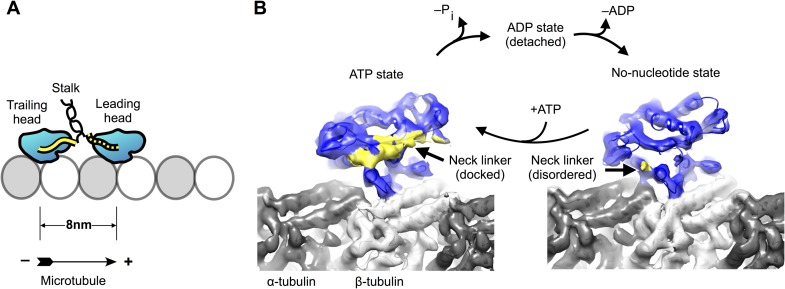
Figure 1.
Kinesin-microtubule complex at 5u20136 u00c5 resolution.
( A ) Schematic of a stepping kinesin dimer on a microtubulenprotofilament. ( B ) Cross-sections of the reconstructednco-complexes of no-nucleotide kinesin (left) andnADPu2022Alu2022F x (right) with t...
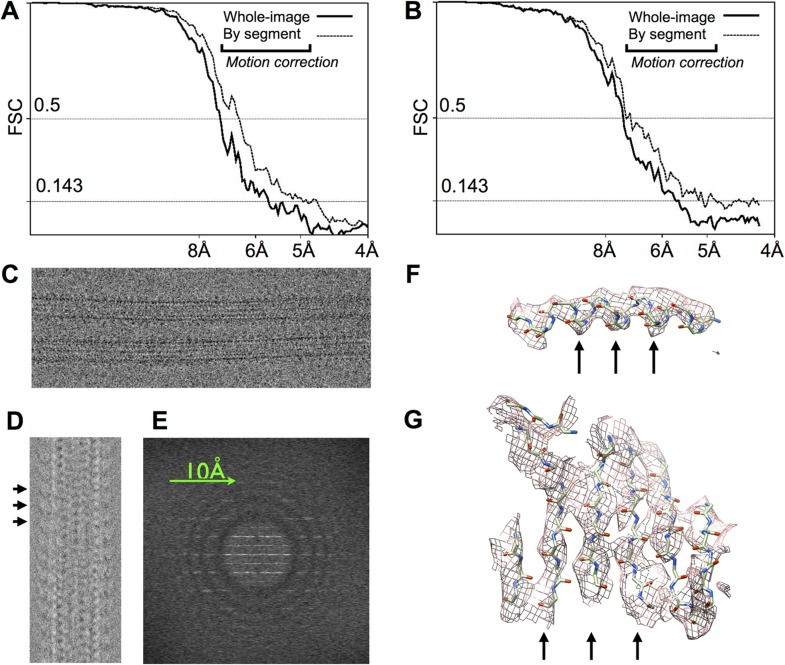
Figure 1u2014figure supplement 1.
Statistics and diagnostic images related to image processing and 3D reconstruction of the kinesin-microtubule complex.
( A ), ( B ) FSC curves for our 3D reconstructions ofnmicrotubules decorated by no-nucleotide and ADPu2022Alu2022Fx boundnkinesin (respectively). These show signal nearly to the Nyquist frequency,ndro...
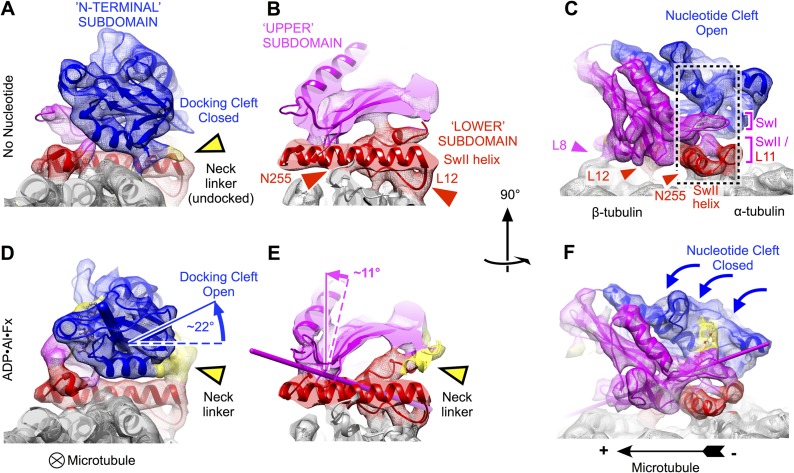
Figure 2.
Clamshell-like closure of kinesin's nucleotide cleft triggered by ATP binding on microtubules, as revealed by cryo-EM density maps of no-nucleotide kinesin (top panels) and the ADPu2022Alu2022F x state (bottom panels).
Nucleotide cleft closure is coupled, via rotation of the N-terminalnsubdomain, to opening of a u2018docking cleftu2019 on the oppositenside of the motor domain and accompanying docking of the neck lin...
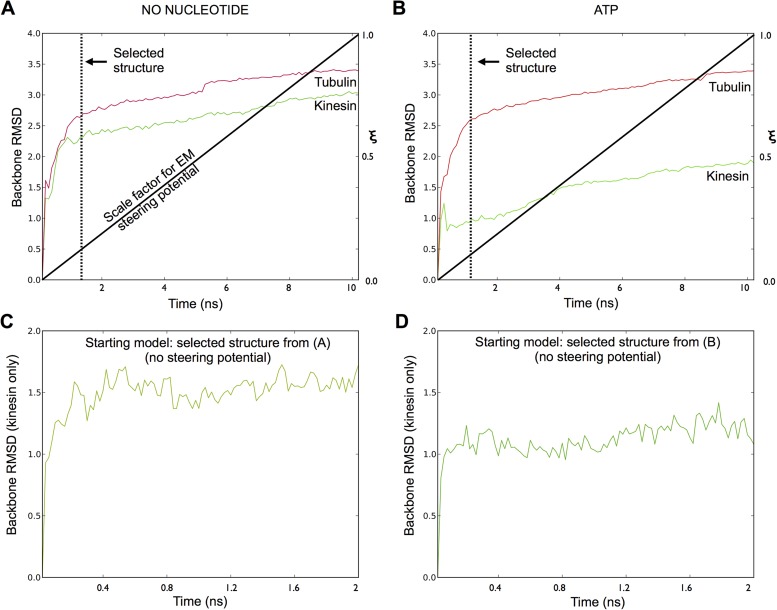
Figure 2u2014figure supplement 1.
Assessing the convergence of the MDFF simulations.
( A u2013 B ), Backbone RMSD values as anfunction of time, measured separately for tubulin and kinesin against thenstarting model, for MDFF simulations of the no-nucleotide and ATP statesnof kinesin (...
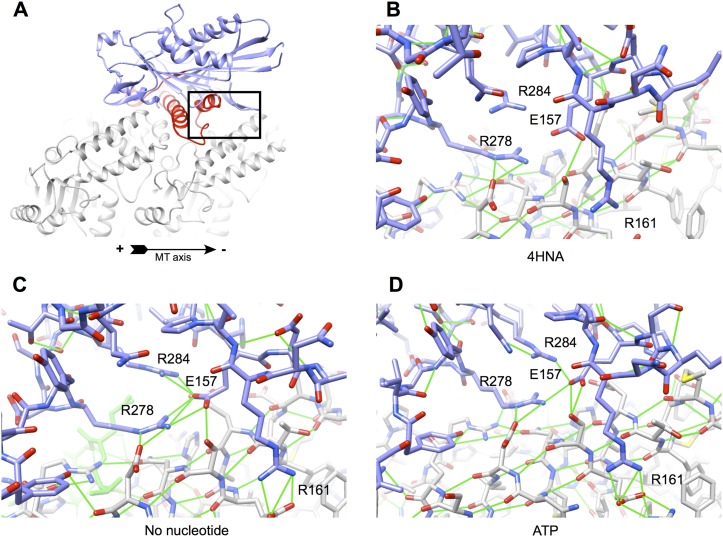
Figure 2u2014figure supplement 2.
Improved interactions at the kinesin-tubulin interface following initial equilibration of the 4HNA starting model (see u2018Materials and methodsu2019).
( A ) Overview of the kinesin-microtubule complex,nhighlighting the region selected for the close-ups in panelsn( B )u2013( D ). Four charged residues fromnkinesin's microtubule binding regions are la...
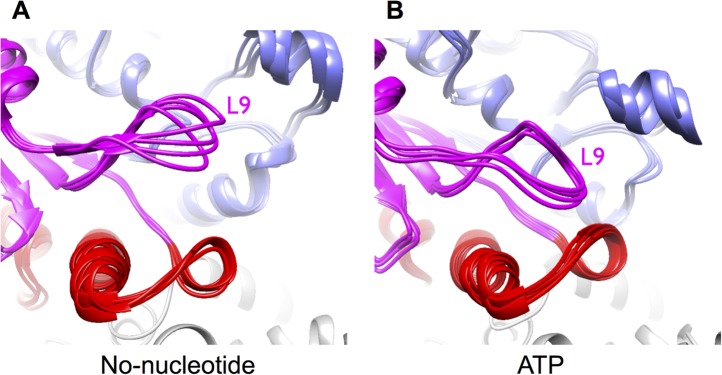
Figure 2u2014figure supplement 3.
Mobility of loop L9 (corresponding to the switch I loop) increases in simulations of unrestrained, no-nucleotide kinesin bound to microtubules, compared with simulations of the ATP state.
These loop motions account for differences in cryo-EM density featuresnfor this loop seen in Figure 2C,F .nThese simulations were restarted from the endpoint of the correspondingnMDFF simulations, but...
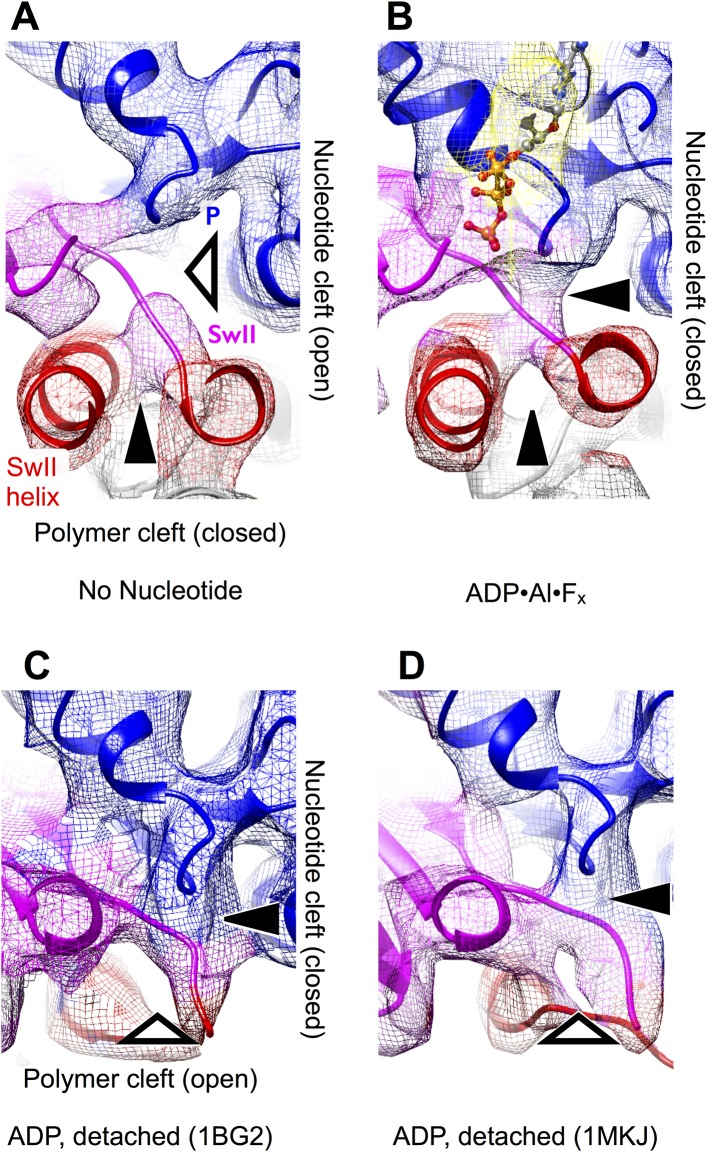
Figure 3.
The effect of nucleotide state and microtubule attachment on kinesinu2019s u2018nucleotideu2019 and u2018polymeru2019 clefts.
Shown is an enlarged, cutaway view of the active site (rectangular regionnindicated in Figure 2C,F ). Densitynfeatures that define the nucleotide cleft, corresponding to the switch IInloop and the P-l...
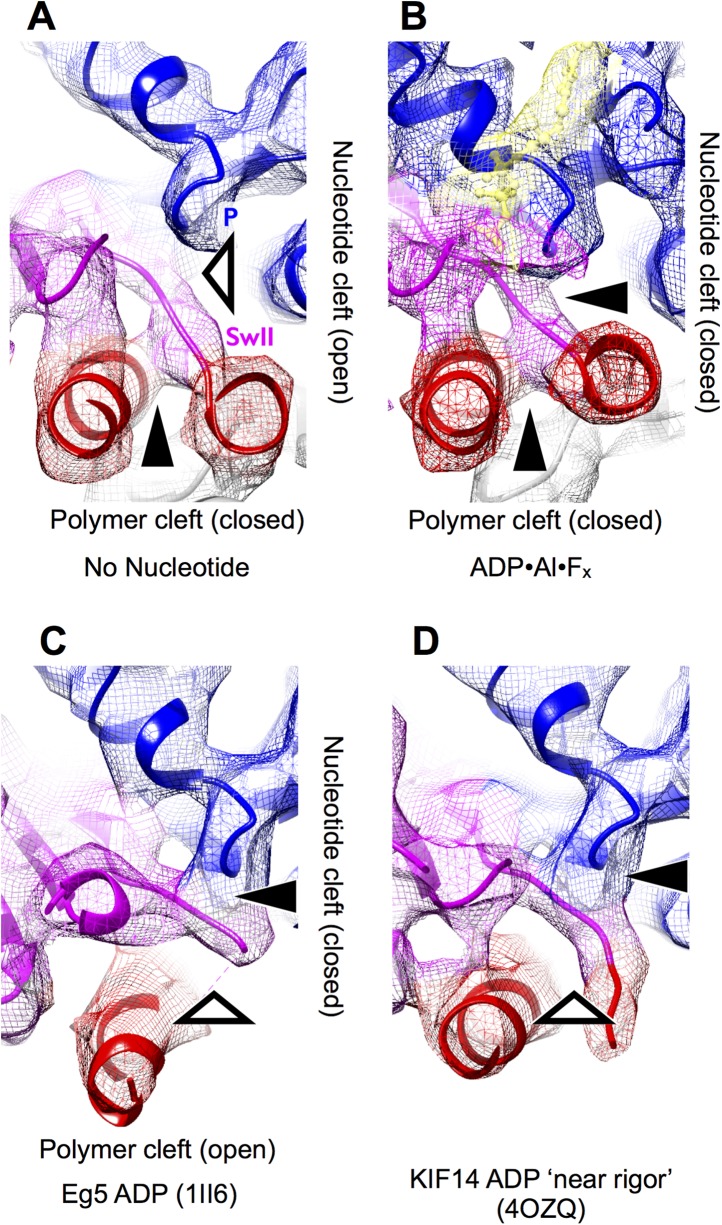
Figure 3u2014figure supplement 1.
Visualizing nucleotide and polymer clefts in synthetically rendered maps of kinesin at 6 u00c5 resolution.
The view is the same as in Figuren3 . Panels ( A u2013 B ) were generatednfrom the final atomic models for these maps generated by our MDFFnsimulation protocol, while panels ( C u2013 D )nwere rendere...
Video 1.
Animation depicting the conformational transition observed in our MDFF simulation of the ATP bound kinesinu2013microtubule complex.
A ribbon diagram of the molecular structure is superimposed on ansemitransparent isosurface of the EM density map, filtered to 6 u00c5nresolution. The video runs from the beginning of the MDFF simulat...
Video 2.
Animation depicting our MDFF simulation for no-nucleotide kinesin, up to t = 1.4 ns.
DOI: http://dx.doi.org/10.7554/eLife.04686.012
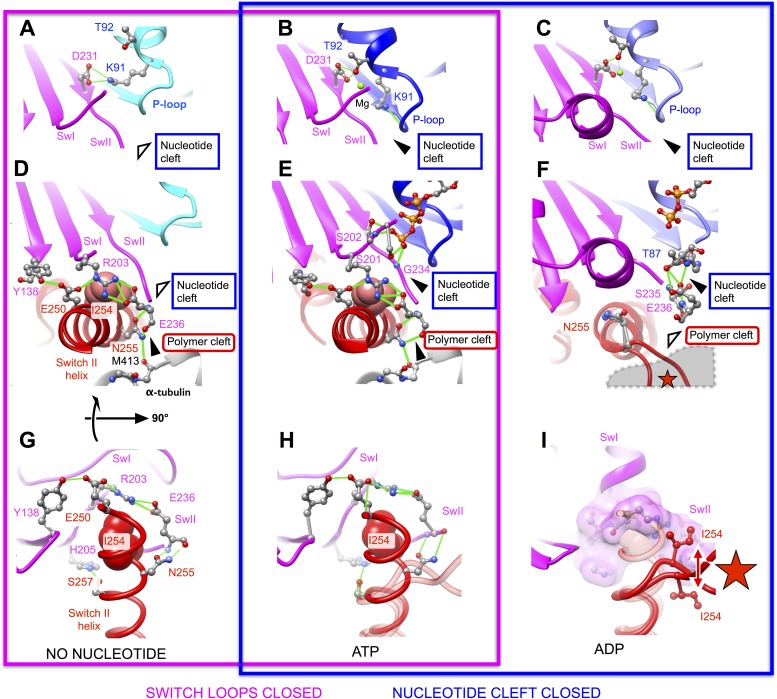
Figure 4.
Atomic models capturing open and closed states of kinesin's nucleotide and polymer clefts for principle structural intermediates in the kinesin cycle.
No-nucleotide and ATP-bound models of the kinesin-microtubule complexn(this work) are depicted in panels A , D , G and B , E , H (respectively). A pair ofnX-ray crystal structures of the ADP-bound kin...
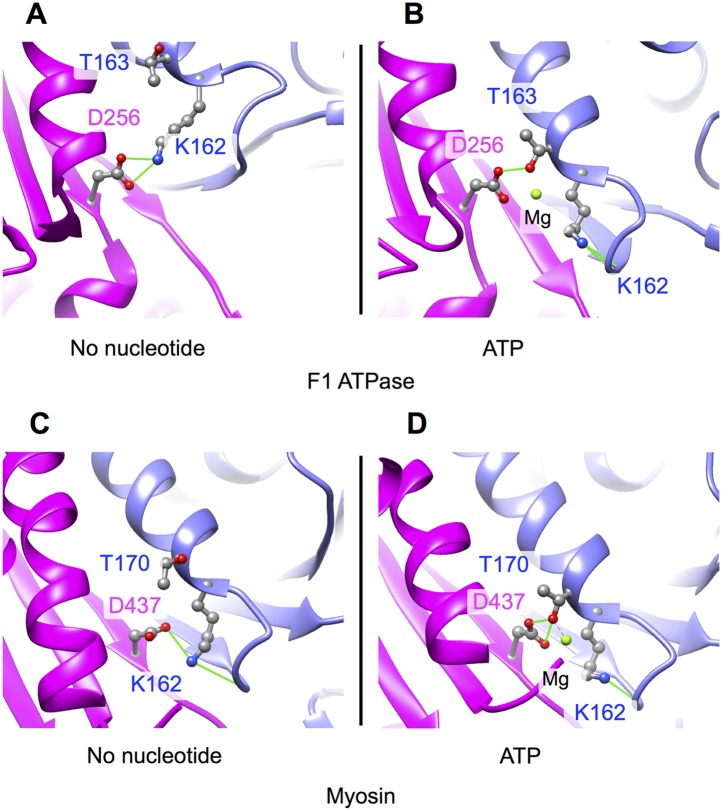
Figure 4u2014figure supplement 1.
Nucleotide cleft closure induced by ATP analogs in the myosin and F 1 -ATPase motor proteins (compare with Figure 4Au2013C ).
Changes in the hydrogen-bonding pattern between P-loop and switch IInresidues between in these motors closely match the changes predicted bynour molecular dynamics models of kinesin's no-nucleotide an...
Video 3.
Alternative depiction of the transition presented in Video 2 , detailing the side chains and hydrogen bonds that compose the closed switch loop network (Y138, R203, E236, E250, N255), as well as residues P-loop residues K91, T92, and their interacting partner D231 from the switch II loop (compare with Figure 3 ).
Hydrogen bonds formed at the beginning and endpoints of the simulation arendepicted with green lines. Note that in this video the position andnorientation of the outer surface of tubulin (helices H11-...
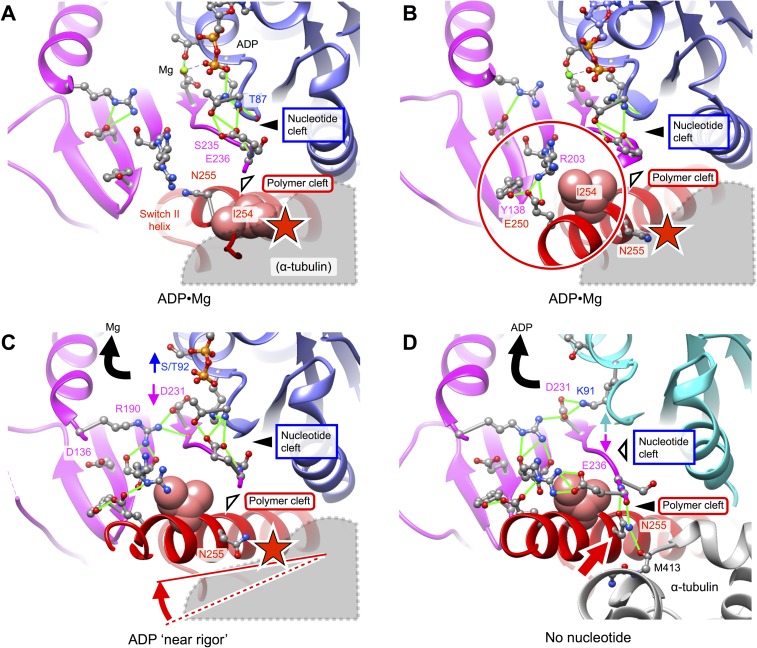
Figure 5.
Putative intermediate states that lead to opening of kinesinu2019s nucleotide cleft, accompanied by ADP release, upon microtubule attachment.
( A ) X-ray structure of Mgu2022ADP-bound K349 kinesin (PDB IDn1BG2). ( B ) X-ray structure of Mgu2022ADP-bound KIF1A kinesinn(PDB ID: 1I5S). ( C ) X-ray structure of u2018nearnrigoru2019, ADP-bound K...
Video 4.
Comparison of beta-sheet twist in our no-nucleotide model (cyan) and five representative X-ray structures of ADP-bound kinesin (pale magenta/pale blue).
Structures in this and all subsequent videos are aligned by residuesn226u2013231 of our kinesin model, as in Figure 6A . The video cycles sequentially through the ADPnstructures in order of increasing...
Video 5.
Similar to Video 4 , but substituting our no-nucleotide model with the X-ray structure of u2018rigor-likeu2019 kinesin, in green (PDB ID: 4OZQ).
DOI: http://dx.doi.org/10.7554/eLife.04686.018
Video 6.
Morphing animation illustrating minimal beta-sheet distortion in a comparison of ADP-bound structures of KIF1A (PDB ID:1I5S) and u2018rigor-likeu2019 KIF14 (lacking magnesium; PDB ID:4OZQ).
The starting structure is that of KIF14. The hydrogen bond network betweennresidues T87 and E236 (K349 numbering), which defines a closed state of thennucleotide cleft, is depicted and the involved si...
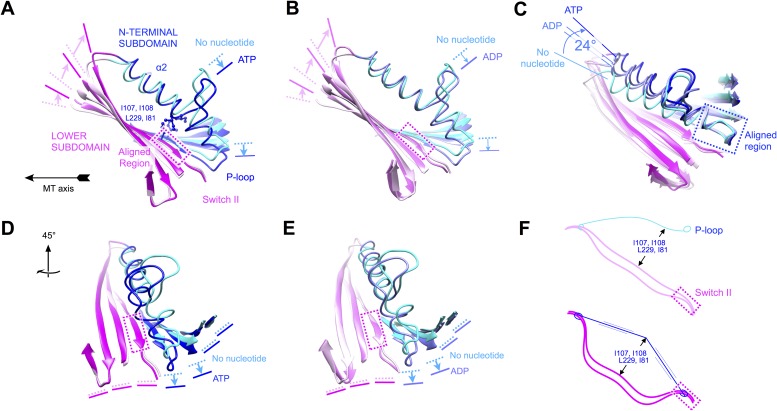
Figure 6.
Evidence that nucleotide binding introduces internal strain in kinesin's central beta sheet and helix alpha 2, mediated by interactions between the P-loop and the switch II loop.
Similar comparisons of additional structural states of kinesin are shownnin Figure 6u2014figure supplementn1 and Videos 4u20138 .n( A ) Flexing of the beta sheet coupled with motion ofnalpha 2 in comp...
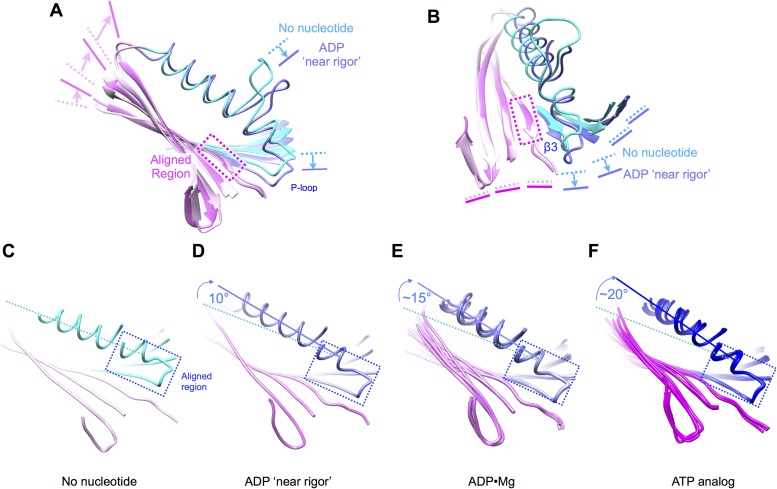
Figure 6u2014figure supplement 1.
Relationship between nucleotide state and strain in the polypeptide backbone for a diverse array of kinesin X-ray structures.
( A ), ( B ) Comparison between our no-nucleotidenK349 structure and a u2018rigor-likeu2019 (ADP-bound) conformationnof KIF14 (PDB ID: 4OZQ). Compare with Figure 6A,B,D,E . ( C u2013 F )nComparison of...
Video 7.
Comparison of backbone distortions in the central beta sheet and u03b12 for our no-nucleotide and ATP-bound models of K349 kinesin, illustrated by a morphing animation.
Compare with Figure 6A,D . DOI: http://dx.doi.org/10.7554/eLife.04686.022
Video 8.
Similar to Video 7 , but substituting the X-ray structure of ADP-bound kinesin (PDB ID: 1MKJ) for the ATP-bound model.
Compare with Figure 6B,E . DOI: http://dx.doi.org/10.7554/eLife.04686.023
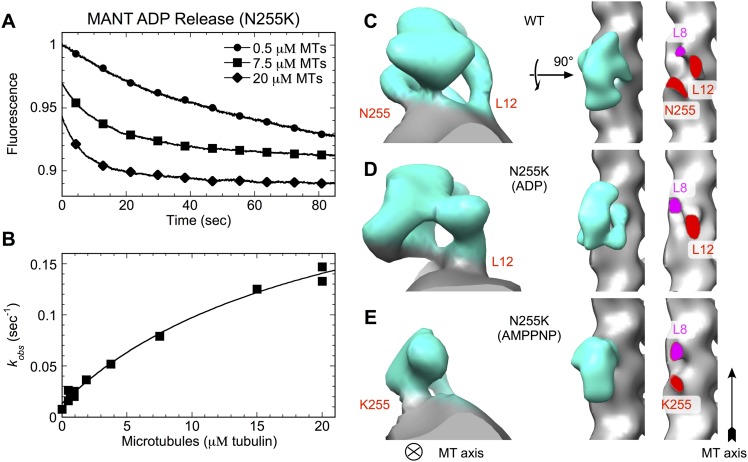
Figure 7.
N255K uncoupling mutation compromises the microtubule interface, with accompanying orientational disorder of the motor domain.
( A ), ( B ) Microtubule-stimulated ADP releasenkinetics measurements for the N255K mutant of our K349 construct. Shownnin ( A ) are individual time traces, while ( B )nplots the fitted rate constants...
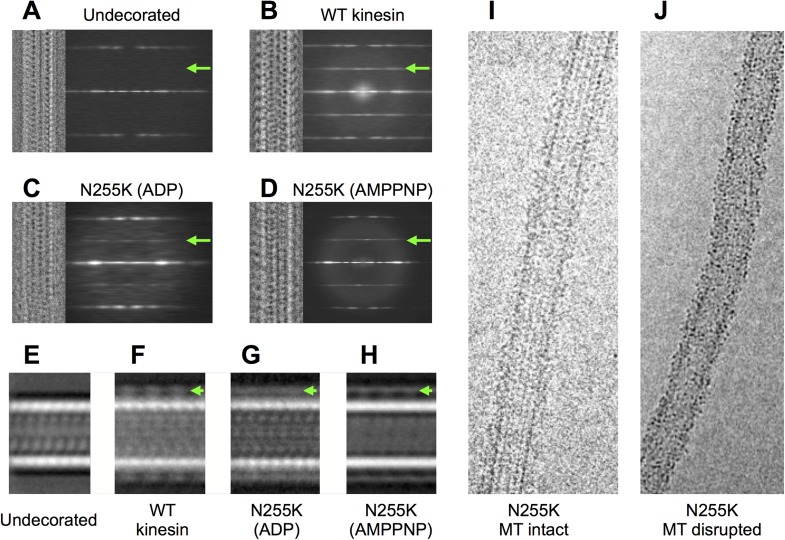
Figure 7u2014figure supplement 1.
Analysis of cryo-EM images of N255K kinesin complexed with microtubules (see Figure 7 ).
( A u2013 D ) Compressed alignments (similar to Figure 1u2014figure supplementn1D ) of representative single microtubules under variousndecoration conditions. A summation of the power spectra for ever...
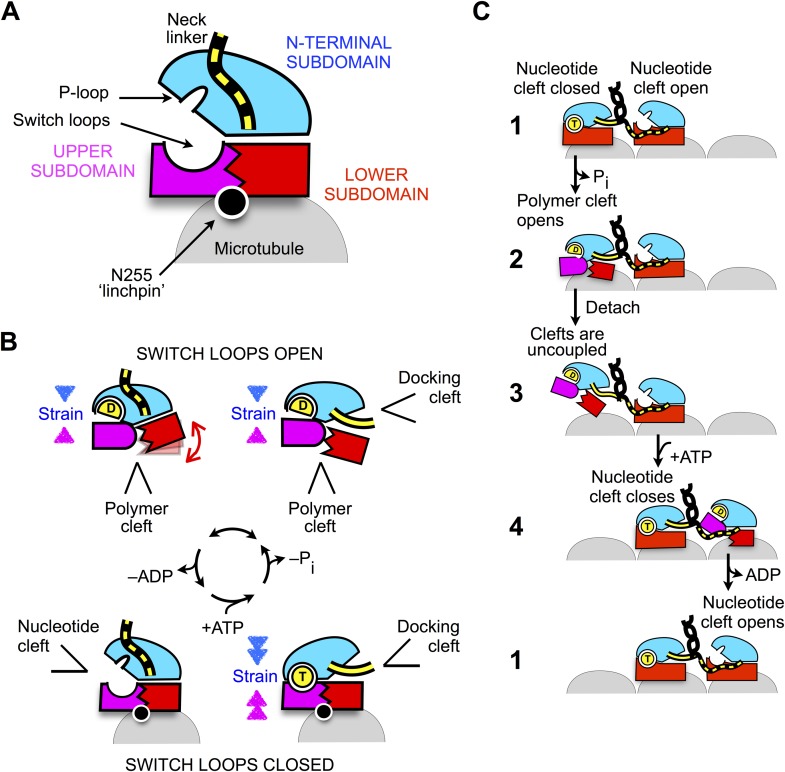
Figure 8.
Schematic of proposed mechanisms of monomeric and dimeric conventional kinesin.
( A ) Abstracted cartoon that depicts kinesin's three principalnsubdomains and other key structural elements, including thenu2018linchpinu2019 residue N255 (circle) and the neck linker (disorderednsta...
Figure images are served from the NIH/NLM PubMed Central Open Access Subset or Europe PMC; copyright remains with the publishers and authors.
💬 Discussion
0 commentsNo comments yet. Be the first to start a discussion!
Leave a Comment