Abstract
Synaptic terminals grow and retract throughout life, yet synaptic strength is maintained within stable physiological ranges. To study this process, we investigated Drosophila endophilin (endo) mutants. Although active zone (AZ) number is doubled in endo mutants, a compensatory reduction in their size homeostatically adjusts global neurotransmitter output to maintain synaptic strength. We find an inverse adaptation in rab3 mutants. Additional analyses using confocal, STED, and electron microscopy reveal a stoichiometric tuning of AZ scaffolds and nanoarchitecture. Axonal transport of synaptic cargo via the lysosomal kinesin adapter Arl8 regulates AZ abundance to modulate global synaptic output and sustain the homeostatic potentiation of neurotransmission. Finally, we find that this AZ scaling can interface with two independent homeostats, depression and potentiation, to remodel AZ structure and function, demonstrating a robust balancing of separate homeostatic adaptations. Thus, AZs are pliable substrates with elastic and modular nanostructures that can be dynamically sculpted to stabilize and tune both local and global synaptic strength.
🔬 Techniques
🔭 Microscopes
🧬 Organisms
💻 Software
✨ Fluorophores
🧪 Sample Preparation
🏭 Microscope Brands
🧪 Reagent Suppliers
📷 Detectors
💻 Software Details
🏛️ Research Organizations (ROR)
Affiliated research institutions:
📋 Methods
Fly stocks
Drosophila stocks were raised at 25°C on standard molasses food. The w 1118 strain was used as the wild-type control unless otherwise noted, as this is the genetic background of the transgenic lines and other genotypes used in this study. The following fly stocks were used: endo 1 and endo Δ4 ( Verstreken et al., 2002 ), GluRIIA sp16 ( Petersen et al., 1997 ), OK371-Gal4 ( Mahr and Aberle, 2006 ), OK6-Gal4 ( Aberle et al., 2002 ), UAS-vGlut ( Daniels et al., 2004 ), rab3 rup ( Graf et al., 2009 ), Cac sfGFP-N ( Gratz et al., 2019 ), and UAS-arl8-GFP and arl8 e00336 ( Vukoja et al., 2018 ). All other Drosophila stocks were obtained from the Bloomington Drosophila Stock Center (BDSC): elav c155 -Gal4 (BDSC #458), endo RNAi (BDSC #27679), rab3 RNAi (BDSC #31691), BRP-GFP (BDSC #59292), and vGlut-GFP (BDSC #59411). Details of all stocks and their source are listed in Table S2.
Immunocytochemistry
Third-instar larvae were dissected in ice-cold 0 Ca 2+ HL-3 and fixed in Bouin’s fixative for 5 min, 100% ice-cold methanol for 5 min, or 4% PFA for 10 min as described previously ( Böhme et al., 2016 ; Perry et al., 2017 ). Briefly, larvae were washed with PBS containing 0.1% Triton X-100 (PBST) for 30 min, blocked with 5% normal donkey serum followed by overnight incubation in primary antibodies at 4°C, three washes in PBST, incubation in secondary antibodies for 2 h, three final washes in PBST, and equilibration in 70% glycerol in PBST. Samples were mounted in VectaShield (Vector Laboratories) or ProLong Gold Antifade Reagent (Cell Signaling Technology) for Confocal and STED imaging, respectively. The following antibodies were used: mouse anti-BRP (nc82; 1:100; Developmental Studies Hybridoma Bank [DSHB]), mouse anti-Synapsin, (3C11; 1:10; DSHB), rabbit anti-SYT1 (1:2,500; Mackler et al., 2002 ), guinea pig anti-vGlut (1:1,000; Chen et al., 2017 ), guinea pig anti-Unc13A (1:500; Böhme et al., 2016 ), and affinity-purified rabbit anti-GluRIII (1:2,000; Marrus and DiAntonio, 2004 ). For confocal imaging, donkey anti-mouse, anti-guinea pig, and anti-rabbit Alexa Fluor 488–, Cyanine 3–, and Alexa Fluor 647–conjugated goat anti-HRP and DyLight 405–conjugated secondary antibodies were used at 1:400 (Jackson ImmunoResearch). For STED imaging, BRP and Unc13A primary antibodies were used and goat anti-guinea pig star635 (1:100; 1–0101002; Abberior) and goat anti-mouse Alexa Fluor 594 (1:500; A11032; Thermo Fisher Scientific) were used for secondary antibodies. Details of all antibodies used, including their source and catalog numbers, are listed in Table S2.
Show full methods section
Fly stocks
Drosophila stocks were raised at 25°C on standard molasses food. The w 1118 strain was used as the wild-type control unless otherwise noted, as this is the genetic background of the transgenic lines and other genotypes used in this study. The following fly stocks were used: endo 1 and endo Δ4 ( Verstreken et al., 2002 ), GluRIIA sp16 ( Petersen et al., 1997 ), OK371-Gal4 ( Mahr and Aberle, 2006 ), OK6-Gal4 ( Aberle et al., 2002 ), UAS-vGlut ( Daniels et al., 2004 ), rab3 rup ( Graf et al., 2009 ), Cac sfGFP-N ( Gratz et al., 2019 ), and UAS-arl8-GFP and arl8 e00336 ( Vukoja et al., 2018 ). All other Drosophila stocks were obtained from the Bloomington Drosophila Stock Center (BDSC): elav c155 -Gal4 (BDSC #458), endo RNAi (BDSC #27679), rab3 RNAi (BDSC #31691), BRP-GFP (BDSC #59292), and vGlut-GFP (BDSC #59411). Details of all stocks and their source are listed in Table S2.
Immunocytochemistry
Third-instar larvae were dissected in ice-cold 0 Ca 2+ HL-3 and fixed in Bouin’s fixative for 5 min, 100% ice-cold methanol for 5 min, or 4% PFA for 10 min as described previously ( Böhme et al., 2016 ; Perry et al., 2017 ). Briefly, larvae were washed with PBS containing 0.1% Triton X-100 (PBST) for 30 min, blocked with 5% normal donkey serum followed by overnight incubation in primary antibodies at 4°C, three washes in PBST, incubation in secondary antibodies for 2 h, three final washes in PBST, and equilibration in 70% glycerol in PBST. Samples were mounted in VectaShield (Vector Laboratories) or ProLong Gold Antifade Reagent (Cell Signaling Technology) for Confocal and STED imaging, respectively. The following antibodies were used: mouse anti-BRP (nc82; 1:100; Developmental Studies Hybridoma Bank [DSHB]), mouse anti-Synapsin, (3C11; 1:10; DSHB), rabbit anti-SYT1 (1:2,500; Mackler et al., 2002 ), guinea pig anti-vGlut (1:1,000; Chen et al., 2017 ), guinea pig anti-Unc13A (1:500; Böhme et al., 2016 ), and affinity-purified rabbit anti-GluRIII (1:2,000; Marrus and DiAntonio, 2004 ). For confocal imaging, donkey anti-mouse, anti-guinea pig, and anti-rabbit Alexa Fluor 488–, Cyanine 3–, and Alexa Fluor 647–conjugated goat anti-HRP and DyLight 405–conjugated secondary antibodies were used at 1:400 (Jackson ImmunoResearch). For STED imaging, BRP and Unc13A primary antibodies were used and goat anti-guinea pig star635 (1:100; 1–0101002; Abberior) and goat anti-mouse Alexa Fluor 594 (1:500; A11032; Thermo Fisher Scientific) were used for secondary antibodies. Details of all antibodies used, including their source and catalog numbers, are listed in Table S2.
Confocal imaging and analysis
Samples were imaged double blind with respect to researcher and genotype using a Nikon A1R Resonant Scanning Confocal microscope equipped with NIS Elements software and a 100× APO 1.4-NA oil-immersion objective using separate channels with four laser lines (405, 488, 561, and 637 nm) at room temperature. Boutons were counted using vGlut and HRP-stained NMJ terminals on muscle 6/7 and muscle 4 of segment A3, considering each vGlut puncta to be a bouton. For fluorescence quantifications of SV markers and AZ proteins, all genotypes within a dataset were immunostained in the same tube with identical reagents and then mounted and imaged in the same session. Z-stacks were obtained using identical settings for all genotypes with z axis spacing between 0.15 and 0.2 µm within an experiment and optimized for detection without saturation of the signal. Maximum intensity projections were used for quantitative image analysis with the NIS Elements software General Analysis toolkit. Synapse surface area was calculated by creating a mask around the HRP channel that labels the neuronal membrane. To quantify mean puncta intensity, fluorescence intensity thresholds and filters were applied to the relevant channel, and the mean puncta intensity was calculated as the total fluorescence intensity signal of the puncta divided by the area of the puncta. To quantify sum puncta intensity, the total fluorescence intensity signal of the individual puncta was calculated without regard to area. For each particular sample set, thresholds were optimized to capture the dynamic range of intensity levels in the wild-type sample. This threshold was then used to image all other genotypes in the same sample set, and all intensities were normalized to wild-type values within an experimental set. AZs too closely spaced to be resolved (∼2.5% of all analyzed) were excluded from the analysis. Finally, to quantify total intensity per NMJ, the sum fluorescence intensity for each individual puncta was summed across the entire NMJ for all puncta. For immunostaining experiments following PhTx application, preparations were treated as described for electrophysiological experiments, fixed with 100% ethanol for 5 min, and stained as above. Similar enhancements in BRP puncta intensity after PhTx application were observed after fixation using Bouin’s fixative, 4% PFA, or 100% methanol (Table S1). To validate the quantification for BRP, Unc13A, or Cac puncta area in wild type, endo , and rab3 , we performed full width at half maximum analysis for images of individual puncta using NIS Elements software. This measurement determines the apparent width of the individual puncta where intensity is 50% of the maximum value. The value given by full width at half maximum thus provides an internal validation of relative puncta size. While this apparent puncta area may not precisely match the values obtained through other approaches (e.g., STED and EM), relative changes are internally consistent.
Live imaging and analysis
Live imaging of BRP-GFP and vGlut-GFP before and after PhTx application was performed on a Nikon A1R Resonant Scanning Confocal microscope equipped with NIS Elements software and a 60× APO 1.0-NA water-immersion objective using the 488 laser line at room temperature. Third-instar larvae were minimally dissected in Ca 2+ -free HL3, with one side of the body wall gently pinned to avoid stretching. Before PhTx treatment, Z-stacks of NMJ 6/7 were acquired using the resonant scanner with 6× scan zoom. Preparations were then exposed to 40 µM PhTx. Because segmental nerves were left intact, experiments were performed in Ca 2+ -free HL3 to minimize muscle contractions and movement during imaging, a condition that does not impact PHP signaling ( Goel et al., 2017 ). Immediately following 10-min PhTx treatment, NMJs were reimaged using the same parameters. To measure intensity at individual BRP and vGlut puncta, Z-stacks were flattened using the maximum intensity Z-projection function and background subtracted using the same threshold values before and after PhTx treatment. A local contrast function was used to aid in BRP puncta recognition and masking. For each BRP or vGlut puncta, a region of interest was created and analyzed before and after PhTx treatment, and the sum intensity of the region of interest was then quantified. Data are reported from three different NMJs for BRP-GFP and vGlut-GFP. For consistency, analysis was restricted to type Ib boutons of NMJ 6/7.
STED imaging and analysis
STED microscopy was performed using a Leica Microsystems TCS SP8 gSTED 3× setup equipped with a pulsed white-light laser (∼80-ps pulse width, 80-MHz repetition rate; NKT Photonics) and two STED lasers for depletion (continuous wave at 592 nm, pulsed at 775 nm). The pulsed 775-nm STED laser was triggered by the white-light laser. Images were acquired with a 100×, 1.4-NA oil-immersion objective at room temperature. 512 × 512-pixel resolution 2D STED images were scanned at 400 Hz using 4× line averaging and frame accumulation 4×. The lateral pixel size was set to values of ∼13 nm. All images within one dataset were acquired with the same microscope settings. 12 images over 4 larval filets were acquired per genotype. Images were processed using the Huygens deconvolution software (Scientific Volume Imaging) using a theoretical point spread function automatically computed based on a pulsed STED-optimized function and the specific microscope parameters. Default deconvolution settings were applied. Contrast and brightness were adapted for visualization only, where necessary, using ImageJ software. The numbers of BRP and Unc13A modules were analyzed using ImageJ software as described previously ( Böhme et al., 2019 ). In-focus planar AZs were manually chosen, and modules were counted automatically using the Find Maxima function with a noise tolerance of 0 to detect the position of cluster centers (local intensity maxima). To prevent detection of the same cluster more than once, a defined minimum distance of 50 nm was used and only the local maximas with the highest intensity values were considered. Maximas found outside the AZ, as defined by the BRP and Unc13A ring, were ignored. This resulted in a categorization of AZs of wild type, endo RNAi , and rab3 in different classes, with the most frequent number of clusters per AZ being the representative modular number for that genotype. The histogram and cumulative frequency plot shown in Fig. 5 (I and J) were generated by counting the number of images in each cluster number class and dividing each value by the total amount of AZs in all classes for different genotypes.
Electrophysiology
All dissections and recordings were performed in modified HL-3 saline ( Stewart et al., 1994 ; Kikuma et al., 2017 ) containing (in mM): 70 NaCl, 5 KCl, 10 MgCl 2 , 10 NaHCO 3 , 115 sucrose, 5 trehelose, 5 Hepes, and 0.4 CaCl 2 (unless otherwise specified), pH 7.2. NMJ sharp electrode (electrode resistance between 10–35 MΩ) recordings were performed on muscles 6 or 4 of abdominal segments A2 and A3 in wandering third-instar larvae ( Goel et al., 2019b ). Relative data from muscles 6 or 4 were similar; recordings from muscle 6 are presented in the figures, while the data from muscle 4 are shown in Table S1. Recordings were performed on an Olympus BX61 WI microscope using a 40×/0.80 water-dipping objective. Recordings were acquired using an Axoclamp 900A amplifier, Digidata 1440A acquisition system, and pClamp 10.5 software (Molecular Devices). Electrophysiological sweeps were digitized at 10 kHz and filtered at 1 kHz. Data were analyzed using Clampfit (Molecular devices), MiniAnalysis (Synaptosoft), and Excel (Microsoft) software. mEPSPs were recorded in the absence of any stimulation and cut motor axons were stimulated to elicit EPSPs. An ISO-Flex stimulus isolator (A.M.P.I.) was used to modulate the amplitude of stimulatory currents. Intensity was adjusted for each cell, set to consistently elicit responses from both neurons innervating the muscle segment, but avoiding overstimulation. Average mEPSP, EPSP, and quantal content were calculated for each genotype. Muscle input resistance (R in ) and resting membrane potential (V rest ) were monitored during each experiment. Recordings were rejected if the V rest was more depolarized than −60 mV, if the R in was less than 5 MΩ, or if either measurement deviated by more than 10% during the course of the experiment. Larvae were incubated with or without PhTx (20 µM; Sigma) resuspended in HL-3 for 10 min, as described previously ( Frank et al., 2006 ; Dickman and Davis, 2009 ). EM EM analysis was performed as described previously ( Atwood et al., 1993 ). Wandering third-instar larvae were dissected in Ca 2+ -free HL-3 and then fixed in 2.5% glutaraldehyde/0.1 M cacodylate buffer at 4°C. Larvae were then washed three times for 20 min in 0.1 M cacodylate buffer. The larval pelts were then placed in 1% osmium tetroxide/0.1M cacodylate buffer for 1 h at room temperature. After washing the larva twice with cacodylate and twice with water, larvae were then dehydrated in ethanol. Samples were cleared in propylene oxide and infiltrated with 50% Eponate 12 in propylene oxide overnight. The following day, samples were embedded in fresh Eponate 12. EM sections were obtained on a Morgagni 268 transmission electron microscope (FEI). NMJs were serial sectioned at a 60- to 70-nm thickness. The sections were mounted on Formvar-coated single slot grids and viewed at a 23,000 magnification and were recorded with a Megaview II CCD camera. Images were analyzed blind to genotype using the general analysis toolkit in the NIS Elements software and ImageJ software.
Statistical analysis
Data were analyzed using GraphPad Prism (version 7.0) or Microsoft Excel software (version 16.22). Sample values were tested for normality using the D’Agostino and Pearson omnibus normality test, which determined that the assumption of normality of the sample distribution was not violated. Data were then compared using either a one-way ANOVA and tested for significance using a Tukey’s multiple comparison test or an unpaired two-tailed t test with Welch’s correction. Cumulative frequency distributions were tested for significance using the Kolmogorov–Smirnov (K-S) test. For individual puncta intensity analysis before and after PhTx ( Fig. 7 F ), a ratio paired t test was used. For STED imaging, the cumulative frequency plots were made smooth using GraphPad Prism Smoothing algorithm default settings (four neighbors averaged on each size and a second-order smoothing polynomial). All data are presented as mean ± SEM; n indicates sample number, and P denotes the level of significance assessed (*, P < 0.05; **, P < 0.01; ***, P < 0.001; ****, P < 0.0001; ns, not significant). Statistics of all experiments are summarized in Table S1. Online supplemental material Fig. S1 demonstrates distinct mechanisms enlarge quantal size in endo and vGlut-OE. Fig. S2 shows that SV recycling is unperturbed in vGlut-OE. Fig. S3 displays a mirroring of postsynaptic glutamate receptor fields with presynaptic AZ structure. Fig. S4 shows ultrastructural analysis of T-bar width and AZ length in endo . Fig. S5 demonstrates that homeostatic depression and AZ scaling can be balanced with rapid homeostatic potentiation.
Table
S1 summarizes all the statistics related to imaging (confocal, STED, and EM) and electrophysiology.
Table
S2 details the antibodies and Drosophila stocks used in this study.
Online supplemental material Fig. S1 demonstrates distinct mechanisms enlarge quantal size in endo and vGlut-OE. Fig. S2 shows that SV recycling is unperturbed in vGlut-OE. Fig. S3 displays a mirroring of postsynaptic glutamate receptor fields with presynaptic AZ structure. Fig. S4 shows ultrastructural analysis of T-bar width and AZ length in endo . Fig. S5 demonstrates that homeostatic depression and AZ scaling can be balanced with rapid homeostatic potentiation.
Table
S1 summarizes all the statistics related to imaging (confocal, STED, and EM) and electrophysiology.
Table
S2 details the antibodies and Drosophila stocks used in this study.
Supplementary Material Supplemental Materials (PDF) Table S1 (PDF)
📊 Figures
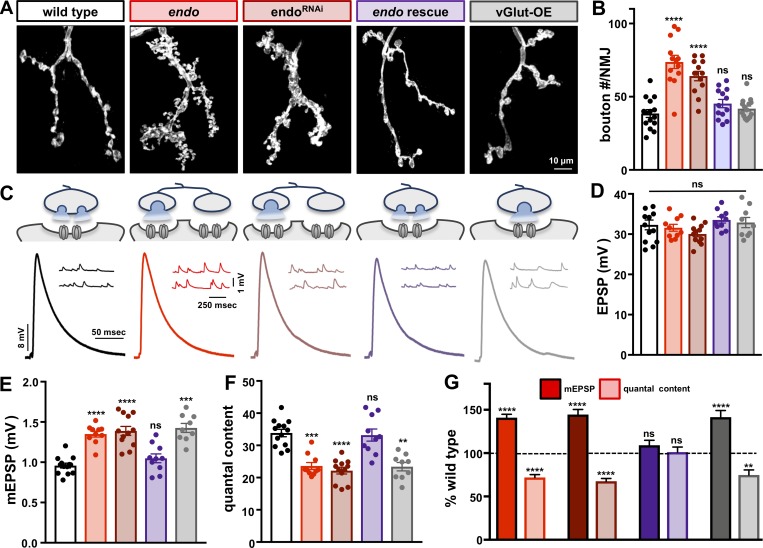
Figure 1.
Synaptic strength is stabilized despite enhanced synaptic growth and quantal size in endo mutants. (A) Representative images of third-instar larval muscle 4 NMJs immunostained with antibodies against ...
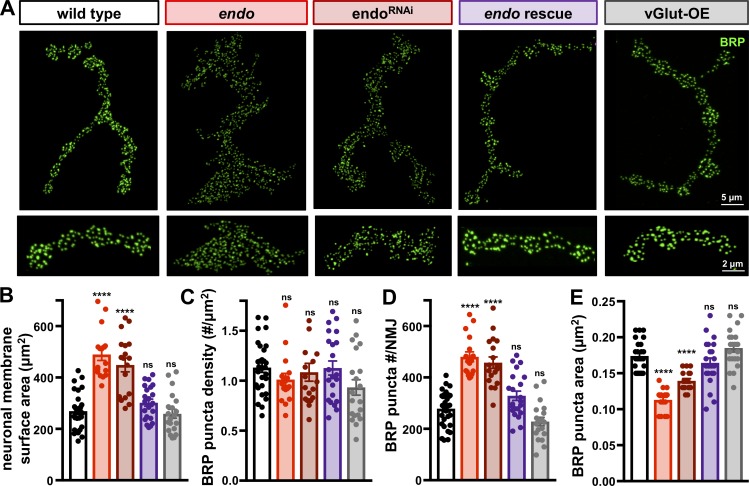
Figure 2.
Increased AZ number but reduced AZ size revealed at endo mutant NMJs. (A) Representative NMJs in the indicated genotypes immunostained with antibodies against the AZ protein BRP, with insets below sho...
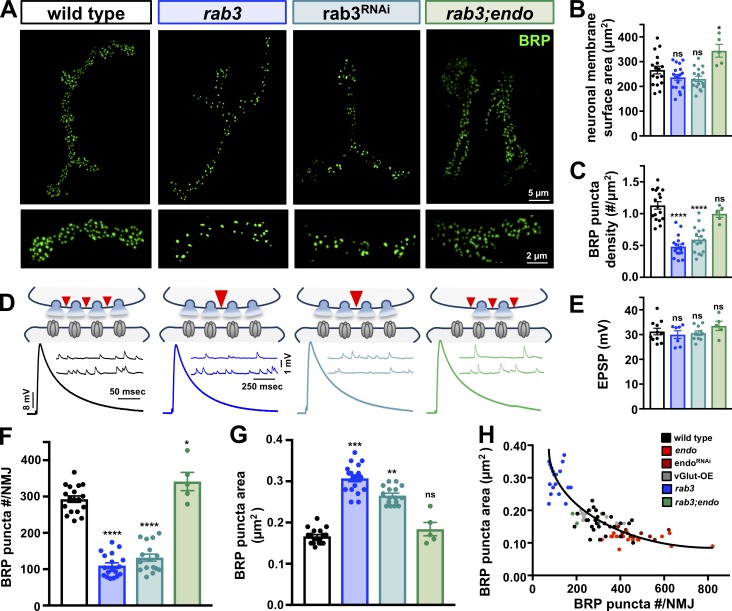
Figure 3.
Increased AZ size but reduced number and density at rab3 mutant NMJs. (A) Representative NMJs immunostained with anti-BRP and insets below showing individual boutons from the same NMJ in wild-type, ra...
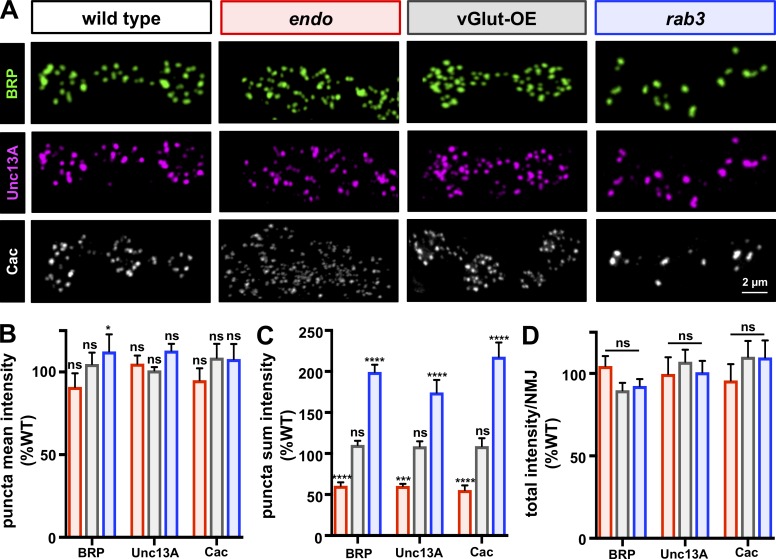
Figure 4.
BRP, Unc13A, and Cac abundance scale in endo and rab3 mutants, while total levels per NMJ remain constant. (A) Representative type Ib boutons immunostained with anti-BRP, anti-Unc13A, and endogenously...
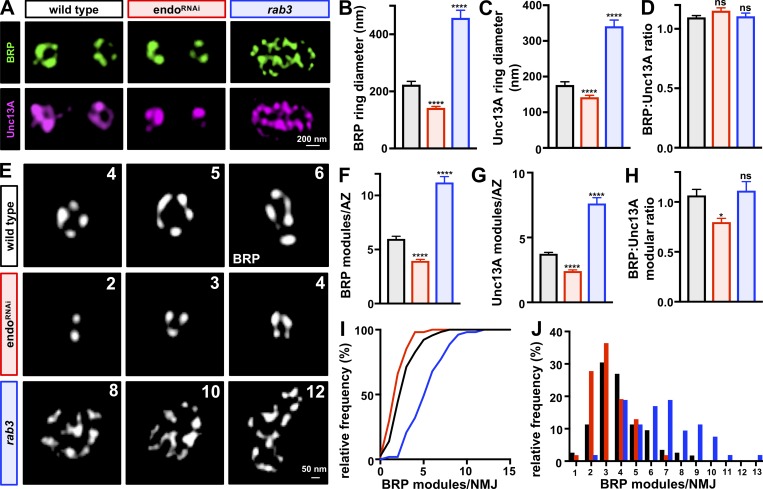
Figure 5.
Elastic modularity of AZ nanostructure revealed by STED imaging. (A) Representative STED images of AZs in wild-type, endo RNAi , and rab3 mutant NMJs labeled with anti-BRP and anti-Unc13A. (Bu2013D) B...
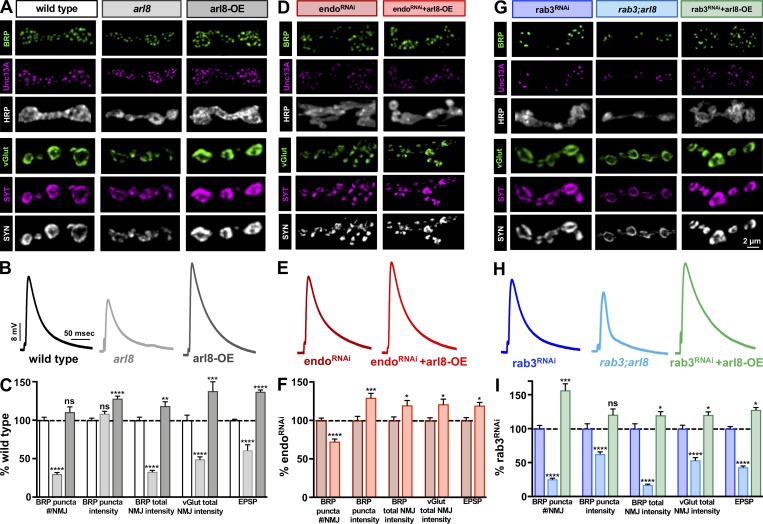
Figure 6.
Manipulating presynaptic cargo transport to NMJ terminals by arl8 modulates the gain of synaptic strength at endo and rab3 NMJs. (A) Representative images of type Ib NMJ boutons immunostained with ant...
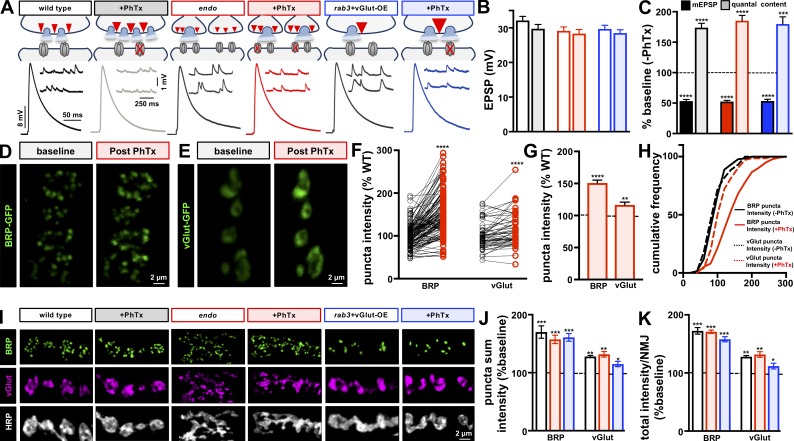
Figure 7.
Homeostatic potentiation can be balanced with both depression and AZ scaling. (A) Schematic and representative traces of recordings from wild type, endo , and rab3 mutants combined with vGlut overexpr...
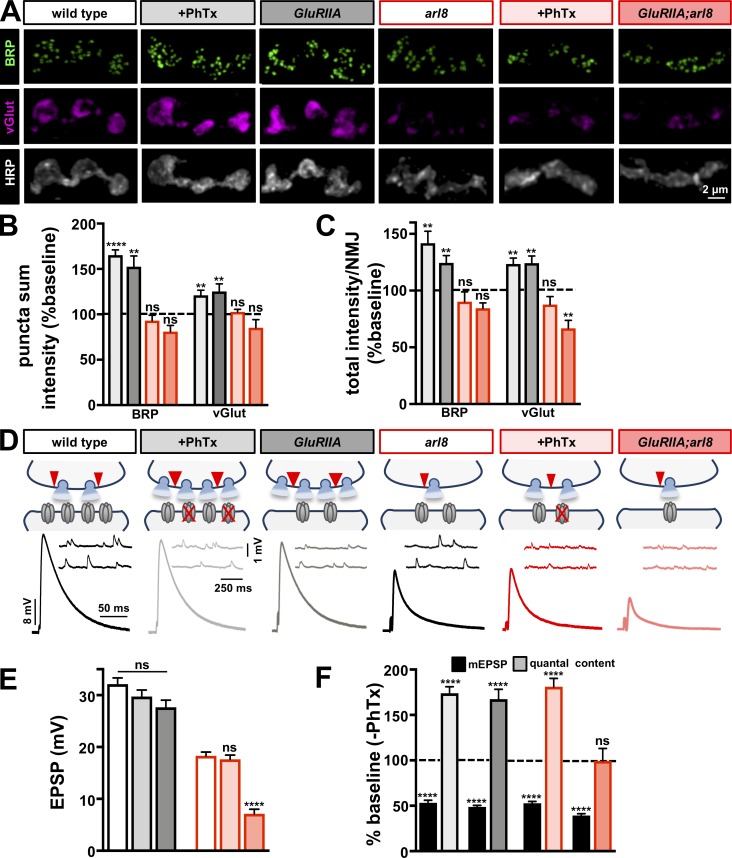
Figure 8.
arl8 is necessary for the rapid remodeling of AZ structure during homeostatic signaling and for the chronic expression of PHP. (A) Representative images of NMJs immunostained with anti-BRP, anti-vGlut...
Figure images are served from the NIH/NLM PubMed Central Open Access Subset or Europe PMC; copyright remains with the publishers and authors.
💬 Discussion
0 commentsNo comments yet. Be the first to start a discussion!
Leave a Comment