Abstract
Viral infection is usually studied at the population level by averaging over millions of cells. However, infection at the single-cell level is highly heterogeneous, with most infected cells giving rise to no or few viral progeny while some cells produce thousands. Analysis of Herpes Simplex virus 1 (HSV-1) infection by population-averaged measurements has taught us a lot about the course of viral infection, but has also produced contradictory results, such as the concurrent activation and inhibition of type I interferon signaling during infection. Here, we combine live-cell imaging and single-cell RNA sequencing to characterize viral and host transcriptional heterogeneity during HSV-1 infection of primary human cells. We find extreme variability in the level of viral gene expression among individually infected cells and show that these cells cluster into transcriptionally distinct sub-populations. We find that anti-viral signaling is initiated in a rare group of abortively infected cells, while highly infected cells undergo cellular reprogramming to an embryonic-like transcriptional state. This reprogramming involves the recruitment of β-catenin to the host nucleus and viral replication compartments, and is required for late viral gene expression and progeny production. These findings uncover the transcriptional differences in cells with variable infection outcomes and shed new light on the manipulation of host pathways by HSV-1.
🔬 Techniques
🔭 Microscopes
🧬 Organisms
💻 Software
✨ Fluorophores
🧪 Sample Preparation
🔬 Cell Lines
🏭 Microscope Brands
🧪 Reagent Suppliers
💻 Software Details
💻 Code & Software
📂💾 Data Repositories
🏛️ Research Organizations (ROR)
Affiliated research institutions:
📋 Methods
Key resources table
Reagent type (species) or resource Designation Source or reference Identifiers Additional information Cell line ( Homo sapiens ) HDFn, primary human dermal fibrobalsts Cascade Biologics cat #C0045C Cell line ( Homo sapiens ) A549 Sigma-Aldrich cat #86012804-1VL Cell line ( Homo sapiens ) Mel624 Mel624 is a patient-derived melanoma cell-line, generated by the lab of Professor Thomas Gajewski at the Univeristy of Chicago Cell line ( Cercopithecus aethiops ) Vero Obtained from the lab of Matthew D Weitzman, University of Pennsylvania Used to grow wildtype HSV-1 and for plaque assay Cell line ( Homo sapiens ) U2OS Obtained from the lab of Matthew D Weitzman, University of Pennsylvania Used to grow δICP0 HSV-1 Strain, strain background (HSV-1) Wild-type strain 17, ICP4-YFP Everett et al., 2003 Obtained from the lab of Matthew D Weitzman, University of Pennsylvania Strain, strain background (HSV-1) δICP0 strain 17, ICP4-YFP Everett et al., 2003 Obtained from the lab of Matthew D Weitzman, University of Pennsylvania Antibody β-catenin (mouse monoclonal) R and D systems MAB13291-SP Used for IF 1:400 Antibody IRF3 (rabbit monoclonal) Cell Signaling Technologies cat #11904 Used for IF 1:200 Sequence-based reagent QPCR primer ICP4 Fwd IDT GCGTCGTCGAGGTCGT Sequence-based reagent QPCR primer ICP4 Rev IDT CGCGGAGACGGAGGAG Sequence-based reagent QPCR primer ICP8 Fwd IDT CGACAGTAACGCCAGAAGCTC Sequence-based reagent QPCR primer ICP8 Rev IDT GGAGACAAAGCCCAAGACGG Sequence-based reagent QPCR primer gB Fwd IDT CACCGCTACTCCCAGTTTATGG Sequence-based reagent QPCR primer gB Rev IDT CCCTTGGCGTTGATCTTGTC Sequence-based reagent QPCR primer UL36 Fwd IDT CGGGTCAAAAAGGTATGCGGTGT Sequence-based reagent QPCR primer UL36 Rev IDT TGTCGTACACGCTCCTAACCATTG Sequence-based reagent QPCR primer IFIT1 Fwd IDT CCT CCT TGG GTT CGT CTA CA Sequence- based reagent QPCR primer IFIT1 Rev IDT GAA ATG AAA TGT GAA AGT GGC TGA T Sequence- based reagent QPCR primer IFIT2 Fwd IDT GCTGAATCCTGACAACCAGTACC Sequence- based reagent QPCR primer IFIT2 Rev IDT CACCTTCCTCTTCACCTTCTTCAC Sequence-based reagent QPCR primer CTNNB1 Fwd IDT GAGATGGCCCAGAATGCAGTT Sequence-based reagent QPCR primer CTNNB1 Rev IDT GGTGCATGATTTGCGGGAC Sequence-based reagent siRNA againstβ-catenin Dharmacon M-003482-00-0005 Sequence-based reagent siRNA non-targeting Dharmacon D-001206-13-05 Commercial assay or kit RNEasy PLUS minikit QIAGEN cat #74134 Chemical compound, drug iCRT14 Sigma-Aldrich cat ##SML0203 Stock made in DMSO - 20 mM. Used at 20 micromolar final concentration Software, algorithm Single cell RNA seq analysis This paper https://github.com/nirdrayman/single-cell-RNAseq-HSV1.git Cells, viruses and inhibitors Primary neonatal human dermal fibroblasts (HDFn) were purchased from Cascade Biologics (cat #C0045C), grown and maintained in medium 106 (Cascade Biologics, cat #M106500) supplemented with Low Serum Growth Supplement (Cascade Biologics, cat #S00310). Cells were maintained for upto eight passages, and experiments were performed on cells between passages 4 and 7. A549 cells were purchased from Sigma-Aldrich and maintained in DMEM supplemented with 10% fetal bovine serum. Mel624, a patient-derived melanoma cell-line, was obtained from the lab of Professor Thomas Gajewski at the Univeristy of Chicago and maintained in RPMI supplemented with HEPES, NEAA, Pen/Strep and 10% fetal bovine serum. Vero and U2OS cells (obtained from the laboratory of Matthew D. Weitzman, University of Pennsylvania) were grown in DMEM supplemented with 10% fetal bovine serum and were used for viral propagation and titration. All of the cells that were used were routinely subjected to mycoplasma testing by PCR and found negative. Wildtype and ΔICP0 HSV-1 (strain 17) viruses expressing ICP4-YFP were generated by Roger Everett ( Everett et al., 2003 ) and were a kind gift from Matthew D. Weitzman. Viral stocks were prepared by infecting Vero cells (for wildtype virus) or U2OS cells (for ΔICP0) at an MOI of 0.01. Viral progeny were harvested 2–3 days later using three cycles of freezing and thawing. Viral stocks were titrated by plaque assays on Vero cells, aliquoted and stored at −80°C. iCRT14, a β-catenin inhibitor, was purchased from Sigma-Aldrich (cat #SML0203) and dissolved in DMSO to make a 20 mM stock solution. iCRT14 stock solution (or DMSO alone as a control) was diluted 1:1000 in growth medium for cell treatment (20 µM final concentration). Measuring genomes to plaque-forming unit (PFU) ratio and determining MOI for experiments We determined the amount of viral genomes in our viral stocks using digital droplet PCR (ddPCR), a method that allows absolute quantification of nucleic acids. 10 µl of viral stock was combined with 90 µl of lysis solution (0.6% SDS, 400 µg/ml Proteinase K) and incubated over night at 37°C. The solution was then boiled (at 95°C) for 10 min and 10-fold serial dilutions were made in H 2 O. Three primer sets (detecting the viral DNA of the TK, gB or UL36 genes) were used to quantify the amount of viral DNA. PFU were counted by plaque assay on Vero cells. These measurements revealed a genomes:PFU ratio of 36 ± 4 for wildtype HSV-1 and 1,422 ± 34 for ΔICP0. The MOI for experiments was determined empirically, to achieve ~50% ICP4 + cells at 5 hr post infection of HDFn. This corresponded to an MOI of 2 for wild-type virus and an MOI of 0.5 for ΔICP0. Note that, assuming a Poisson distribution, it is unlikely that any of the cells in our experiment did not encounter at least one viral genome (p=4×10 −31 for wildtype and 1 × 10 −304 for ΔICP0).
Show full methods section
Key resources table
Reagent type (species) or resource Designation Source or reference Identifiers Additional information Cell line ( Homo sapiens ) HDFn, primary human dermal fibrobalsts Cascade Biologics cat #C0045C Cell line ( Homo sapiens ) A549 Sigma-Aldrich cat #86012804-1VL Cell line ( Homo sapiens ) Mel624 Mel624 is a patient-derived melanoma cell-line, generated by the lab of Professor Thomas Gajewski at the Univeristy of Chicago Cell line ( Cercopithecus aethiops ) Vero Obtained from the lab of Matthew D Weitzman, University of Pennsylvania Used to grow wildtype HSV-1 and for plaque assay Cell line ( Homo sapiens ) U2OS Obtained from the lab of Matthew D Weitzman, University of Pennsylvania Used to grow δICP0 HSV-1 Strain, strain background (HSV-1) Wild-type strain 17, ICP4-YFP Everett et al., 2003 Obtained from the lab of Matthew D Weitzman, University of Pennsylvania Strain, strain background (HSV-1) δICP0 strain 17, ICP4-YFP Everett et al., 2003 Obtained from the lab of Matthew D Weitzman, University of Pennsylvania Antibody β-catenin (mouse monoclonal) R and D systems MAB13291-SP Used for IF 1:400 Antibody IRF3 (rabbit monoclonal) Cell Signaling Technologies cat #11904 Used for IF 1:200 Sequence-based reagent QPCR primer ICP4 Fwd IDT GCGTCGTCGAGGTCGT Sequence-based reagent QPCR primer ICP4 Rev IDT CGCGGAGACGGAGGAG Sequence-based reagent QPCR primer ICP8 Fwd IDT CGACAGTAACGCCAGAAGCTC Sequence-based reagent QPCR primer ICP8 Rev IDT GGAGACAAAGCCCAAGACGG Sequence-based reagent QPCR primer gB Fwd IDT CACCGCTACTCCCAGTTTATGG Sequence-based reagent QPCR primer gB Rev IDT CCCTTGGCGTTGATCTTGTC Sequence-based reagent QPCR primer UL36 Fwd IDT CGGGTCAAAAAGGTATGCGGTGT Sequence-based reagent QPCR primer UL36 Rev IDT TGTCGTACACGCTCCTAACCATTG Sequence-based reagent QPCR primer IFIT1 Fwd IDT CCT CCT TGG GTT CGT CTA CA Sequence- based reagent QPCR primer IFIT1 Rev IDT GAA ATG AAA TGT GAA AGT GGC TGA T Sequence- based reagent QPCR primer IFIT2 Fwd IDT GCTGAATCCTGACAACCAGTACC Sequence- based reagent QPCR primer IFIT2 Rev IDT CACCTTCCTCTTCACCTTCTTCAC Sequence-based reagent QPCR primer CTNNB1 Fwd IDT GAGATGGCCCAGAATGCAGTT Sequence-based reagent QPCR primer CTNNB1 Rev IDT GGTGCATGATTTGCGGGAC Sequence-based reagent siRNA againstβ-catenin Dharmacon M-003482-00-0005 Sequence-based reagent siRNA non-targeting Dharmacon D-001206-13-05 Commercial assay or kit RNEasy PLUS minikit QIAGEN cat #74134 Chemical compound, drug iCRT14 Sigma-Aldrich cat ##SML0203 Stock made in DMSO - 20 mM. Used at 20 micromolar final concentration Software, algorithm Single cell RNA seq analysis This paper https://github.com/nirdrayman/single-cell-RNAseq-HSV1.git Cells, viruses and inhibitors Primary neonatal human dermal fibroblasts (HDFn) were purchased from Cascade Biologics (cat #C0045C), grown and maintained in medium 106 (Cascade Biologics, cat #M106500) supplemented with Low Serum Growth Supplement (Cascade Biologics, cat #S00310). Cells were maintained for upto eight passages, and experiments were performed on cells between passages 4 and 7. A549 cells were purchased from Sigma-Aldrich and maintained in DMEM supplemented with 10% fetal bovine serum. Mel624, a patient-derived melanoma cell-line, was obtained from the lab of Professor Thomas Gajewski at the Univeristy of Chicago and maintained in RPMI supplemented with HEPES, NEAA, Pen/Strep and 10% fetal bovine serum. Vero and U2OS cells (obtained from the laboratory of Matthew D. Weitzman, University of Pennsylvania) were grown in DMEM supplemented with 10% fetal bovine serum and were used for viral propagation and titration. All of the cells that were used were routinely subjected to mycoplasma testing by PCR and found negative. Wildtype and ΔICP0 HSV-1 (strain 17) viruses expressing ICP4-YFP were generated by Roger Everett ( Everett et al., 2003 ) and were a kind gift from Matthew D. Weitzman. Viral stocks were prepared by infecting Vero cells (for wildtype virus) or U2OS cells (for ΔICP0) at an MOI of 0.01. Viral progeny were harvested 2–3 days later using three cycles of freezing and thawing. Viral stocks were titrated by plaque assays on Vero cells, aliquoted and stored at −80°C. iCRT14, a β-catenin inhibitor, was purchased from Sigma-Aldrich (cat #SML0203) and dissolved in DMSO to make a 20 mM stock solution. iCRT14 stock solution (or DMSO alone as a control) was diluted 1:1000 in growth medium for cell treatment (20 µM final concentration). Measuring genomes to plaque-forming unit (PFU) ratio and determining MOI for experiments We determined the amount of viral genomes in our viral stocks using digital droplet PCR (ddPCR), a method that allows absolute quantification of nucleic acids. 10 µl of viral stock was combined with 90 µl of lysis solution (0.6% SDS, 400 µg/ml Proteinase K) and incubated over night at 37°C. The solution was then boiled (at 95°C) for 10 min and 10-fold serial dilutions were made in H 2 O. Three primer sets (detecting the viral DNA of the TK, gB or UL36 genes) were used to quantify the amount of viral DNA. PFU were counted by plaque assay on Vero cells. These measurements revealed a genomes:PFU ratio of 36 ± 4 for wildtype HSV-1 and 1,422 ± 34 for ΔICP0. The MOI for experiments was determined empirically, to achieve ~50% ICP4 + cells at 5 hr post infection of HDFn. This corresponded to an MOI of 2 for wild-type virus and an MOI of 0.5 for ΔICP0. Note that, assuming a Poisson distribution, it is unlikely that any of the cells in our experiment did not encounter at least one viral genome (p=4×10 −31 for wildtype and 1 × 10 −304 for ΔICP0).
Time-lapse fluorescent imaging
HDFn cells were seeded on 6-well plates and allowed to attach and grow for one day. On the day of the experiment, cells were counted and infected with HSV-1 at an MOI of 2. Cells were washed once with 106 medium without supplements, and virus was added in the same serum-free media at a final volume of 300 μl per well. Virus was allowed to adsorb to cells for one hour at 37°C with occasional agitation to avoid cell drying. The inoculum was aspirated and 2 ml of full- growth medium was added: this point was considered as ‘time zero'. Cells were imaged on a Nikon Ti-Eclipse, which was equipped with a humidity and temperature control chamber. Images were acquired every 15 min for 24 hr from multiple fields of view. Image analysis was performed with ImageJ and MATLAB. Single-cell RNA-sequencing HDFn infected with wildtype HSV-1 at an MOI of 2 or ΔICP0 at an MOI of 0.5 were harvested at 5 hr post-infection and washed three times in PBS containing 0.01% BSA. Cells were counted and processed according to the Drop-seq protocol ( Macosko et al., 2015 ) in the Genomics facility core at the University of Chicago. Sequencing was performed on the Illumina NextSeq500 platform. Preliminary data analysis (quality control, trimming of adaptor sequences, UMI and cell barcode extraction) was performed on a Linux platform using the Drop-seq Tools (Version 1.13) and the Drop-seq Alignment Cookbook (Version 1.2), which are available at https://github.com/broadinstitute/Drop-seq/releases . Alignment of reads was performed using the STAR aligner (Version 2.5.4b) ( Dobin et al., 2013 ) to a concatenated version of the human GRCh38 primary assembly (Gencode release 27) and HSV-1 genomes (Genbank accession: JN555585 ). The HSV-1 genome annotation file was kindly provided by Moriah Szpara (Pennsylvannia State University). Following the generation of the DGE (digital gene expression) file, further analyses were performed in MATLAB, these included quality control, cell clustering, correlation and differential gene expression analyses and data visualization. All the of the scripts used for data analysis have been deposited in Github ( Drayman, 2019 ; copy archived at https://github.com/elifesciences-publications/single-cell-RNAseq-HSV1 ). Key points in the analysis are expanded on below.
Cell filtering
Following the construction of the initial DGEs (digital expression matrices), we filtered out cells with low (below 2000) and high (above 10,000) Unique Molecular Identifier (UMI) counts. We then assessed the fraction of mitochondrial genes in individual cells and filtered out cells with high mitochondrial fraction (above 0.2 for mock- and wildtype-infected cells, above 0.4 for ΔICP0-infected cells). The distributions of the number of UMI, total genes and mitochondrial genes are presented in Figure 1—figure supplement 1 . This resulted in three DGEs, one for each condition (mock-infected, wildtype-infected and ΔICP0-infected) containing 4500, 807 and 1613 cells, respectively. Normalization and UMI regression The DGEs were log-normalized by dividing gene expression by the total number of UMI for each cell, multiplying by 10,000, adding one and taking the log of the value. We then regressed out the effect of the number of UMI on gene expression, by constructing a linear model for each gene’s expression as a function of total number of UMI. The expected value from the model was subtracted from the gene’s expression and the residual kept. We then performed Z-scoring, by subtracting the gene’s mean expression and dividing by the gene’s standard deviation. Cell-cycle regression A list of 14 G 2 /M marker genes (HMGB2, CDK1, NUSAP1, UBE2C, BIRC5, TPX2, TOP2A, NDC80, CKS2, NUF2, CKS1B, MKI67, TMPO, and CENPF) was used to construct a cell-cycle score (for every gene from the list expressed by the cell, +1 was added to the score). Regression of the cell-cycle score was done as described above for UMI regression (keeping the residual after linear model fitting).
Clustering and differential gene expression analysis
Cell were clustered using k-means clustering. For clustering wild-type-infected cells, we used all the host and viral genes. For ΔICP0-infected cells, we used the viral genes as well as the top host genes that correlated with viral gene expression (top 100 correlated and top 100 anti-correlated). Genes that are differentially expressed between clusters were then identified by a two-sided Wilcoxon rank sum test, followed by Benjamini and Hochberg false-detection rate (FDR) correction. A gene was considered differentially expressed if the FDR-corrected p-value was below 0.05.
RNA-sequencing of sorted cells
HDFn cells were mock infected or HSV-1 infected as described above, trypsinized, washed and re-suspended in full growth media. Cells were filtered through a 100 μm mesh into FACS sorting tubes and kept on ice. HSV-1 infected cells were sorted into two populations based on their ICP4-YFP expression. 0.5 million cells were collected from each population. Mock-infected cells were similarly sorted. ICP4-negative cells had the same level of YFP fluorescence at mock-infected cells. For ICP4-positive cells, we collected cells that were in the top 30% of YFP expression. The two populations were clearly separated from each other. Sorting was performed on an AriaFusion FACS machine (BD) at the University of Chicago flow-cytometry core facility. Total RNA was extracted from cells using the RNeasy Plus Mini Kit (QIAGEN) and submitted to The University of Chicago Genomics core for library preparation and sequencing on a HiSeq4000 platform (Illumina). Reads were mapped to a concatenated version of the human and HSV-1 genomes with STAR aligner (see single-cell RNA-sequencing above for details). Reads were counted using the featureCounts command, which is a part of the Subread package ( Liao et al., 2013 ). Further analyses were performed in MATLAB and these included differential gene expression analyses and data visualization.
Data availability
All sequencing data have been deposited in the Gene Expression Omnibus (GEO) under accession number GSE126042 . All of the scripts used for data analysis and visualization are available through GitHub at: https://github.com/nirdrayman/single-cell-RNAseq-HSV1.git .
Immunofluorescence staining
HDFn were seeded in 24-well plates and allowed to attach and grow for one day. Cells were infected as described above and fixed using a 4% paraformaldehyde solution at 5 hr post-infection. Cells were fixed for 15 min at room temperature and washed, blocked and permeabilized with a 10% BSA, 0.5% Triton-X solution in PBS for one hour. Cells were then incubated with primary antibodies in a staining solution (2% BSA, 0.1% Triton-X in PBS) overnight at 4°C. Cells were washed three times with PBS, incubated with secondary antibodies in staining solution for 1 hr at room temperature, washed three times with PBS and covered with 1 ml PBS containing a 1:10,000 dilution of Hoechst 33342 (Invitrogen, cat #H3570). Cells were imaged on a Nikon Ti-Eclipse inverted epi-fluorescent microscope. Primary antibodies were mouse monoclonal anti-β-catenin (R and D systems, cat #MAB13291, used at 1:200 dilution) and rabbit monoclonal anti-IRF3 (Cell Signaling Technologies, Cat #11904S, used at 1:400 dilution). Secondary antibodies were AlexaFluor 555 conjugated anti-mouse and anti-rabbit F(ab’)two fragments (Cell Signaling Technologies, cat #4409S, #4413S, used at 1:1000 dilution). siRNA nucleofection 5 × 10 5 HDFn cells were washed once in PBS and nucleofected with 1 µM siRNA against β-catenin (Dharmacon, siGENOME Human CTNNB1, cat #M-003482-00-0005) or with a scrambled siRNA control (Dharmacon siGENOME Non-Targeting siRNA Pool #1, cat #D-001206-13-05) using the Human Dermal Fibroblast Nucleofector Kit (Lonza, cat #VPD-1001). β-catenin expression was assayed 3 days later by Q-PCR.
Additional files 10.7554/eLife.46339.019 Supplementary file 1. Differential gene expression identified by sRNAseq. (A) Genes that are upregulated in highly infected cells (wildtype infection). (B) GO annotations associated with genes from tab (A). (C) Transcription factors enriched in the promoters of genes from tab (A). (D) Genes that are upregulated in highly infected cells (ΔICP0 infection). (E) GO annotations associated with genes from tab (D). (F) Transcription factors enriched in the promoters of genes from tab (D). 10.7554/eLife.46339.020 Supplementary file 2. Analysis of genes that are upregulated in ICP4-negative sorted cells. (A) Genes that are upregulated in ICP4-negative cells (afer wildtype infection). (B) GO annotations associated with genes from tab (A). (C) Genes that are upregulated in ICP4-negative cells (after ΔICP0 infection). (D) GO annotations associated with genes from tab (C). (E) Transcription factors enriched in the promoters of genes from tab (C). 10.7554/eLife.46339.021 Supplementary file 3. Analysis of genes upregulated in ICP4-positive sorted cells. (A) Genes that are upregulated in ICP4-positive cells (after wildtype infection). (B) GO annotations associated with genes from tab (A). (C) Transcription factors that are enriched in the promoters of genes from tab (A). (D) Genes that are upregulated in ICP4-positive cells (after ΔICP0 infection). (E) GO annotations associated with genes from tab (D). (F) Transcription factors that are enriched in the promoters of genes from tab (D). 10.7554/eLife.46339.022 Transparent reporting form
📊 Figures
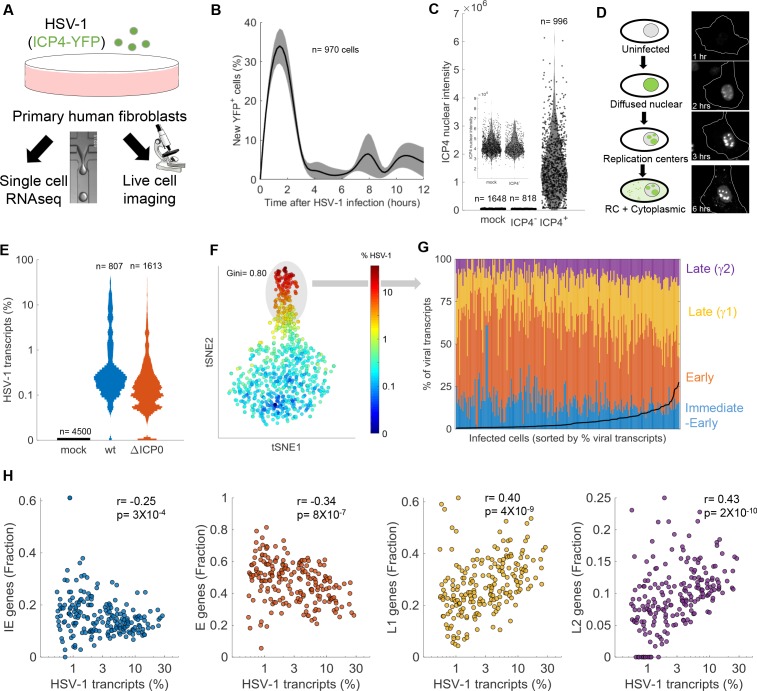
Figure 1.
Cell-to-cell variability in infection dynamics and viral gene expression.
( A )u00a0HDFn cells were infected with HSV-1 expressing ICP4-YFP and analyzed by time-lapse fluorescent imaging and scRNA-seq. ( B ) Distribution of the initial time of ICP4 expression. The black lin...
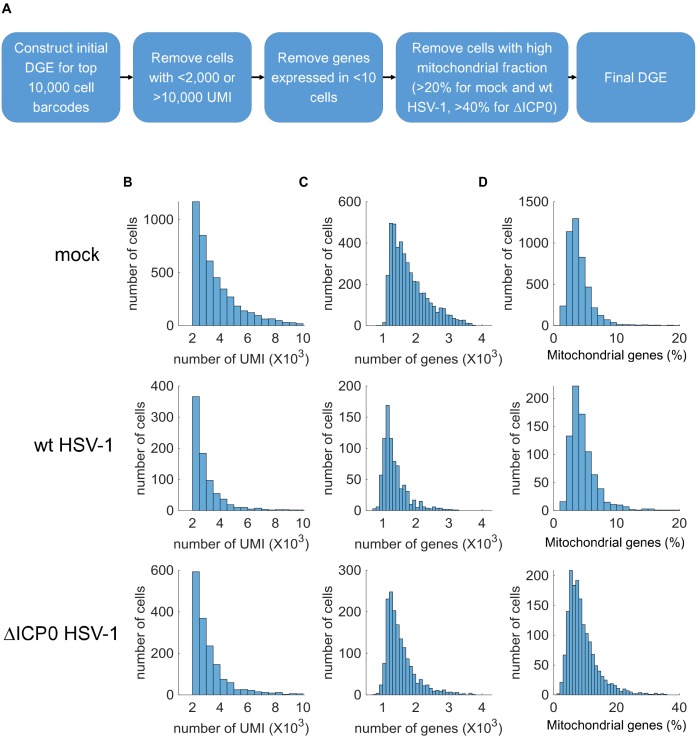
Figure 1u2014figure supplement 1.
Technical data relating to single-cell RNA-sequencing.
( A )u00a0Flow chart describing the generation of au00a0DGE (digital expression matrix) from raw sequencing data and the filtering criteria applied at different stages to the generation of the final D...
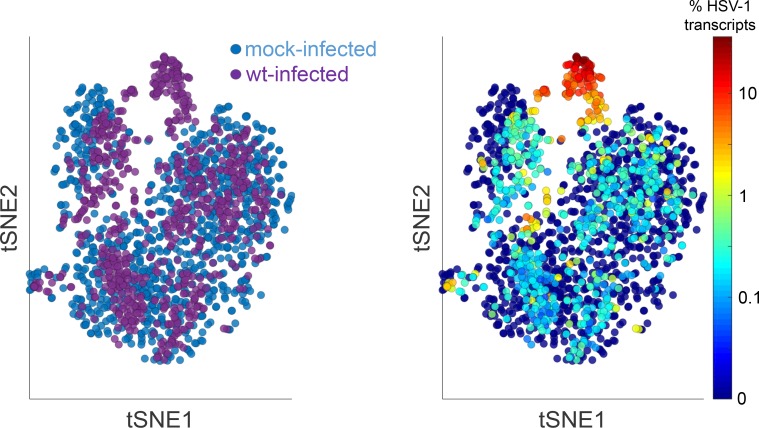
Figure 1u2014figure supplement 2.
Joint analysis of hostu00a0+viral genes in mock and wt-infected HDFn.
The left panel shows the identity of the cells (blueu00a0=u00a0mock, purpleu00a0=u00a0wt infected) and the right panel shows the level of HSV-1 gene expression (blueu00a0=u00a0low, redu00a0=u00a0high)...
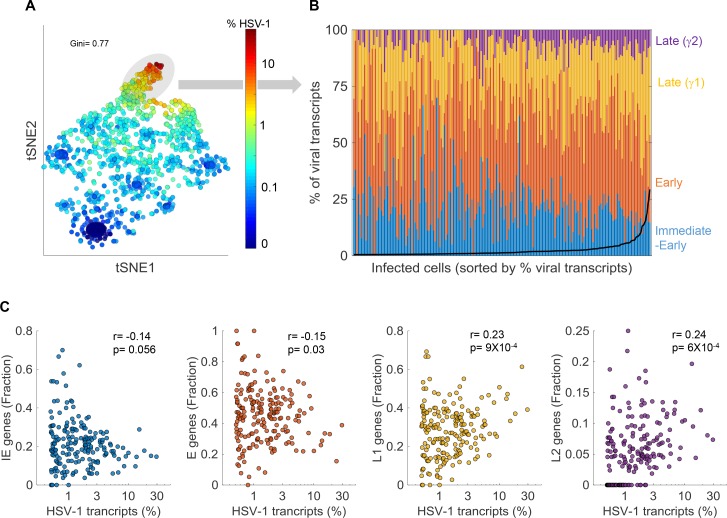
Figure 1u2014figure supplement 3.
Cell-to-cell variability in viral gene expression upon u0394ICP0 infection.
( A ) tSNE plot based on viral gene expression. Each dot represents a single cell and is colored according to the % of viral transcripts from blue (low) to red (high). Theu00a0color bar is logarithmic...
Figure 1u2014video 1.
Live imaging of HDFn infected by wildtype HSV-1 expressing ICP4-YFP.
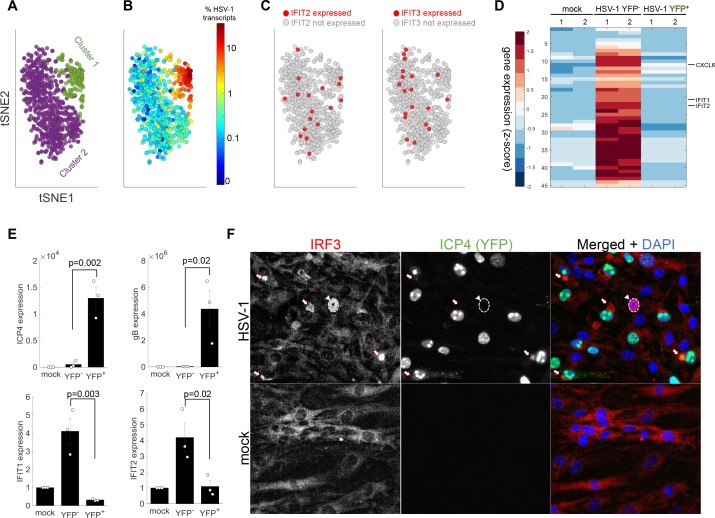
Figure 2.
The anti-viral program is initiated in a rare sub-population of abortively infected cells.
( A )u00a0tSNE plot based on viral and host gene expression. Cells are colored according to their clustering. Cluster one is colored green and cluster two is colored purple. ( B ) tSNE plot as in pane...
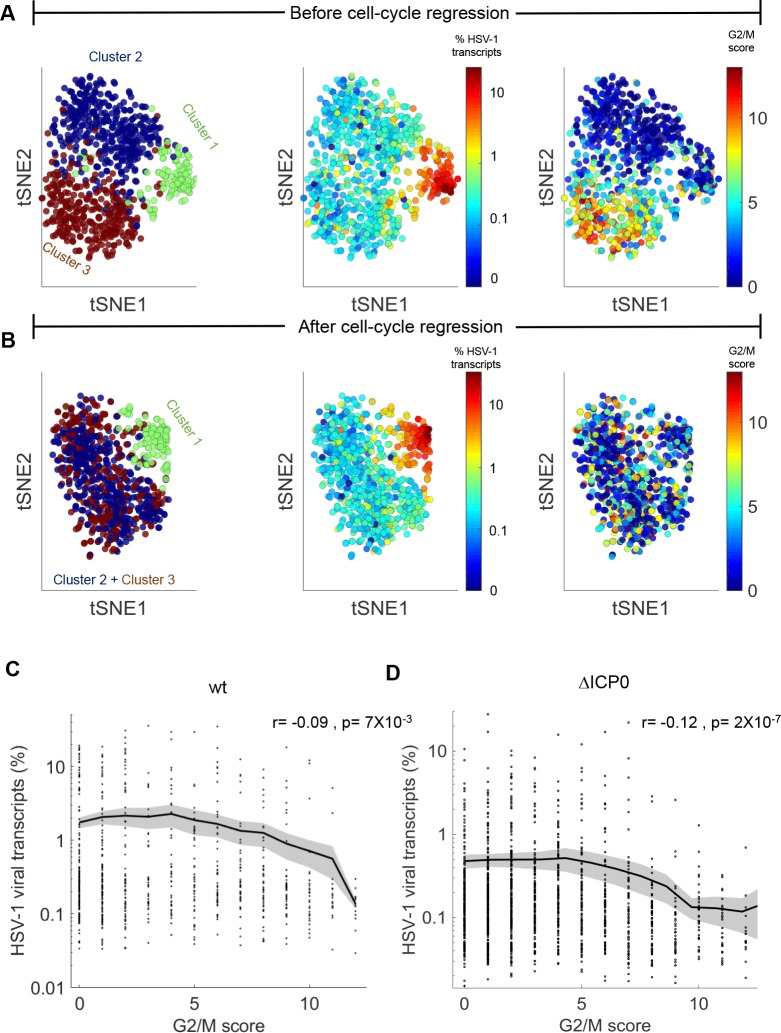
Figure 2u2014figure supplement 1.
Cell-cycle is anti-correlated with viral gene expression and is a major source of transcriptional variability.
( A )u00a0tSNE plots based on viral and host gene expression (wildtype infection). (Left) Cells are colored according to their clustering. Cluster one is colored green, cluster two is colored blue and...
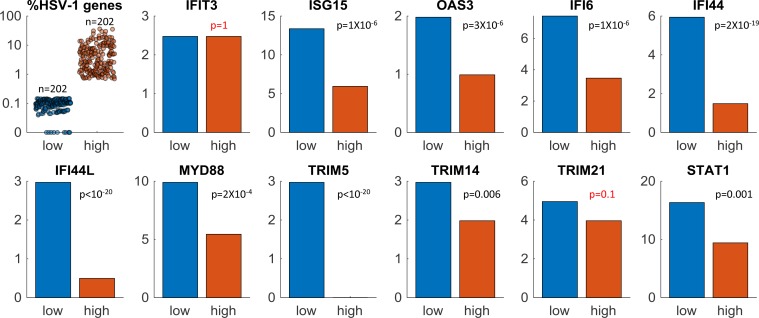
Figure 2u2014figure supplement 2.
ISGs expression in single-cells infected by wildtype HSV-1.
Here we compare the expression of interferon-stimulated genesu00a0(ISGs) in the top (orange) and bottom (blue) 25% of cells, sorted according to the level of HSV-1 gene expression. The top left panel ...
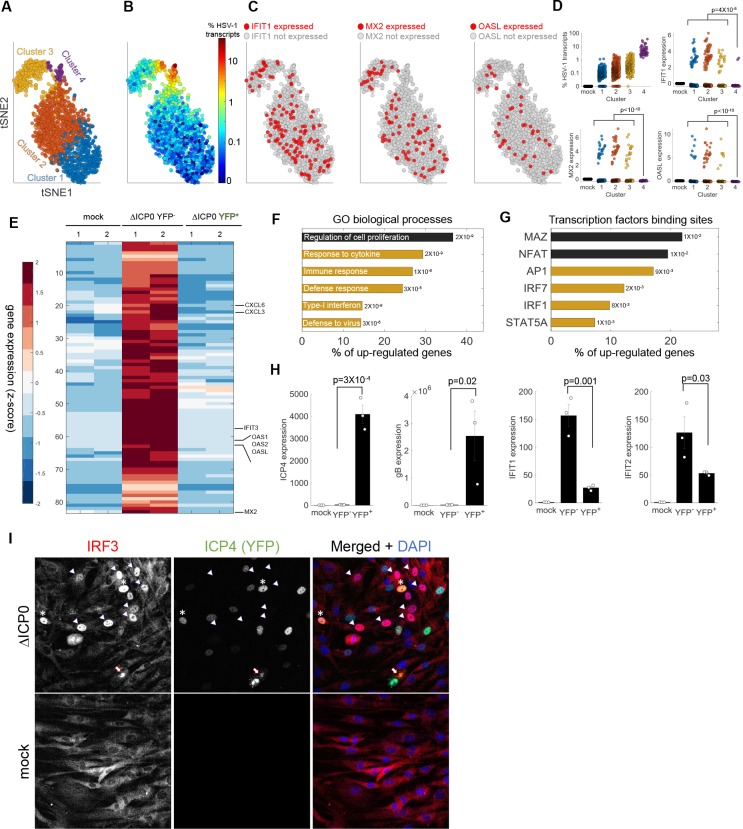
Figure 3.
Anti-viral signaling in cells infected by u0394ICP0 mutant.
( A )u00a0tSNE plot based on viral and host gene expression. Cells are colored according to their clustering. ( B ) tSNE plot as in panelu00a0(A), with cells colored according to the % expressed trans...
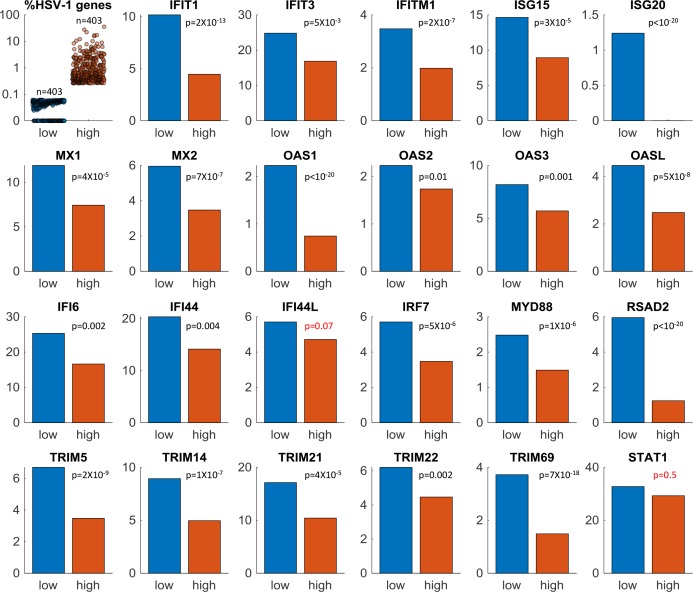
Figure 3u2014figure supplement 1.
ISGs expression in single-cells infected by u0394ICP0 HSV-1.
Here we compare the expression of interferon-stimulated genes) (ISGs) in the top (orange) and bottom (blue) 25% of cells, sorted according to the level of HSV-1 gene expression. The top left panel sho...
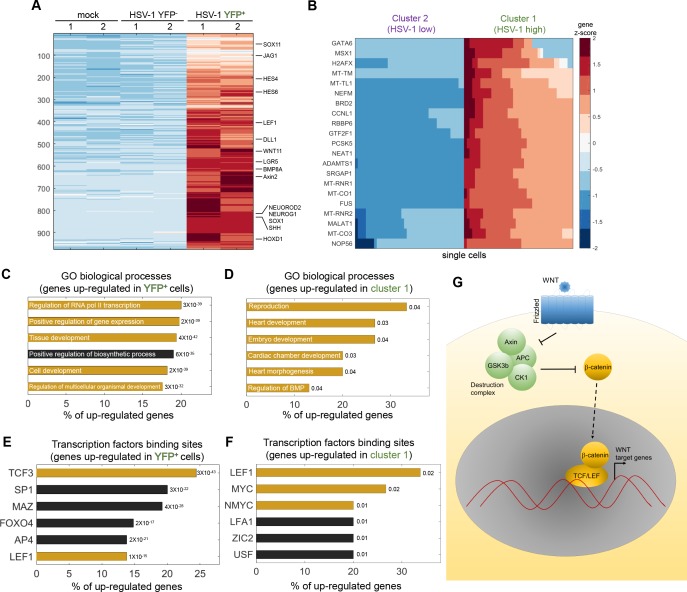
Figure 4.
HSV-1 infection upregulates developmental pathways.
( A )u00a0Heat-map of genes that are significantly upregulated in ICP4 + cells, as compared to both mock-infected and ICP4 u2013 cells. RNA-sequencing was performed in duplicates denoted by the number...
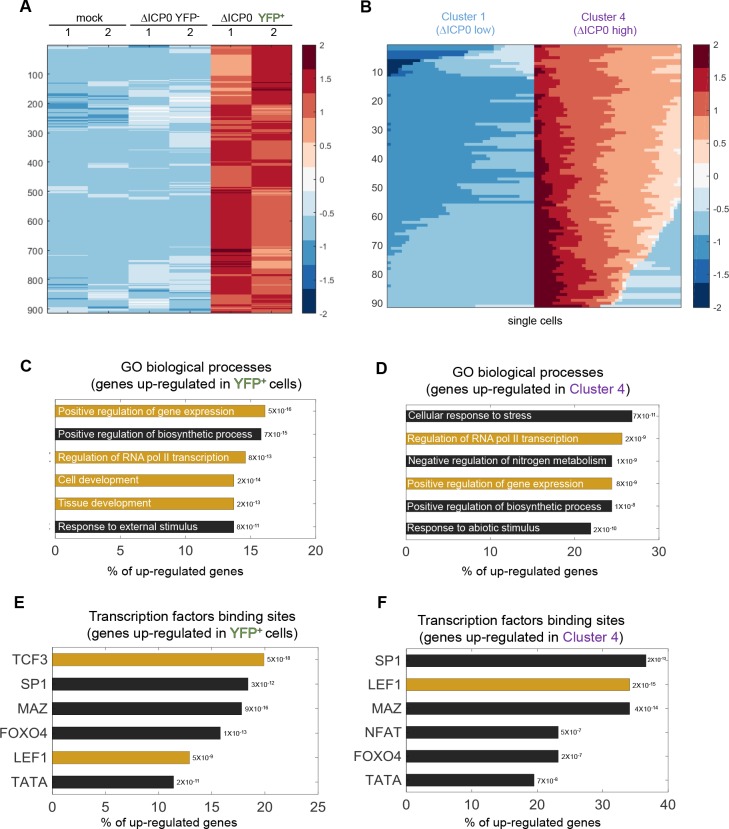
Figure 4u2014figure supplement 1.
u0394ICP0 infection upregulates developmental pathways.
( A )u00a0Heat-map of genes that are significantly upregulated in ICP4 + cells, as compared to both mock-infected and ICP4 u2013 cells. RNA-sequencing was performed in duplicates denoted by the number...
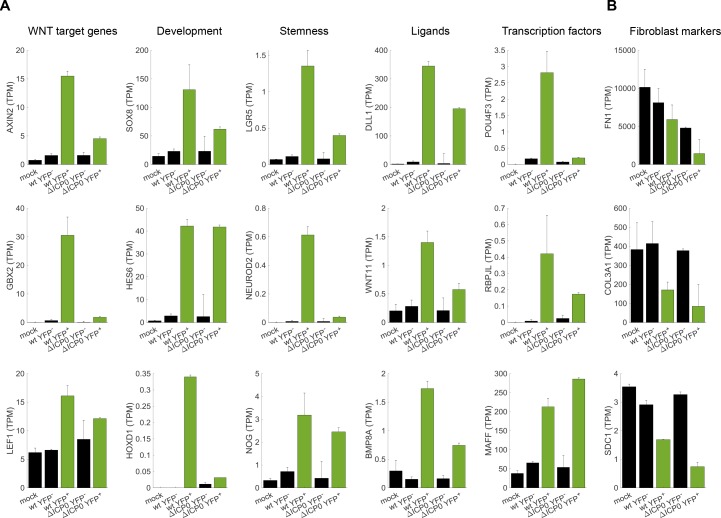
Figure 5.
Cellular reprogramming during HSV-1 infection.
( A ) Bar plots showing the expression level (transcripts per millionu00a0(TPM)) of selected examples of genes that participate in developmental pathways and are upregulated in HSV-1-infected cells. B...
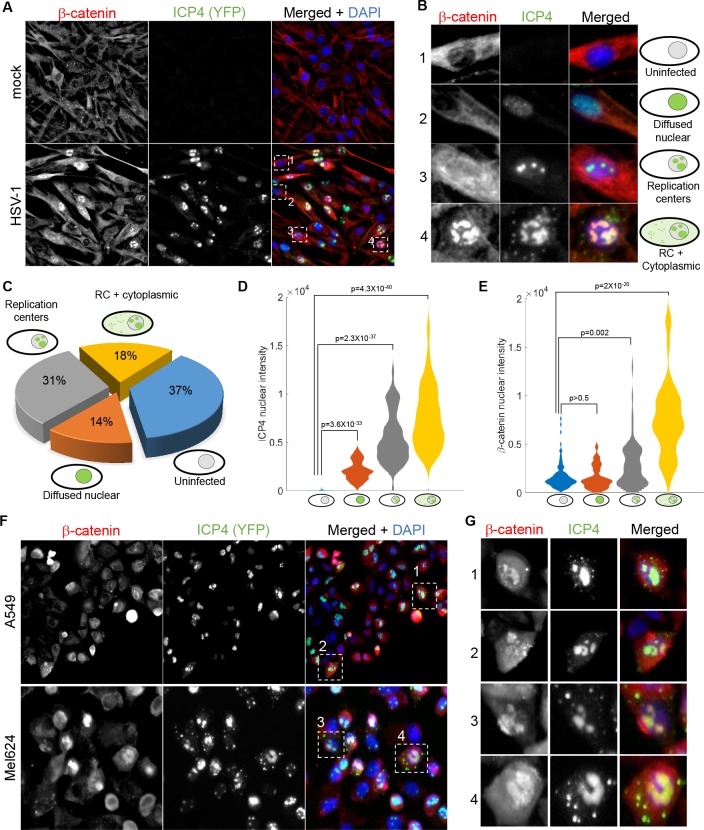
Figure 6.
u03b2-catenin translocates to the nucleus and concentrates in the viral replication compartments.
( A )u00a0Immunoflorescent staining of u03b2-catenin in mock-infected (top) or HSV-1 infected (bottom) HDFn cells at 5 hr post infection. ( B ) Magnified images of the four cells denoted by dashed whi...
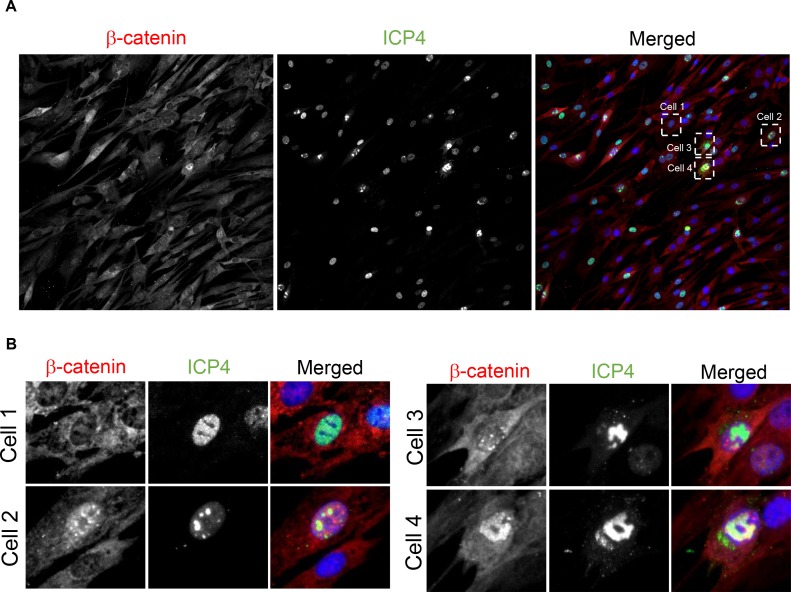
Figure 6u2014figure supplement 1.
u03b2-catenin translocates to the nucleus and concentrates in the viral replication compartments upon u0394ICP0 infection.
( A )u00a0Immunofluorescent staining of u03b2-catenin in u0394ICP0-infected HDFn cells at 5 hr post infection. ( B ) Magnified images of the four cells denoted by dashed white boxes in panel (A), show...
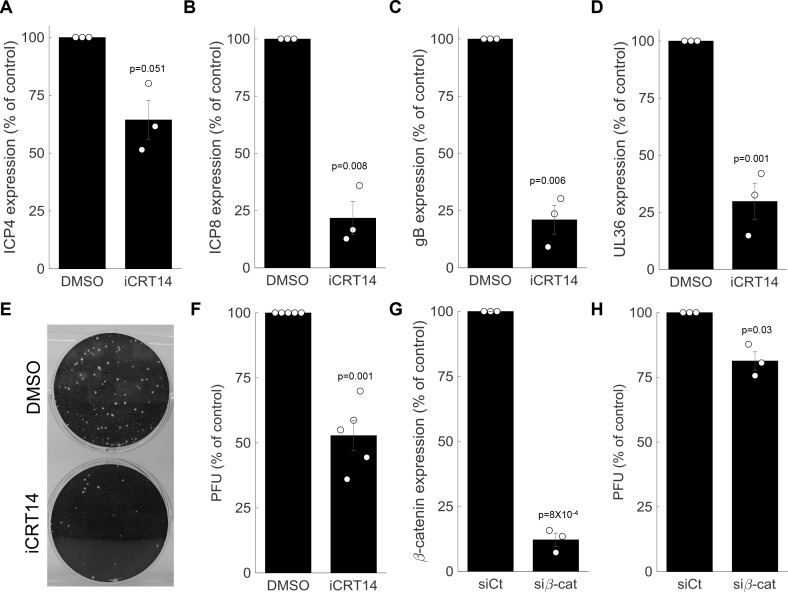
Figure 7.
u03b2-catenin is required for late viral gene expression and progeny production.
( A-D )u00a0HDFn treated with the u03b2-catenin inhibitor iCRT14 or with vehicle alone (dimethyl sulfoxideu00a0(DMSO)) were infected with HSV-1 and analyzed for viral gene expression by RT-PCR at 5 hr...
Figure images are served from the NIH/NLM PubMed Central Open Access Subset or Europe PMC; copyright remains with the publishers and authors.
💬 Discussion
0 commentsNo comments yet. Be the first to start a discussion!
Leave a Comment