Abstract
Functional imaging and gene expression studies both implicate the medial prefrontal cortex (mPFC), particularly deep-layer projection neurons, as a potential locus for autism pathology. Here, we explored how specific deep-layer prefrontal neurons contribute to abnormal physiology and behavior in mouse models of autism. First, we find that across three etiologically distinct models-in utero valproic acid (VPA) exposure, CNTNAP2 knockout and FMR1 knockout-layer 5 subcortically projecting (SC) neurons consistently exhibit reduced input resistance and action potential firing. To explore how altered SC neuron physiology might impact behavior, we took advantage of the fact that in deep layers of the mPFC, dopamine D2 receptors (D2Rs) are mainly expressed by SC neurons, and used D2-Cre mice to label D2R+ neurons for calcium imaging or optogenetics. We found that social exploration preferentially recruits mPFC D2R+ cells, but that this recruitment is attenuated in VPA-exposed mice. Stimulating mPFC D2R+ neurons disrupts normal social interaction. Conversely, inhibiting these cells enhances social behavior in VPA-exposed mice. Importantly, this effect was not reproduced by nonspecifically inhibiting mPFC neurons in VPA-exposed mice, or by inhibiting D2R+ neurons in wild-type mice. These findings suggest that multiple forms of autism may alter the physiology of specific deep-layer prefrontal neurons that project to subcortical targets. Furthermore, a highly overlapping population-prefrontal D2R+ neurons-plays an important role in both normal and abnormal social behavior, such that targeting these cells can elicit potentially therapeutic effects.
🔬 Techniques
💻 Software
✨ Fluorophores
🧪 Sample Preparation
🏭 Microscope Brands
🧪 Reagent Suppliers
💻 Software Details
🏛️ Research Organizations (ROR)
Affiliated research institutions:
📋 Methods
Animals
All experiments were conducted in accordance with procedures established by the Administrative Panels on Laboratory Animal Care at the University of California, San Francisco. Mice were fed ad libitum and reared in normal lighting conditions (12h/12h light/dark cycle). We used the following mouse lines: wild-type C57BL/6 (Simonsen), wild-type CD1 (Simonsen), FVB.129P2-Pde6b+ Tyrc-ch Fmr1 tm1Cgr /J (Jackson), B6.129(Cg)- Cntnap2 tm1Pele /J (Jackson), Drd2-Cre (line ER44; gensat.org ). For Fragile X experiments, knockout animals were compared to wildtype littermates. For CNTNAP2 experiments, knockout animals were compared to heterozygous littermates. We initially used a mating scheme of het het (to produce KO and WT littermate controls), but we had a very low yield of knockout mice. Given the lack of evidence that heterozygous CNTNAP2 mutations are associated with autism 66 , we used a het × KO breeding scheme to produce knockouts with heterozygous littermates as controls. For prenatal VPA exposure experiments, pregnant C57Bl/6 or CD1 mice received a single intraperitoneal (IP) dose of VPA (500 mg/kg) or saline vehicle at embryonic day (E) 10.5 67 . Animals of both sexes were used for all experiments except for the experiments in Fragile X mice and their wildtype littermate controls which used only male mice.
Fluorescent labeling of specific neuron populations
Mice were anesthetized with 2% isoflurane and mounted in a stereotactic frame. Craniotomies were made according to stereotaxic coordinates relative to Bregma. To label interneurons in the mPFC, we injected AAV encoding the Dlxi1/2b enhancer driving mCherry into the ipsilateral mPFC as previously reported 17 . To selectively label subcortical projection (SC) or intratelencephalic (IT) neurons, we injected fluorescently-labeled latex microspheres (Retrobeads, Lumafluor) or fluorescently-labeled cholera toxin subunit B (CTB, Molecular Probes) into contralateral mPFC or ipsilateral MD thalamus. Coordinates for injection into contralateral mPFC were (in millimeters relative to Bregma): +1.7 anterior-posterior (AP), –0.3 mediolateral (ML), and –2.75 dorsoventral (DV). Coordinates for injection into ipsilateral MD thalamus were –1.7 AP, +0.3 ML, and –3.5 DV. We injected 500 nL at 150 nL/min for mPFC and 400 nL at 100 nL/min for MD thalamus. We waited 5 minutes after the end of the injection before slowly withdrawing the syringe. We waited 3–5 days following retrograde tracer injections before performing experiments. At the time of the experiments, we visually verified that retrograde tracer injections were targeted appropriately and that tracer was not present in nearby structures. Slice preparation Mice 8–12 weeks old were deeply anesthetized with isoflurane and then decapitated. We prepared coronal slices 250 μm thick using ice-cold solution containing (in mM): 234 sucrose, 26 NaHCO 3 , 11 glucose, 2.5 KCl, 10 MgSO 4 , 1.25 NaH 2 PO 4 , and 0.5 CaCl 2 . ACSF contained (in mM): 126 NaCl, 26 NaHCO 3 , 14 glucose, 3 KCl, 2 CaCl 2 , 2 MgCl 2 , and 1 NaH 2 PO 4 . Slices were incubated in a warmed 50/50 mixture of ACSF and slicing solution at 30–32°C for 15 minutes and then at least one hour at room temperature before being used for recordings. During experiments, slices were perfused with ACSF and secured by placing a harp along the midline between the two hemispheres.
Show full methods section
Animals
All experiments were conducted in accordance with procedures established by the Administrative Panels on Laboratory Animal Care at the University of California, San Francisco. Mice were fed ad libitum and reared in normal lighting conditions (12h/12h light/dark cycle). We used the following mouse lines: wild-type C57BL/6 (Simonsen), wild-type CD1 (Simonsen), FVB.129P2-Pde6b+ Tyrc-ch Fmr1 tm1Cgr /J (Jackson), B6.129(Cg)- Cntnap2 tm1Pele /J (Jackson), Drd2-Cre (line ER44; gensat.org ). For Fragile X experiments, knockout animals were compared to wildtype littermates. For CNTNAP2 experiments, knockout animals were compared to heterozygous littermates. We initially used a mating scheme of het het (to produce KO and WT littermate controls), but we had a very low yield of knockout mice. Given the lack of evidence that heterozygous CNTNAP2 mutations are associated with autism 66 , we used a het × KO breeding scheme to produce knockouts with heterozygous littermates as controls. For prenatal VPA exposure experiments, pregnant C57Bl/6 or CD1 mice received a single intraperitoneal (IP) dose of VPA (500 mg/kg) or saline vehicle at embryonic day (E) 10.5 67 . Animals of both sexes were used for all experiments except for the experiments in Fragile X mice and their wildtype littermate controls which used only male mice.
Fluorescent labeling of specific neuron populations
Mice were anesthetized with 2% isoflurane and mounted in a stereotactic frame. Craniotomies were made according to stereotaxic coordinates relative to Bregma. To label interneurons in the mPFC, we injected AAV encoding the Dlxi1/2b enhancer driving mCherry into the ipsilateral mPFC as previously reported 17 . To selectively label subcortical projection (SC) or intratelencephalic (IT) neurons, we injected fluorescently-labeled latex microspheres (Retrobeads, Lumafluor) or fluorescently-labeled cholera toxin subunit B (CTB, Molecular Probes) into contralateral mPFC or ipsilateral MD thalamus. Coordinates for injection into contralateral mPFC were (in millimeters relative to Bregma): +1.7 anterior-posterior (AP), –0.3 mediolateral (ML), and –2.75 dorsoventral (DV). Coordinates for injection into ipsilateral MD thalamus were –1.7 AP, +0.3 ML, and –3.5 DV. We injected 500 nL at 150 nL/min for mPFC and 400 nL at 100 nL/min for MD thalamus. We waited 5 minutes after the end of the injection before slowly withdrawing the syringe. We waited 3–5 days following retrograde tracer injections before performing experiments. At the time of the experiments, we visually verified that retrograde tracer injections were targeted appropriately and that tracer was not present in nearby structures. Slice preparation Mice 8–12 weeks old were deeply anesthetized with isoflurane and then decapitated. We prepared coronal slices 250 μm thick using ice-cold solution containing (in mM): 234 sucrose, 26 NaHCO 3 , 11 glucose, 2.5 KCl, 10 MgSO 4 , 1.25 NaH 2 PO 4 , and 0.5 CaCl 2 . ACSF contained (in mM): 126 NaCl, 26 NaHCO 3 , 14 glucose, 3 KCl, 2 CaCl 2 , 2 MgCl 2 , and 1 NaH 2 PO 4 . Slices were incubated in a warmed 50/50 mixture of ACSF and slicing solution at 30–32°C for 15 minutes and then at least one hour at room temperature before being used for recordings. During experiments, slices were perfused with ACSF and secured by placing a harp along the midline between the two hemispheres.
Intracellular recordings
Somatic whole-cell patch recordings were obtained from retrogradely-labeled visually identified neurons in Layer 5 (L5) of infralimbic and prelimbic cortex using differential contrast video microscopy on an upright microscope (BX51WI; Olympus). Layer 2/3 was identified as the first tight band of cells deep to the pial surface. Layer 6 was identified as the tight band of cells superficial to the white matter. Layer 5 was defined as the relatively loosely packed cells between these two bands. Recordings were made using a Multiclamp 700A (Molecular Devices). Patch electrodes (tip resistance = 2–6 MΩ) were filled with the following (in mM): 118 K-gluconate, 10 KCl, 10 HEPES, 4 MgATP, 1 EGTA, and 0.3 Na 3 GTP (pH adjusted to 7.2 with KOH). Slices were continuously perfused with ACSF in an immersion chamber (Warner Instruments) with temperature maintained at 32.5±1°C. Series resistance was usually 10–20 MΩ, and experiments were discontinued above 30 MΩ or if action potentials failed to overshoot 0 mV. We did not correct for liquid junction potential. We measured resting membrane potential in current clamp immediately following whole cell break in. Fast-spiking interneurons were distinguished from other interneuron subtypes based on narrow spike widths (≤ 1 ms), minimal adaptation during sustained firing, steep f/i slopes, and high peak firing rates (typically >100 Hz). We calculated input resistance from the steady-state voltage change measured in response to –50 pA current steps. We calculated membrane time constant as the time at which the membrane voltage decayed to 1/e of the initial value following –50 pA current steps. We calculated membrane capacitance as the membrane time constant divided by input resistance. We estimated H current using the sum of the “sag” and “rebound” in response to –200 pA steps 16 . We quantified action potential firing during one second current steps from 0 to +400 pA in 50 pA intervals. We estimated action potential threshold as the point at which the third derivative of the membrane potential was maximal. Action potential half-width was estimated as the time (in msec) for the membrane potential to rise from the point halfway between the trough and peak to the peak and then fall to the point halfway between the peak and the trough.
Histology
All viruses were obtained from the University of North Carolina (UNC) Vector Core. Mice were stereotactically injected with rAAV5-EF1alpha-DIO-eYFP-WPRE (“DIO-eYFP”, UNC Vector Core) into the right mPFC, 1.5 μL total volume (750 nL at 150 nL/min at +0.30–0.32 / +1.70 / –2.25 plus 750 nL at 150 nL/min at +0.30–0.32 / +1.70 / –2.75). Coordinates are given as mm from Bregma (medial-lateral / anterior-posterior / dorsal-ventral). Fluorescently labeled CTB was injected into either the left mPFC (to label IT cells) or the right MD thalamus (to label SC cells). After 4 days, animals were deeply anesthetized with Euthasol and transcardially perfused with 4% paraformaldehyde. Brains were incubated in 4% PFA overnight and then sliced on a Leica vibratome into coronal sections 100 μm thick. Brain slices were mounted onto glass slides and imaged using a confocal microscope. We counted 100 cells per slice in prelimbic and infralimbic cortices in the area that had the maximum overlap between eYFP and the fluorescently labeled CTB. In vivo calcium imaging (fiber photometry) To express genetically-encoded calcium indicators in Drd1::Cre and Drd2::Cre mice, 500 nL of AAV viral vector carrying GCaMP6s or GCaMP6f were infused unilaterally into the right mPFC (anterior-posterior (AP): +1.7 mm, mediolateral (ML): +0.3 mm) at four different depths at 125 nL/location (dorsoventral (DV): –2.0 mm; –2.25; –2.50 mm; –2.75 mm) at a rate of 100 nL/min. Fiber optic cannulas with zirconia sheaths (400 μm diameter, 0.48 NA; Doric Lenses, Quebec City, Canada) were implanted over the mPFC (AP: +1.7 mm; ML: +0.3 mm; DV: –2.5 mm). We waited 4–6 weeks before starting experiments. The fiber photometry system was set up as previously reported 35 . The light from a 473 nm diode laser (Omicron) was chopped at 400 Hz and reflected off a dichroic (Semrock, FF495). It was then coupled into a 400 μm optical fiber (Thorlabs). The patchcord was attached to the implanted optical fibers, and GCaMP6 fluorescence was collected and focused through a bandpass filter (Semrock) onto a femtowatt silicon photoreceiver (Newport). The output was directed through a lock-in amplifier (Stanford Research Systems), digitized (LabJack), and recorded on a PC. Signals were collected at a sampling rate of 500 Hz. To estimate the relative light intensity transmitted from the fiber tip centered in L5 to the neurons in Layer 2/3, we estimated the light intensity at a point 100 μm deep and 100 μm lateral to the fiber tip. We used the ScatterBrain matlab app 68 . Using this method, the relative light intensity was 0.0016 using the following parameters: Fiber radius: 100 μm; Fiber numerical aperture: 0.22; Tissue scattering coefficient: 211 cm −1 ; absorption coefficient: 0.6 cm −1 ; anisotropy index: 0.86; refraction index: 1.36. Data were aligned so the first sniff took place at time = 0 seconds. Peak ΔF/F 0 was calculated as the maximum of the calcium response following the first sniff. We estimated the plateau as the mean ΔF/F 0 at t = +60 seconds averaged over a 20 second window. Please note that in the photometry experiments presented in Fig. 3 , the exploration epochs each lasted 3 minutes (in contrast to the photometry experiments presented in Fig. 4 and the optogenetics experiments presented in Fig. 5 in which exploration epochs lasted 5 minutes). In vivo optogenetic manipulations To express halorhodopsin (eNpHR) or channelrhodopsin (ChR2) in D2R-expressing neurons, we stereotactically injected rAAV5-EF1α-DIO-eNpHR3.0-mCherry-WPRE or rAAV5-Ef1α-DIO-hChR2(H134R)-eYFP into the mPFC of Drd2-Cre mice. In control experiments in which no virus was expressed, we injected virus encoding Cre-dependent eNpHR into Drd2-Cre negative mice. To express halorhodopsin nonspecifically throughout the mPFC, we stereotactically injected rAAV5-hSyn-eNpHR3.0-mCherry-WPRE in mPFC of Drd2-Cre negative mice. Virus encoding eNpHR was injected bilaterally at (in millimeters relative to Bregma) +1.7 AP, +0.32–0.35 and –0.32–0.35 ML, with 750 nL injected at –2.25 DV and 750 nL at –2.75 DV. In VPA mice, virus encoding ChR2 (1000 nL) was injected bilaterally at +1.7 AP, +0.32–0.35 and –0.32–0.35 ML, –2.25 DV. In non-VPA-exposed controls, 750 nL virus encoding ChR2 was injected into right mPFC (AP: +1.7 mm; ML: +0.3 mm; DV: –2.75 mm). In all cases, immediately following viral injections, fiber optic cannulas (Doric Lenses, Québec City) were implanted over the injected areas with the tips at –2.25 DV. Cannulas were silica multimode optical fibers with a flat tip, 0.22 numerical aperture, a 200 μm core, 240 μm outer diameter, with an outer layer of yellow polyamide buffer. Cannulas were affixed to the skull using Metabond dental cement (C&B). Following behavioral assays, we sacrificed mice and verified that virus expression and the fiber optic tips were localized within the mPFC. To activate halorhodopsin (eNpHR), continuous green (532 nm) laser light was directed through the bilateral fiber optic at 10 mW total power (5 mW in each hemisphere). In VPA mice, channelrhodopsin (ChR2) was activated in bilateral mPFC using blue (473 nm) laser light in 5 ms square pulses at 10 Hz with total bilateral light power of 0.6 mW (0.3 mW in each hemisphere). In non-VPA-exposed controls, ChR2 was activated using 473 nm laser light in 5 ms square pulses at 10 Hz with a total unilateral light power of 2 mW.
Behavioral assays
Audio and video were recorded for offline analysis. For optogenetic experiments, animals performed the task two times, one week apart. Animals were randomized to receive light on or off during the first week and the opposite during the second week. We made within-animal comparisons between the two trials. Animals were allowed to habituate to the fiber attached to their head for 10 minutes in their home cage prior to starting the trial. The laser was turned on and 60 seconds later a juvenile (3–4 week old) mouse of the same strain and sex was introduced to the home cage. After 5 minutes, the juvenile was removed from the home cage and the laser turned off. After a 5 minute break, the laser was turned on again. After 60 seconds of light on, a novel object (typically a plastic test tube cap) was introduced into the home cage for five minutes. We scored videos offline, blind to genotype and condition (light on or off). We measured the number of seconds the mouse spent with its nose in direct contact with the novel object or juvenile in the 180 seconds following the time the juvenile or object was introduced into the cage. In addition, we noted any aggressive-appearing behaviors toward the juvenile, freezing, and grooming behaviors. One cohort of VPA and saline mice was eliminated from analysis for aggressive behavior toward the juvenile mice. Otherwise, there were no other significant behaviors noted.
Statistical analyses
We used the “sampsizepwr” function in MATLAB to calculate sample sizes based on preliminary data. For electrophysiology experiments, we estimated that between autism models and controls, to detect a difference in action potential firing of 25% with a standard deviation of 10 Hz, given alpha of 0.05 and power of 0.8, we required 10 cells. For photometry experiments, we estimated that between VPA mice and controls, to detect a 50% change in plateau florescence with a standard deviation of 60%, given alpha of 0.05 and power of 0.8, that we would require 12 trials in each group. For behavior / optogenetics experiments, we estimated that between light on and light off conditions, to detect a difference of 20 seconds with a standard deviation of 20 seconds, given alpha of 0.05 and power of 0.8, we required 10 animals. We therefore tested ≥10 animals in each group. Of note, our sample sizes are similar to those reported previously 16 , 35 . For all data analyses, we used GraphPad Prism software and custom code written in matlab. We first measured if the data were normally distributed. If they passed the D’Agostino & Pearson normality test, we used parametric statistics (Welch’s t test, which does not assume equal standard deviations). If data did not pass the normality test, we used non-parametric measurements (e.g. Mann-Whitney test). All statistics were two-tailed. Using GraphPad QuickCalcs, we performed a Grubbs’ test (extreme studentized deviate test) to detect if our data sets included outliers. Based on this method, none of the data sets contained significant outliers. We considered p values < 0.05 to be significant. In all figures, error bars represent ±1 standard error of the mean and * p
📊 Figures
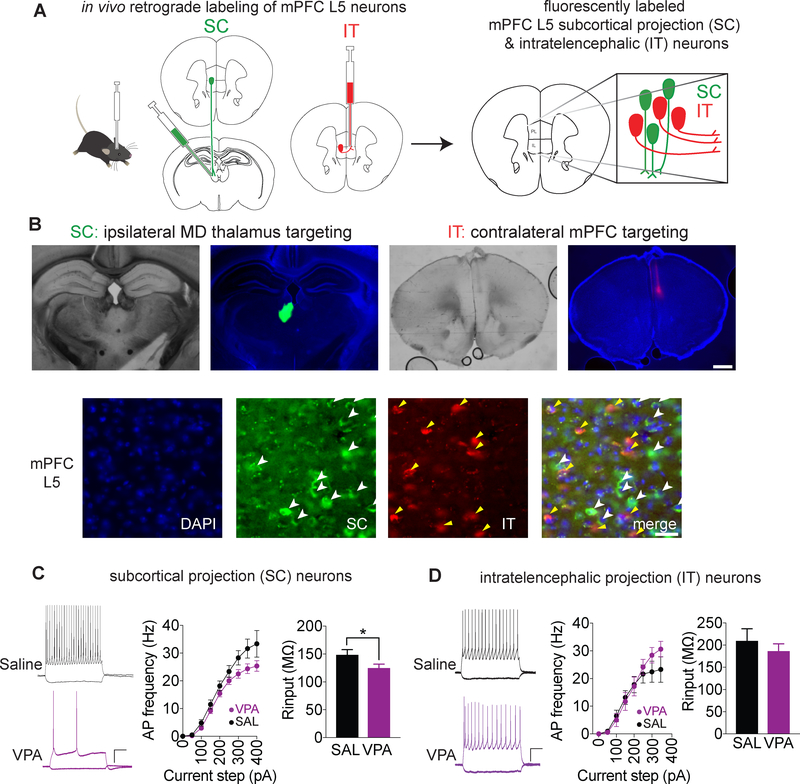
Figure 1.
Prenatal VPA exposure causes deficits in the excitability of mPFC L5 subcortical projection (SC) pyramidal neurons.
A. Retrograde labeling of mPFC L5 SC cells by injection of CTB in ipsilateral mediodorsal (MD) thalamus and labeling of mPFC L5 intratelencephalic projection (IT) neurons by injection of CTB in contra...
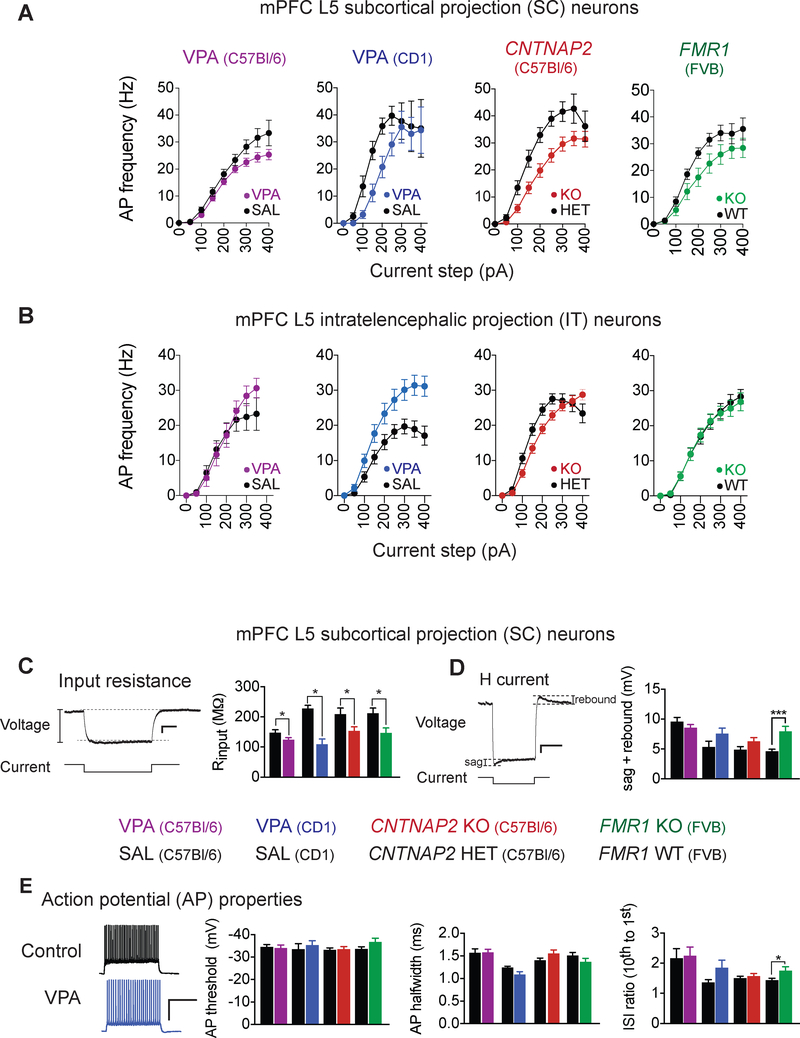
Figure 2.
Prenatal VPA exposure, FMR1 KO, and CNTNAP2 KO all cause a deficit in the excitability of mPFC L5 subcortical projection (SC) pyramidal neurons, which is associated with decreased input resistance.
A. In mPFC L5 SC neurons, action potential (AP) frequency in response to current injection in autism models (colored circles) compared to controls (black). Background strains are shown in parentheses....
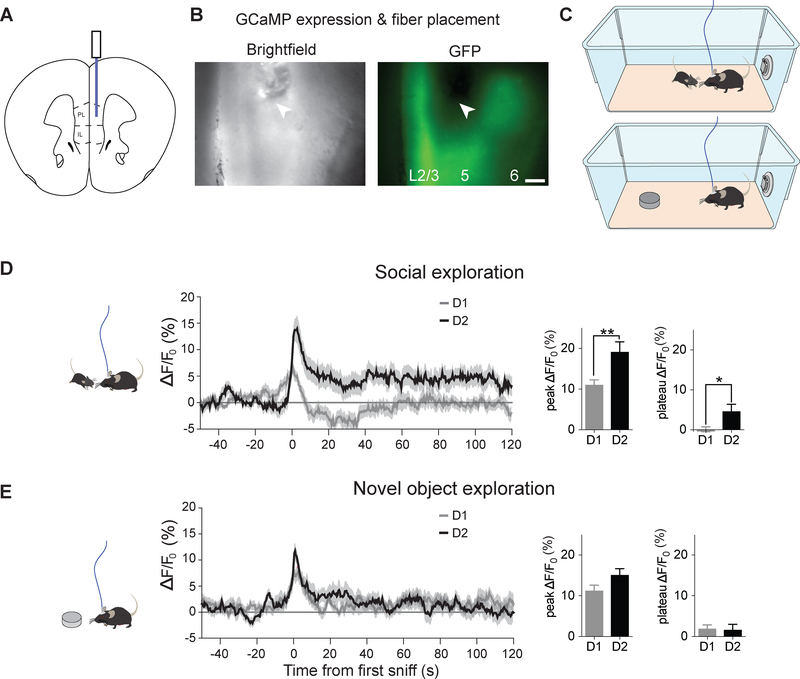
Figure 3.
mPFC D2R+ neurons are persistently activated during social exploration.
Fluorescence in D2R and D1R expressing cells expressing GCaMP6s during social and novel object exploration in wildtype mice. A. Fiber optic implant location for imaging. B. Photomicrograph of fiber ti...
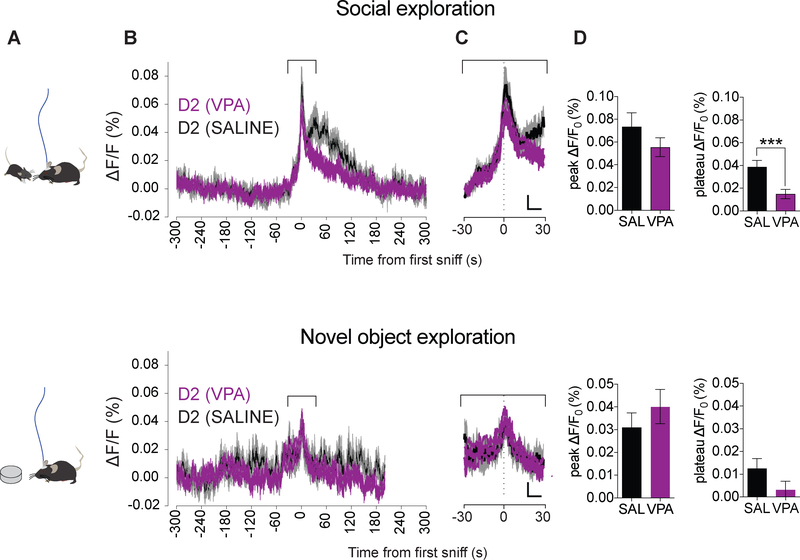
Figure 4.
In VPA mice, mPFC D2R-expressing cells are abnormally activated during social exploration.
mPFC D2R-GCaMP6f fiber photometry during social (top) or novel object (bottom) exploration in C57Bl/6 VPA mice (purple) or saline controls (black). A . Experimental paradigm. B . Average GCaMP6f fluor...
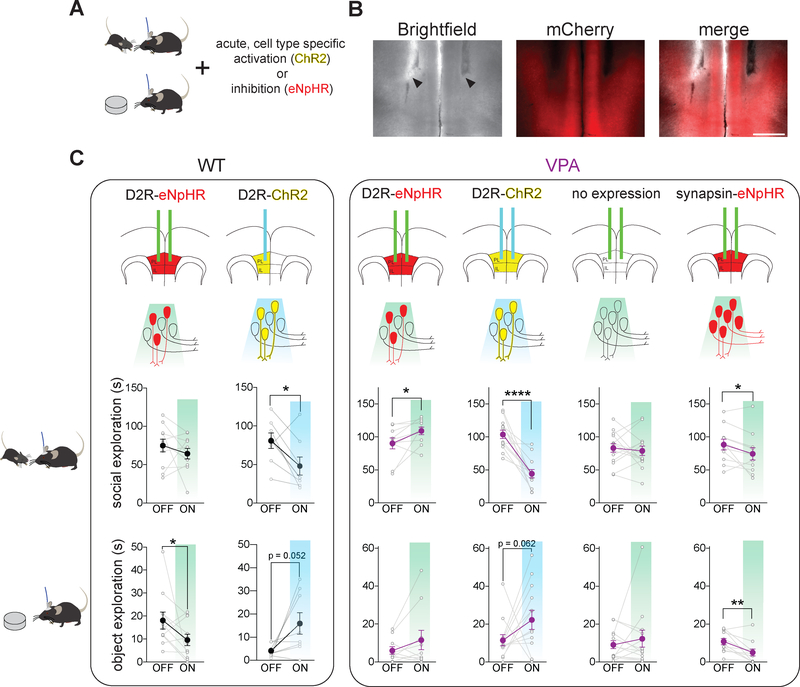
Figure 5.
Acute optogenetic manipulation of D2R-expressing neurons in the mPFC bidirectionally modulates social exploration behavior in VPA mice.
A. Home cage social and novel object exploration assay coupled with acute optogenetic activation (ChR2) or inactivation (eNpHR) of specific neuronal populations. B. Photomicrograph of fiber tip locati...
Figure images are served from the NIH/NLM PubMed Central Open Access Subset or Europe PMC; copyright remains with the publishers and authors.
💬 Discussion
0 commentsNo comments yet. Be the first to start a discussion!
Leave a Comment