Abstract
Total internal reflection fluorescence microscopy has been applied to image the final stage of constitutive exocytosis, which is the fusion of single post-Golgi carriers with the plasma membrane. The use of a membrane protein tagged with green fluorescent protein allowed the kinetics of fusion to be followed with a time resolution of 30 frames/s. Quantitative analysis allowed carriers undergoing fusion to be easily distinguished from carriers moving perpendicularly to the plasma membrane. The flattening of the carriers into the plasma membrane is seen as a simultaneous rise in the total, peak, and width of the fluorescence intensity. The duration of this flattening process depends on the size of the carriers, distinguishing small spherical from large tubular carriers. The spread of the membrane protein into the plasma membrane upon fusion is diffusive. Mapping many fusion sites of a single cell reveals that there are no preferred sites for constitutive exocytosis in this system.
🔬 Techniques
✨ Fluorophores
🧪 Sample Preparation
🏭 Microscope Brands
🧪 Reagent Suppliers
📷 Detectors
🔎 Objectives
🎨 Filters
💻 Software Details
🏛️ Research Organizations (ROR)
Affiliated research institutions:
📋 Methods
TIR-FM Setup
The prismless TIR-FM was used as described previously ( Axelrod 1989 ). It consists of an inverted epifluorescence microscope (model IX-70; Olympus America Inc.) equipped with a high numerical aperture lens (Apo 100X NA 1.65, Olympus). To align the TIR-FM, the widened and collimated beam from an argon ion laser (model 543-AP A01; Omnichrome) was attenuated with neutral density filters, cropped by a diaphragm, and reflected off two mirrors to the dichroic mirror of the microscope. A convex lens (f = 20 cm) in the beam path was used to focus the laser beam onto the back focal plane of the objective. Two mirrors were tilted to change the incident angle of the laser beam onto the TIR interface.
Estimation of the Evanescent Field Decay Length
A right angle prism (hypotenuse facing up) was coupled with immersion liquid ( n = 1.78) onto the sample side of the coverslip. Since the refractive index of the prism ( n = 1.55) is too high, relative to the coverslip, to enable TIR at this incident angle, the laser beam propagated through the prism onto a vertical screen beside the setup. The incident angle was determined by applying Snell's law, and the decay length was calculated from the incident angle ( Axelrod 1989 ). The incident angles used in our experiments were estimated to range between 63° and 54°, which is significantly above the critical angle of 51°, and results in an evanescent field with a decay length between 90 and 50 nm.
Tissue Culture and Transfection COS-1 cells
(African green monkey; American Type Culture Collection) were maintained in DME (Sigma Chemical Co.) with 10% FBS at 37°C in a 5% CO 2 incubator. Cells were plated on acetone-cleaned coverslips, which had a refractive index of 1.78 (Olympus America Inc.), and had been coated with fibronectin (Life Technologies) to promote cell adherence. Cells were transiently transfected with the plasmid VSVG-GFP ts045 ( Presley et al. 1997 ) using FuGENE™ 6 (Boehringer Mannheim) according to the manufacturer's protocol. At 12 h after transfection, cells were shifted from 37° to 40°C for 36 h to accumulate the VSVG-GFP in the ER. Cells were imaged in modified MEM without phenol red (Sigma Chemical Co.) with 10% FBS at 33–35°C. The temperature was maintained by a homebuilt incubator consisting of a thermally insulating hood covering the whole microscope and an air-stream incubator (Air Therm; World Precision Instruments), which is similar to the setup described in Inouye and Spring 1997 .
Show full methods section
TIR-FM Setup
The prismless TIR-FM was used as described previously ( Axelrod 1989 ). It consists of an inverted epifluorescence microscope (model IX-70; Olympus America Inc.) equipped with a high numerical aperture lens (Apo 100X NA 1.65, Olympus). To align the TIR-FM, the widened and collimated beam from an argon ion laser (model 543-AP A01; Omnichrome) was attenuated with neutral density filters, cropped by a diaphragm, and reflected off two mirrors to the dichroic mirror of the microscope. A convex lens (f = 20 cm) in the beam path was used to focus the laser beam onto the back focal plane of the objective. Two mirrors were tilted to change the incident angle of the laser beam onto the TIR interface.
Estimation of the Evanescent Field Decay Length
A right angle prism (hypotenuse facing up) was coupled with immersion liquid ( n = 1.78) onto the sample side of the coverslip. Since the refractive index of the prism ( n = 1.55) is too high, relative to the coverslip, to enable TIR at this incident angle, the laser beam propagated through the prism onto a vertical screen beside the setup. The incident angle was determined by applying Snell's law, and the decay length was calculated from the incident angle ( Axelrod 1989 ). The incident angles used in our experiments were estimated to range between 63° and 54°, which is significantly above the critical angle of 51°, and results in an evanescent field with a decay length between 90 and 50 nm.
Tissue Culture and Transfection COS-1 cells
(African green monkey; American Type Culture Collection) were maintained in DME (Sigma Chemical Co.) with 10% FBS at 37°C in a 5% CO 2 incubator. Cells were plated on acetone-cleaned coverslips, which had a refractive index of 1.78 (Olympus America Inc.), and had been coated with fibronectin (Life Technologies) to promote cell adherence. Cells were transiently transfected with the plasmid VSVG-GFP ts045 ( Presley et al. 1997 ) using FuGENE™ 6 (Boehringer Mannheim) according to the manufacturer's protocol. At 12 h after transfection, cells were shifted from 37° to 40°C for 36 h to accumulate the VSVG-GFP in the ER. Cells were imaged in modified MEM without phenol red (Sigma Chemical Co.) with 10% FBS at 33–35°C. The temperature was maintained by a homebuilt incubator consisting of a thermally insulating hood covering the whole microscope and an air-stream incubator (Air Therm; World Precision Instruments), which is similar to the setup described in Inouye and Spring 1997 .
Image Acquisition and Analysis
Samples were excited with the 488-nm line of an argon laser. The dichroic mirror (D460/40×) and the emission band pass filter (model HQ525/50M; Chroma Technologies Corp.) were used. Images were acquired with a 12-bit–cooled CCD (Orca I, model C4742-95; Hamamatsu) with a pixel size of 6.7 μm × 6.7 μm, an image acquisition card (NI-IMAQ 1424), and controlled by in-house software written in LABVIEW™5.1 using the IMAQ Vision package (all three from National Instruments). The maximum speed of image acquisition was either 30 frames/s (4 × 4 binning) or 18 frames/s (2 × 2 binning). Images containing a region of interest of the cell were streamed to memory on a PC during acquisition and saved to a disk. Image analysis to obtain the total intensity, the peak intensity, and the width of the carrier was performed with in-house software written in LABVIEW™5.1 using the IMAQ Vision package. For analysis of single fusion events, each acquired sequence (1,000–2,000 frames) was reviewed multiple times on screen at various settings of the intensity look-up table to pick out all visible events. The coordinates for each fusion event were determined by identifying the local maximum of fluorescence intensity. Only a small region of interest around each fusion site was used for further analysis. These were selected such that they were both large enough to yield a good Gaussian fit of the carrier fluorescence, and small enough to prevent the influence of other fluorescent particles on the analysis. All fusion sequences were analyzed in the following manner. The center of mass of the carrier was tracked for the entire sequence. The radial intensity distribution I(r) of the carriers was fit for each frame with a nonlinear Levenberg-Marquardt routine to the Gaussian: I(r) = I 0 exp( − r 2 /w 2 ) + BG , where r is the distance of each pixel to the center of mass. The fitting parameters are I 0 , w , and BG , where I 0 is the peak intensity, BG is the background intensity, and w is the measure of the width (the Gauss width). The total intensity of the vesicle was computed by integrating the background-subtracted intensity over the entire region of interest. The fusion start was defined as the frame at which the second derivative of the smoothed total intensity was maximal. The rise time of the total intensity was the time difference between the fusion start and the frame where the smoothed total intensity reached its maximum within 5%. The diffusion constant was calculated by taking the carrier at the fusion start to be an instantaneous point source for diffusive material (Crank, 1995). The intensity profile as a function of time is given by: documentclass[10pt]{article} usepackage{amsmath} usepackage{wasysym} usepackage{amsfonts} usepackage{amssymb} usepackage{amsbsy} usepackage{mathrsfs} usepackage{pmc} usepackage[Euler]{upgreek} pagestyle{empty}
oddsidemargin -1.0in
begin{document} begin{equation*}{mathit{I}} left left(r,tright) right =frac{{mathit{I}}_{0}}{4{mathrm{{pi}}}{mathit{Dt}}}{mathrm{exp}} left left(-frac{{mathit{r}}^{2}}{4{mathit{Dt}}}right) right {mathrm{.}}end{equation*}end{document} The square of the width of this Gaussian, 4Dt , is linear over time t , with the slope proportional to the diffusion constant D.
Calculation of the Ratio
TI flat /TI spherical The total fluorescence intensities for a flattened ( TI flat ) and spherical ( TI spherical ) vesicle are directly proportional to the excitation intensity of the evanescent field I(z) , which decays exponentially from the coverslip into the cell: I(z) = I 0 exp ( − z/d) . Here, z is the distance from the coverslip, I 0 is the intensity in the plane at z = 0, and d is the decay length of the evanescent field. The total intensities for the flat and spherical configurations are calculated by integrating the excitation field I(z) over a circular disk and sphere, respectively: documentclass[10pt]{article} usepackage{amsmath} usepackage{wasysym} usepackage{amsfonts} usepackage{amssymb} usepackage{amsbsy} usepackage{mathrsfs} usepackage{pmc} usepackage[Euler]{upgreek} pagestyle{empty}
oddsidemargin -1.0in
begin{document} begin{equation*}{mathit{TI}}_{flat}={mathit{cI}}_{0} left left(4{mathrm{{pi}}}{mathit{R}}^{2}right) right {mathit{TI}}_{spherical}={mathit{c}}2{mathrm{{pi}}}{mathit{R}}{int _{0}^{2{mathit{R}}}}dz{mathit{I}}_{0}{mathrm{exp}} left left(-{{mathit{z}}}/{{mathrm{d}}}right) right {mathrm{,}}end{equation*}end{document} where R is the radius of the vesicle. The constant c depends on the quantum yield and extinction coefficient of the fluorophore and the collection efficiency of the lens. After evaluating the integral and taking the ratio we find the following: documentclass[10pt]{article} usepackage{amsmath} usepackage{wasysym} usepackage{amsfonts} usepackage{amssymb} usepackage{amsbsy} usepackage{mathrsfs} usepackage{pmc} usepackage[Euler]{upgreek} pagestyle{empty}
oddsidemargin -1.0in
begin{document} begin{equation*}frac{{mathit{TI}}_{flat}}{{mathit{TI}}_{spherical}}=frac{2{mathit{R}}}{{mathit{d}}}frac{1}{1-{mathrm{exp}} left left(-{ left 2{mathit{R}}right) right }/{{mathit{d}}}right) right }{mathrm{.}}end{equation*}end{document} Thresholded Image of VSVG-GFP in the Plasma Membrane The highly thresholded image shown in Fig. 5 was created by averaging the first frame of each image sequence ( n = 30), followed by subsequent nearest neighbor averaging (with all eight neighbors). The threshold was chosen to show bits between 1 (black) and 5 (bright gray) on a 256-bit scale. Online Supplemental Material Description of Supplementary Figures: Both plots are supplementary information to the data shown in Table . For detailed description of the parameters used see Materials and Methods. All supplementary materials are available at http://www.jcb.org/cgi/content/full/149/1/23/DC1. Figure 1. Total delivered intensity over the rise time. The total fluorescence intensity (maximum intensity reached shortly after fusion start) delivered by 45 carriers, which fused with the plasma membrane, is plotted as a function of their rise time (the time in which the carriers are flattening down into the plasma membrane while delivering all their membrane cargo). The linear fit to the data (shown in red) suggests that a longer rise time is directly correlated to a larger membrane cargo. Figure 2. Total delivered intensity over the intensity of the carrier before fusion. The total fluorescence intensity (maximum intensity reached shortly after fusion start) delivered by 45 carriers, which fused with the plasma membrane, is plotted as a function of the fluorescence intensity just before fusion. The linear fit to the data (shown in red) suggests that these carriers with a smaller initial fluorescence seem to deliver less total membrane cargo. Description of Supplementary Video Material. All video sequences show post-Golgi carriers in COS-1 cells transfected with ts 045 VSVG-GFP as a constitutively secreted membrane protein. The sequences are taken ∼ 30–50 min after the release of the temperature block in the ER in TIR-FM. Video 1: View of Many Carriers. The sequence, taken at 30 frames/s, shows a part of the cell surface imaged in TIR-FM. The cell edge is in the upper left, the Golgi is in the lower right corner (pixel size, 256 nm). There are three types of behaviors of the post-Golgi carriers: (1) carriers that are stationary; (2) carriers that are moving, but not fusing; and (3) carriers that fuse to the plasma membrane. As can be seen on the extreme left and right, fusion occurs with a bright local burst of fluorescence followed by a spread of the fluorescence. The carrier on the extreme left was observed doing transport, docking, and fusion during the acquisition time. The two carriers on the extreme right did not move significantly before they fused. Video 2: Small Carrier Fusion. This sequence ( Fig. 2b and Fig. c ), taken at 30 frames/s, shows a highly enlarged region of interest containing a small dotlike carrier (pixel size, 256 nm) undergoing fusion with the plasma membrane. The fusion can be seen as a local increase followed by a spread of the fluorescence intensity due to diffusion of the VSVG-GFP in the plasma membrane. Video 3: Large Tubular Carrier Fusion. This sequence (10 frames/s; pixel size, 134 nm) shows an enlarged region of interest containing a large tubular carrier undergoing transport, docking, and fusion (see selected frames in Fig. 3 and quantification in Fig. 4 A). During the transport, the intensity of the tubule is changing slightly, which is probably due to movement in the vertical direction, in and out of the evanescent field. Just before fusion the tubule seems to round up to a dot. Fusion occurs with a huge burst of fluorescence followed by a spread of the fluorescence.
Online Supplemental Material Description of Supplementary Figures: Both plots are supplementary information to the data shown in Table . For detailed description of the parameters used see Materials and Methods. All supplementary materials are available at http://www.jcb.org/cgi/content/full/149/1/23/DC1. Figure 1. Total delivered intensity over the rise time. The total fluorescence intensity (maximum intensity reached shortly after fusion start) delivered by 45 carriers, which fused with the plasma membrane, is plotted as a function of their rise time (the time in which the carriers are flattening down into the plasma membrane while delivering all their membrane cargo). The linear fit to the data (shown in red) suggests that a longer rise time is directly correlated to a larger membrane cargo. Figure 2. Total delivered intensity over the intensity of the carrier before fusion. The total fluorescence intensity (maximum intensity reached shortly after fusion start) delivered by 45 carriers, which fused with the plasma membrane, is plotted as a function of the fluorescence intensity just before fusion. The linear fit to the data (shown in red) suggests that these carriers with a smaller initial fluorescence seem to deliver less total membrane cargo. Description of Supplementary Video Material. All video sequences show post-Golgi carriers in COS-1 cells transfected with ts 045 VSVG-GFP as a constitutively secreted membrane protein. The sequences are taken ∼ 30–50 min after the release of the temperature block in the ER in TIR-FM. Video 1: View of Many Carriers. The sequence, taken at 30 frames/s, shows a part of the cell surface imaged in TIR-FM. The cell edge is in the upper left, the Golgi is in the lower right corner (pixel size, 256 nm). There are three types of behaviors of the post-Golgi carriers: (1) carriers that are stationary; (2) carriers that are moving, but not fusing; and (3) carriers that fuse to the plasma membrane. As can be seen on the extreme left and right, fusion occurs with a bright local burst of fluorescence followed by a spread of the fluorescence. The carrier on the extreme left was observed doing transport, docking, and fusion during the acquisition time. The two carriers on the extreme right did not move significantly before they fused. Video 2: Small Carrier Fusion. This sequence ( Fig. 2b and Fig. c ), taken at 30 frames/s, shows a highly enlarged region of interest containing a small dotlike carrier (pixel size, 256 nm) undergoing fusion with the plasma membrane. The fusion can be seen as a local increase followed by a spread of the fluorescence intensity due to diffusion of the VSVG-GFP in the plasma membrane. Video 3: Large Tubular Carrier Fusion. This sequence (10 frames/s; pixel size, 134 nm) shows an enlarged region of interest containing a large tubular carrier undergoing transport, docking, and fusion (see selected frames in Fig. 3 and quantification in Fig. 4 A). During the transport, the intensity of the tubule is changing slightly, which is probably due to movement in the vertical direction, in and out of the evanescent field. Just before fusion the tubule seems to round up to a dot. Fusion occurs with a huge burst of fluorescence followed by a spread of the fluorescence.
Description of Supplementary Video Material. All video sequences show post-Golgi carriers in COS-1 cells transfected with ts 045 VSVG-GFP as a constitutively secreted membrane protein. The sequences are taken ∼ 30–50 min after the release of the temperature block in the ER in TIR-FM.
📊 Figures
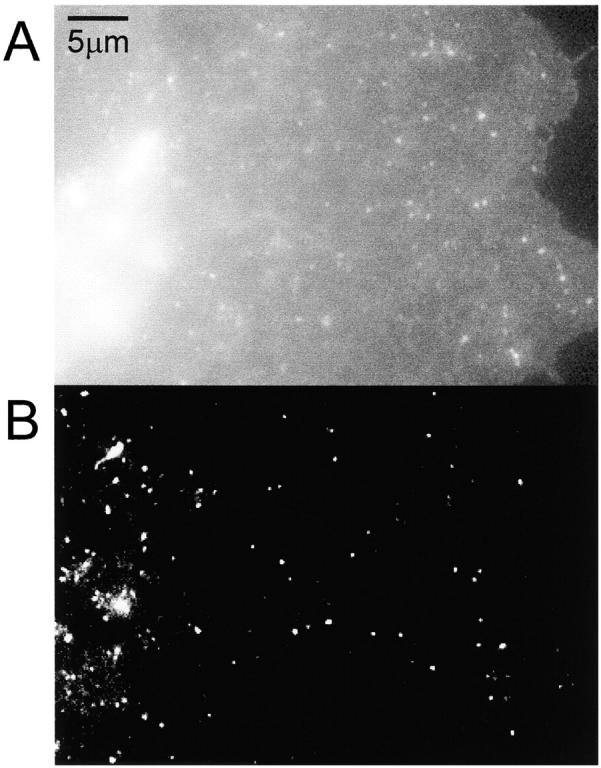
Figure 1
Comparison of epi- and TIR illumination. A COS cell transfected with VSVG-GFP was imaged using (A) epi- and (B) TIR illumination.
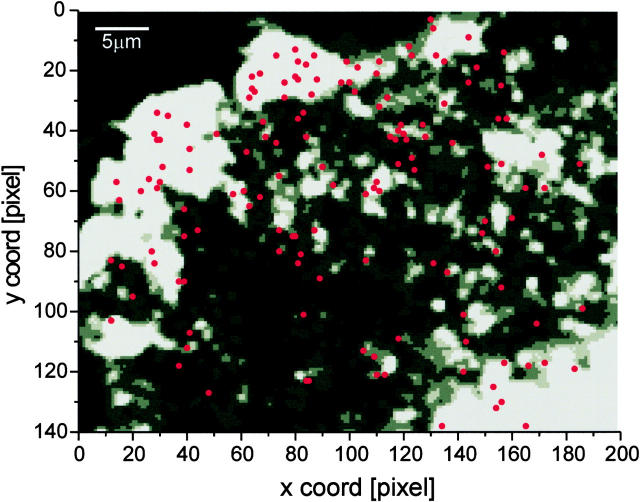
Figure 5
Map of fusion sites of a single cell. The exocytotic events ( n = 147) from a single cell were superimposed as red dots onto a thresholded gray scale image of VSVG-GFP in the plasma membrane (see Mate...
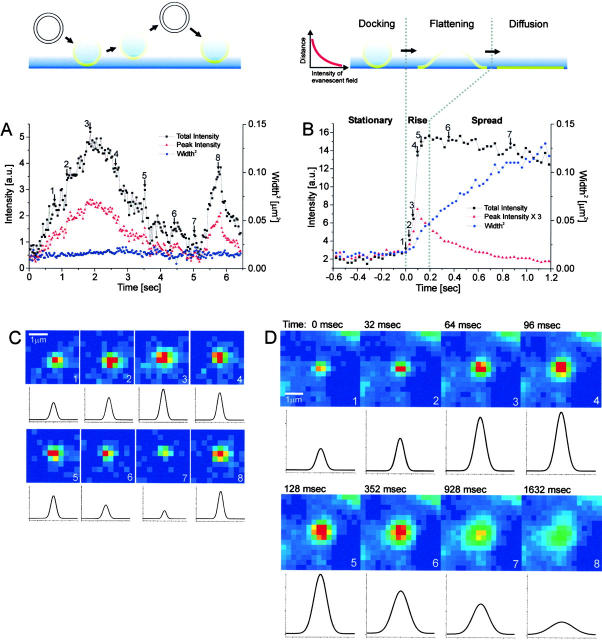
Figure 2
Analysis of carriers. The VSVG-GFP fluorescence was imaged for carriers close to the plasma membrane. Selected frames are shown from a sequence in (C) for a carrier which moved perpendicular to the co...
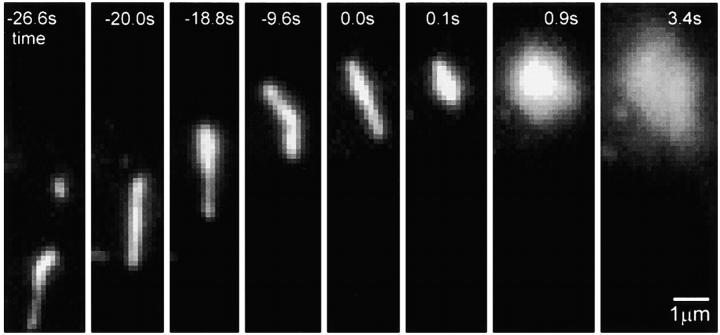
Figure 3
Selected frames from a sequence showing the transport, docking, and fusion of a tubular carrier. Times are marked relative to the start of the rise phase.
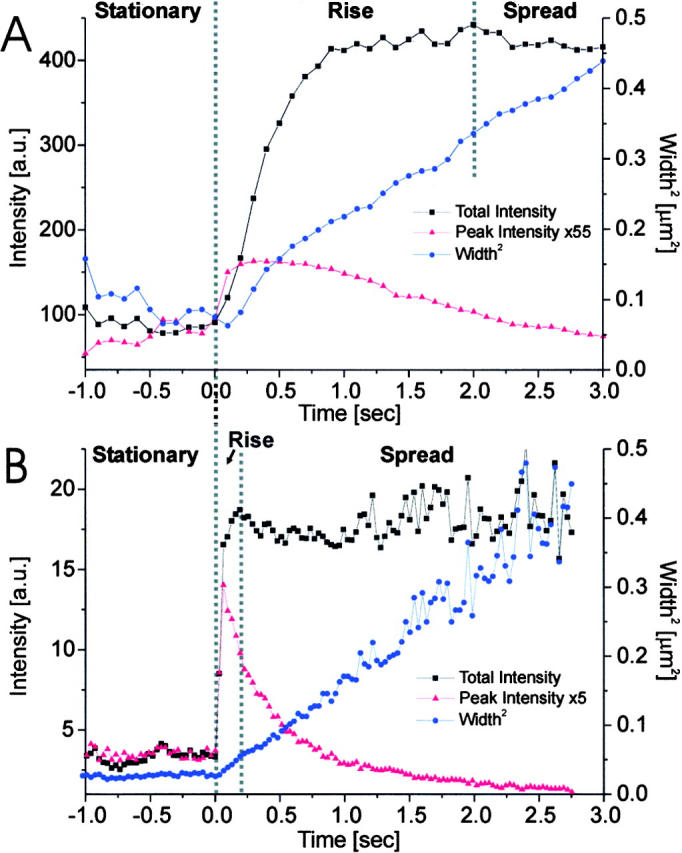
Figure 4
Carrier fusion events with different rise times. Total intensity, peak intensity, and square of the Gaussian width were plotted on the same time axis for carriers with long and short rise times (time ...
Figure images are served from the NIH/NLM PubMed Central Open Access Subset or Europe PMC; copyright remains with the publishers and authors.
💬 Discussion
0 commentsNo comments yet. Be the first to start a discussion!
Leave a Comment