Abstract
AbstractIn this paper we have used second harmonic generation (SHG) and phasor approach to auto fluorescence lifetime imaging (FLIM) to obtain fingerprints of different collagens and then used these fingerprints to observe bone marrow fibrosis in the mouse femur. This is a label free approach towards fast automatable detection of fibrosis in tissue samples. FLIM has previously been used as a method of contrast in different tissues and in this paper phasor approach to FLIM is used to separate collagen I from collagen III, the markers of fibrosis, the largest groups of disorders that are often without any effective therapy. Often characterized by an increase in collagen content of the corresponding tissue, the samples are usually visualized by histochemical staining, which is pathologist dependent and cannot be automated.
🔬 Techniques
🧪 Sample Preparation
🏭 Microscope Brands
🧪 Reagent Suppliers
🔴 Lasers
📷 Detectors
🏛️ Research Organizations (ROR)
Affiliated research institutions:
📋 Methods
Preparation of collagen gels Collagen
I from rat tail (Cat. No. – 354236) was bought from Corning Incorporated (Tewksbury, MA). Collagen II from chicken sternal cartilage (Cat. No. – C9301-5MG) and, collagen III (Cat. No. – C4407-1MG), collagen IV (Cat. No. – C7521-5MG) and Collagen V (Cat. No. – C3657-1MG) from human placenta were purchased from Sigma Aldrich (St. Louis, MO). All the collagens gels were prepared using the following procedure. The collagen samples were first diluted to 3.75 mg/ml. The eight chamber borosilicate coverglass system (Lab-Tek) was placed on the refrigerator at 4 °C. All the components were placed on ice to decrease the temperature shock. In a 2 ml sterile tube 317 μl water and 533 μl collagen was added and vortexed to ensure complete mixing. 100 μl 10X PBS pre-mixed with phenol red was added to this solution while vortexing and then neutralized with 0.5 N NaOH very slowly until the appearance of light pink color. 350 μL of this collagen mixture and 50 μL of 1X PBS were added to the wells of the Lab-Tek chamber. The chamber was placed at 20 °C for one hour and then transferred to the 37 °C incubator overnight and then imaged the next day. The gel containing the mixture of the collagen I and III was prepared by mixing 270 μL of collagen I and 90 μL of collagen III prior to the addition to Lab-Tek chambers.
Biological sample preparation
The femurs of both wild type mice and SMRT mRID mice were simultaneously decalcified and fixed with CAL-EXII (Fisher Scientific, USA). Then femurs were embedded and frozen in O.C.T. compound (TissueTek, USA). 10 mm frozen sections were obtained using Leica CM 1850 Cryostat (Leica, Germany). SHG and FLIM images were obtained for these bone slices. Generation and initial characterization of SMRTmRID mice are described previously 34 . These mice were further backcrossed for 4 more generations to sv129. Only age matched male mice (average cohort size 6–10) were randomly assigned and used. All mice were bred and maintained in the Salk Institute animal facility under specific pathogen free conditions. Procedures involving animals were reviewed and approved by the Institutional Animal Care and Use Committee (IACUC) at the Salk Institute, and conformed to regulatory and ethical standards. The methods were carried out in accordance with the approved guidelines. The mouse studies were not blinded, as the same investigators performed the grouping, dosing and analyses, rendering blinding of the studies unfeasible.
Show full methods section
Preparation of collagen gels Collagen
I from rat tail (Cat. No. – 354236) was bought from Corning Incorporated (Tewksbury, MA). Collagen II from chicken sternal cartilage (Cat. No. – C9301-5MG) and, collagen III (Cat. No. – C4407-1MG), collagen IV (Cat. No. – C7521-5MG) and Collagen V (Cat. No. – C3657-1MG) from human placenta were purchased from Sigma Aldrich (St. Louis, MO). All the collagens gels were prepared using the following procedure. The collagen samples were first diluted to 3.75 mg/ml. The eight chamber borosilicate coverglass system (Lab-Tek) was placed on the refrigerator at 4 °C. All the components were placed on ice to decrease the temperature shock. In a 2 ml sterile tube 317 μl water and 533 μl collagen was added and vortexed to ensure complete mixing. 100 μl 10X PBS pre-mixed with phenol red was added to this solution while vortexing and then neutralized with 0.5 N NaOH very slowly until the appearance of light pink color. 350 μL of this collagen mixture and 50 μL of 1X PBS were added to the wells of the Lab-Tek chamber. The chamber was placed at 20 °C for one hour and then transferred to the 37 °C incubator overnight and then imaged the next day. The gel containing the mixture of the collagen I and III was prepared by mixing 270 μL of collagen I and 90 μL of collagen III prior to the addition to Lab-Tek chambers.
Biological sample preparation
The femurs of both wild type mice and SMRT mRID mice were simultaneously decalcified and fixed with CAL-EXII (Fisher Scientific, USA). Then femurs were embedded and frozen in O.C.T. compound (TissueTek, USA). 10 mm frozen sections were obtained using Leica CM 1850 Cryostat (Leica, Germany). SHG and FLIM images were obtained for these bone slices. Generation and initial characterization of SMRTmRID mice are described previously 34 . These mice were further backcrossed for 4 more generations to sv129. Only age matched male mice (average cohort size 6–10) were randomly assigned and used. All mice were bred and maintained in the Salk Institute animal facility under specific pathogen free conditions. Procedures involving animals were reviewed and approved by the Institutional Animal Care and Use Committee (IACUC) at the Salk Institute, and conformed to regulatory and ethical standards. The methods were carried out in accordance with the approved guidelines. The mouse studies were not blinded, as the same investigators performed the grouping, dosing and analyses, rendering blinding of the studies unfeasible.
Microscopy
The fluorescence lifetime imaging and the second harmonic generation imaging were carried out using the homebuilt DIVER ( Deep Imaging via Enhanced-Photon Recovery) microscope. The details of this microscope construction are explained elsewhere 35 36 37 . Briefly, the DIVER microscope is based on an upright laser scanning fluorescence microscope. The main difference from a regular upright microscope is on the emission path of the instrument. Here the sample is placed directly on top of the filter wheel assembly and the filter wheel is placed right on top of a wide area PMT. The collagen gel samples were excited with 710 nm line of a Deep See MaiTai laser with a 40X water immersion objective (Olympus Plan Apo). The bone samples were excited with a 20X air objective (Olympus). Different filter sets were used to select either the SHG or the fluorescence generated in the samples. A combination of UG11 and BG39 (used to protect the PMT from direct excitation) creates a window of 350 nm ± 20 nm (FWHM) and was used to collect the SHG signal. Another filter with a window of 400 nm to 560 nm was used for the collection of the fluorescence signals. The signals were recorded using the FLIMBOX and directly transferred to the phasor plot 38 . The second harmonic signal has a lifetime of zero and appears at the position of s = 0 and g = 1 at the phasor plot. Fluorescence signals have non-zero lifetime and appear elsewhere in the phasor plot. A solution of Rh110, having a lifetime of 4 ns, was used for the calibration of the phasor and used as the standard for all the samples. Phasor approach to fluorescence lifetime 26 29 The lifetime signals originating from the different collagens samples were analyzed by the phasor approach to fluorescence lifetime. The details of this approach for both the TCSPC (time correlated single photon counting) and phase and modulation measurements are explained elsewhere and have been used extensively in biological samples 14 28 29 31 38 . Briefly, the intensity decay originating from each point of an image is transferred to the phasor plot and creates a single point. A particular population in the phasor plot can then be chosen using a colored cursor and the fluorescence intensity image can be painted accordingly. This results in a fit free method to analyze FLIM images. Different populations corresponding to different lifetimes can easily be selected in the phasor plot and thus the intensity image can be masked according to the fluorescence lifetime. This is instantaneous and unlike the TCSPC approach, does not require a multi-exponential fitting at every pixel of an image. Thus the phasor approach is computationally much less expensive and faster. If the intensity decay at any pixel can be defined by a mono-exponential, then the phasor point originating from that pixel appears in the semicircle shown in blue in the phasor plots (called the universal semicircle). Multi-exponential decays result in phasor points inside the universal semicircle. A mathematical property of this method is that if at one pixel, there are contributions from two or more different exponential components, i.e. different phasor positions on the universal circle, then the corresponding point in the phasor plot of that pixel lies along the line or lines joining the those individual components at the universal circle. This is called the law of linear combination. According to this law, the relative contribution of those components can be obtained graphically by calculating the distance between the combination point in the phasor plot and the individual component positions in the universal circle. The SHG signals have a lifetime of zero as the signal from the SHG is coherent with the laser and they appear at s = 0, g = 1 in the phasor plot. Fluorescence signals from the collagens have non-zero lifetime and appear inside the semicircle.
📊 Figures
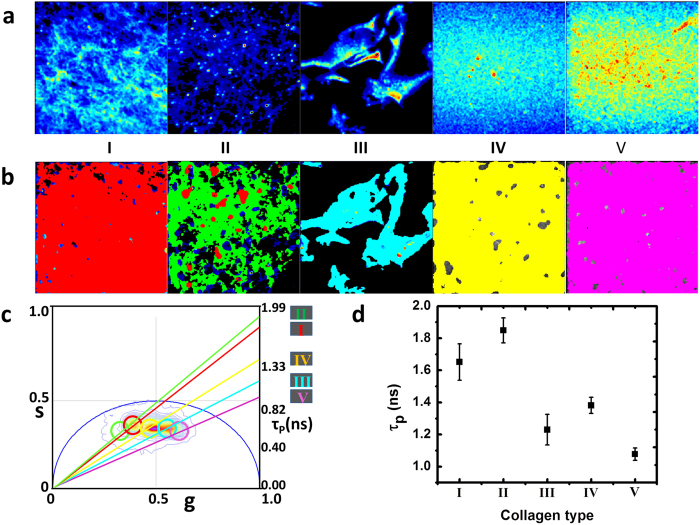
Figure 1
Separation of collagens based on the fluorescence lifetime using the clusters in the phasor plot.
Figure 1a , from left to right, shows the fluorescence intensity signals originating from gels of collagen I to V. Figure 1b shows the same intensity image masked with the cursor color chosen in the p...
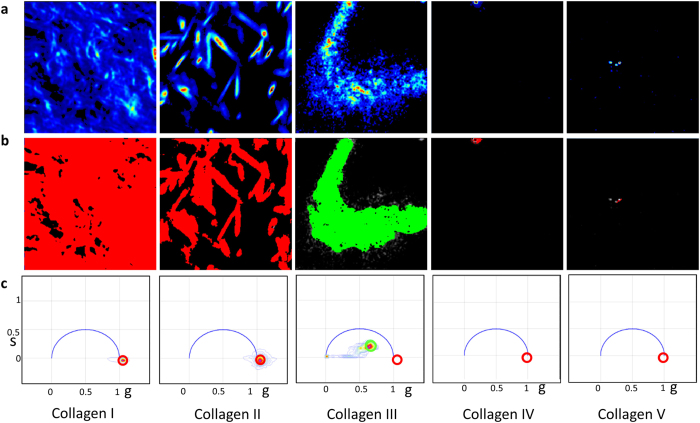
Figure 2
Signals in the SHG channel for gels of collagen I to V.
( Fig. 2a ) SHG intensity image of collagen I to V (left to right). ( Fig. 2b ) SHG intensity images overlapped with the color mask chosen in the phasor plots ( Fig. 2c ). Red cursor was used to selec...
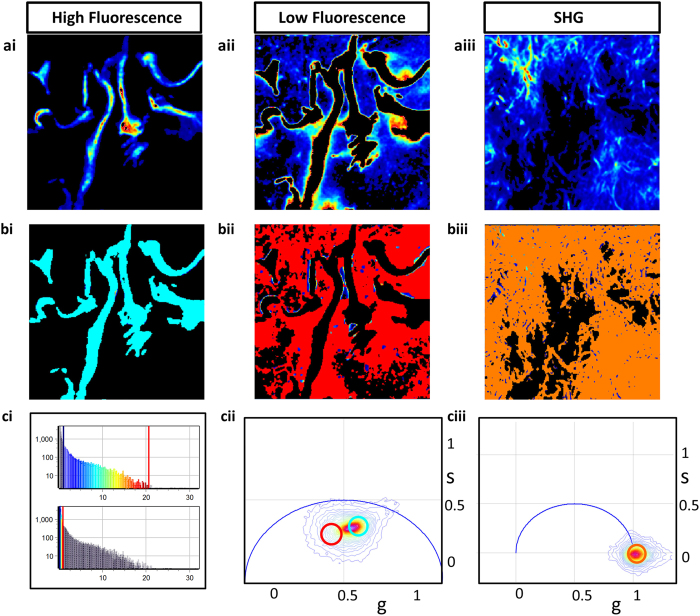
Figure 3
Fluorescence and SHG signals of the gel prepared from the mixture of collagen I and III.
The fluorescence image was selected either for the high intensity (Fig. 3ai) using the top histogram (Fig. 3ci) or for the low intensity (Fig. 3aii) using the bottom histogram in (Fig. 3ci). The fluor...
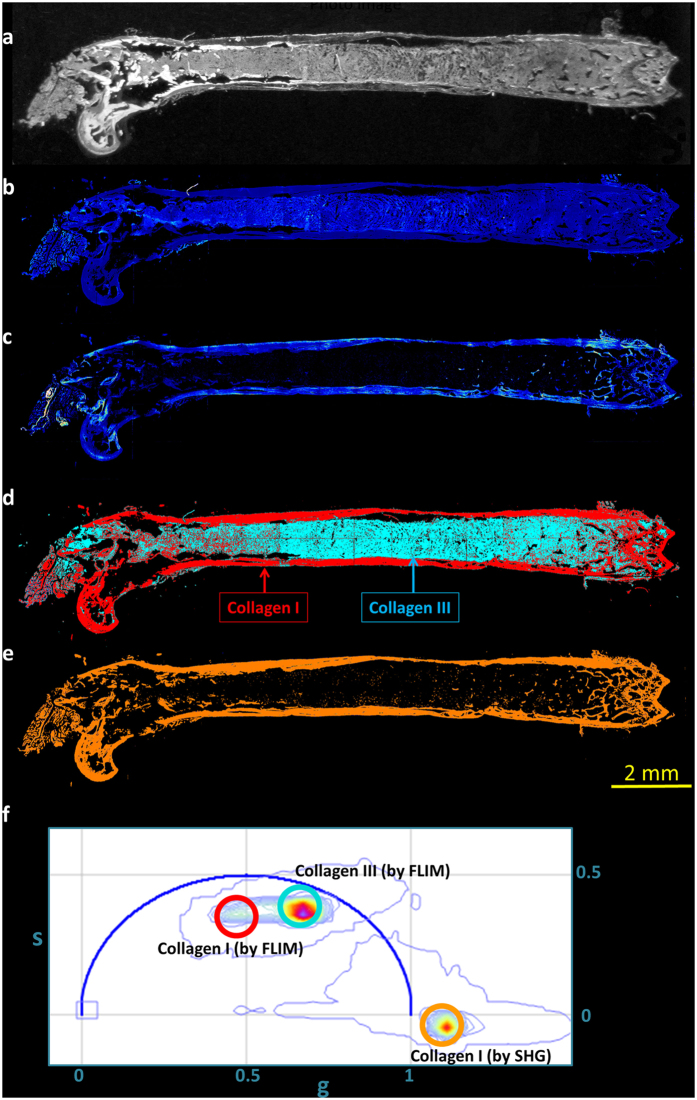
Figure 4
Separation of collagen I and collagen III in mouse femur bones.
Picture of the bone, two photon auto-fluorescence intensity image and the SHG images are shown in Fig. 4au2013c , respectively. The FLIM and SHG phasor masked images are shown in Fig. 4d,e where the m...
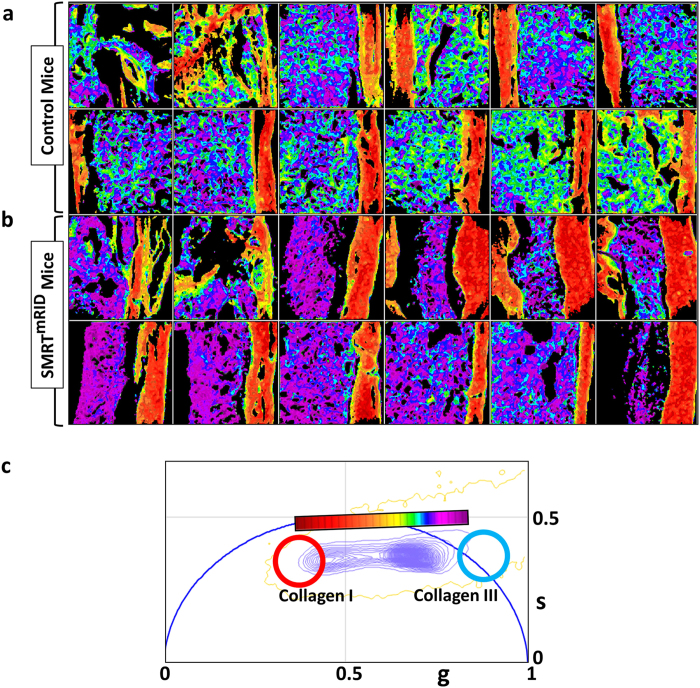
Figure 5
Separation of collagen I and III in normal and fibrotic bone marrows.
( Fig. 5a ) and ( Fig. 5b ) show the phasor masked FLIM images of the non-fibrotic wild type mice and fibrotic SMRT mRID mice, respectively. The more violet color in the Fig. 5b is representative of h...
Figure images are served from the NIH/NLM PubMed Central Open Access Subset or Europe PMC; copyright remains with the publishers and authors.
💬 Discussion
0 commentsNo comments yet. Be the first to start a discussion!
Leave a Comment