Abstract
BACKGROUND: Mesenchymal stem cells have been shown therapeutic in various neurological disorders. Recent studies support the notion that the predominant mechanism by which MSCs act is through the release of extracellular vesicles (EVs). EVs seem to have similar therapeutic activity as their cellular counterparts and may represent an interesting alternative standalone therapy for various diseases. The aim of the study was to optimize the method of EV imaging to better understand therapeutic effects mediated by EVs. METHODS: The fluorescent lipophilic stain PKH26 and superparamagnetic iron oxide nanoparticles conjugated with rhodamine (Molday ION Rhodamine B™) were used for the labeling of vesicles in human bone marrow MSCs (hBM-MSCs). The entire cycle from intracellular vesicles to EVs followed by their uptake by hBM-MSCs has been studied. The identity of vesicles has been proven by antibodies against: anti-CD9, -CD63, and -CD81 (tetraspanins). NanoSight particle tracking analysis (NTA), high-resolution flow cytometric analysis, transmission electron microscopy (TEM), ELYRA PS.1 super-resolution microscopy, and magnetic resonance imaging (MRI) were used for the characterization of vesicles. RESULTS: The PKH26 and Molday ION were exclusively localized in intracellular vesicles positively stained for EV markers: CD9, CD63, and CD81. The isolated EVs represent heterogeneous population of various sizes as confirmed by NTA. The TEM and MRI were capable to show successful labeling of EVs using ION. Co-culture of EVs with hBM-MSCs revealed their uptake by cells in vitro, as visualized by the co-localization of PKH26 or Molday ION with tetraspanins inside hBM-MSCs. CONCLUSION: PKH26 and Molday ION seem to be biocompatible with EVs, and the labeling did not interfere with the capability of EVs to re-enter hBM-MSCs during co-culture in vitro. Magnetic properties of IONs provide an additional advantage for the imaging of EV using TEM and MRI.
🔬 Techniques
🔭 Microscopes
✨ Fluorophores
🧪 Sample Preparation
🔬 Cell Lines
🏭 Microscope Brands
🧪 Reagent Suppliers
🏛️ Research Organizations (ROR)
Affiliated research institutions:
📋 Methods
The fluorescent lipophilic stain PKH26 and superparamagnetic iron oxide nanoparticles conjugated with rhodamine (Molday ION Rhodamine B™) were used for the labeling of vesicles in human bone marrow MSCs (hBM-MSCs). The entire cycle from intracellular vesicles to EVs followed by their uptake by hBM-MSCs has been studied. The identity of vesicles has been proven by antibodies against: anti-CD9, -CD63, and -CD81 (tetraspanins).
NanoSight particle tracking analysis
(NTA), high-resolution flow cytometric analysis, transmission electron microscopy (TEM), ELYRA PS.1 super-resolution microscopy, and magnetic resonance imaging (MRI) were used for the characterization of vesicles.
Methods Cell culture
Commercially available human bone marrow MSCs (hBM-MSCs) (Lonza, Walkersville, MD, USA) were plated in 75 cm 2 polystyrene tissue culture flasks (Thermo Fisher Scientific, Waltham, MA, USA) at a density of 5×10 3 cells/cm 2 with 10 mL of Mesenchymal Stem Cell Growth Medium (MSCGM™, BulletKit™; Lonza). Cultures were incubated at 37°C in a humidified atmosphere containing 5% CO 2 . Cells were subsequently maintained in MSCGM™ medium and passaged at 80% confluence in a ratio of 1:2 in trypsin/ EDTA solution (Thermo Fisher Scientific) with the culture medium changed thrice a week.
Labeling of hBM-MSCs
The labeling of cells with Molday ION consisted of SPIO nanoparticles, and rhodamine purchased from BioPAL (Worcester, MA, USA) was performed as previously described by us. 35 Briefly, 100 μL of Molday ION was added to the 5×10 5 hBM-MSCs cultured in 10 mL of MSCGM and incubated over 16 hours at 37°C in a humidified atmosphere containing 5% CO 2 . After that, medium with label was removed, cells were washed with phosphate-buffered saline (PBS), fresh medium was added, and cells were cultured for 48 or 72 hours. The labeling of cells with PKH26 (Red Fluorescent Cell Linker Kits MINI26; Sigma-Aldrich Co., St Louis, MO, USA) was performed at room temperature (RT) for 5 minutes in the dark and blocked with fetal bovine serum (FBS), according to manufacturer’s instructions. The unincorporated stains were removed by hBM-MSCs centrifugation at 400× g for 10 minutes at 20°C–25°C using Eppendorf Centrifuge 5804R. hBM-MSCs were washed with Dulbecco’s PBS (DPBS) without Ca++ and Mg++ (Lonza) and subjected to additional centrifugation. The pellet was re-suspended, and cells were plated in 75 cm 2 polystyrene tissue culture flasks as described earlier.
Show full methods section
The fluorescent lipophilic stain PKH26 and superparamagnetic iron oxide nanoparticles conjugated with rhodamine (Molday ION Rhodamine B™) were used for the labeling of vesicles in human bone marrow MSCs (hBM-MSCs). The entire cycle from intracellular vesicles to EVs followed by their uptake by hBM-MSCs has been studied. The identity of vesicles has been proven by antibodies against: anti-CD9, -CD63, and -CD81 (tetraspanins).
NanoSight particle tracking analysis
(NTA), high-resolution flow cytometric analysis, transmission electron microscopy (TEM), ELYRA PS.1 super-resolution microscopy, and magnetic resonance imaging (MRI) were used for the characterization of vesicles.
Methods Cell culture
Commercially available human bone marrow MSCs (hBM-MSCs) (Lonza, Walkersville, MD, USA) were plated in 75 cm 2 polystyrene tissue culture flasks (Thermo Fisher Scientific, Waltham, MA, USA) at a density of 5×10 3 cells/cm 2 with 10 mL of Mesenchymal Stem Cell Growth Medium (MSCGM™, BulletKit™; Lonza). Cultures were incubated at 37°C in a humidified atmosphere containing 5% CO 2 . Cells were subsequently maintained in MSCGM™ medium and passaged at 80% confluence in a ratio of 1:2 in trypsin/ EDTA solution (Thermo Fisher Scientific) with the culture medium changed thrice a week.
Labeling of hBM-MSCs
The labeling of cells with Molday ION consisted of SPIO nanoparticles, and rhodamine purchased from BioPAL (Worcester, MA, USA) was performed as previously described by us. 35 Briefly, 100 μL of Molday ION was added to the 5×10 5 hBM-MSCs cultured in 10 mL of MSCGM and incubated over 16 hours at 37°C in a humidified atmosphere containing 5% CO 2 . After that, medium with label was removed, cells were washed with phosphate-buffered saline (PBS), fresh medium was added, and cells were cultured for 48 or 72 hours. The labeling of cells with PKH26 (Red Fluorescent Cell Linker Kits MINI26; Sigma-Aldrich Co., St Louis, MO, USA) was performed at room temperature (RT) for 5 minutes in the dark and blocked with fetal bovine serum (FBS), according to manufacturer’s instructions. The unincorporated stains were removed by hBM-MSCs centrifugation at 400× g for 10 minutes at 20°C–25°C using Eppendorf Centrifuge 5804R. hBM-MSCs were washed with Dulbecco’s PBS (DPBS) without Ca++ and Mg++ (Lonza) and subjected to additional centrifugation. The pellet was re-suspended, and cells were plated in 75 cm 2 polystyrene tissue culture flasks as described earlier.
Immunocytochemical analysis
Immunocytochemistry was used to identify labeled intracellular vesicles prior to their isolation or after uptake of labeled EVs. For phenotypic analysis, indirect immunocytochemistry was performed on Molday ION-labeled hBM-MSCs and nonlabeled hBM-MSCs previously incubated with labeled hBM-MSC-EVs. The direct red fluorescence was used to capture the presence of labels and co-localize with immunocytochemical staining. The cells were fixed with 4% paraformaldehyde, blocked, and permeabilized with the mixture of 10% goat serum (Thermo Fisher Scientific), 0.1% bovine serum albumin (BSA) (Sigma-Aldrich Co.), and 0.25% Triton (Sigma-Aldrich Co.) for 1 hour at RT. Cells were incubated with the following primary mouse antihuman monoclonal antibodies: anti-CD73 (1:100; Santa Cruz Biotechnology Inc., Dallas, TX, USA), anti-CD90 (1:100; Santa Cruz Biotechnology Inc.), anti-CD44 (1:100; Santa Cruz Biotechnology Inc.), anti-STEM121 (1:100; Cellartis, Takara Bio Europe, France), anti-CD63 (1:100; BD Pharmingen), anti-CD9 (1:100; BD Pharmingen, New Jersey, USA), and anti-CD81 (1:100; Santa Cruz Biotechnology Inc.) overnight at 4°C. Then, the secondary goat antimouse antibodies conjugated with Alexa Fluor 488 nm/green (Thermo Fisher Scientific) were added and the slides were exposed for 60 minutes at RT in the dark. In addition, cell nuclei were counterstained with 5 μL (1.33 μg/1 mL) Hoechst 33258 (Sigma-Aldrich Co.). After washing with PBS, the slides were mounted with Fluorescent Mounting Medium (Dako Denmark A/S, Glostrup, Denmark). Negative controls were performed with the same procedure omitting the primary antibodies. Imaging was performed by super-resolution structured illumination microscopy (SR-SIM) on LSM 780/ELYRA PS.1 (Carl Zeiss Meditec AG, Jena, Germany) platform equipped with the ZEN 2012 software, lasers (488 or 561 nm), and 405 nm diode lamp with a 100×, NA 1.46 oil objective. Spherical aberration was minimized by choosing an immersion oil with a refractive index giving symmetrical point spread functions, and image stacks of several micrometer thicknesses were taken with 0.100 μm z-steps, five phases, five rotations per z-section. The slides analyzed with SR-SIM were registered, and the positive cells were counted. EVs’ isolation from hBM-MSCs The isolation of EVs was performed from conditioning media of Molday ION-labeled and nonlabeled hBM-MSCs. A total of 5×10 6 of hBM-MSCs (passages 4–6) were cultured in 75 cm 2 polystyrene tissue flasks to reach 50%–60% confluence, then the culture medium was changed, and the cells were incubated for additional 48–72 hours to the confluence of 70%–80%. Cell culture supernatants were collected and centrifuged at 200× g for 10 minutes and then at 500× g for 10 minutes at 4°C, aliquoted, and frozen at −70°C for further use. In order to isolate EVs, hBM-MSCs’ culture supernatants were thawed, spun down at 2,000× g for 20 minutes to remove cellular debris, and then centrifuged at 100,000× g for 75 minutes at 4°C using a Thermo Scientific Type 865 Fixed Angle Rotor. The pellets were washed with DPBS and subjected to an additional centrifugation at 100,000× g for 75 minutes at 4°C using a Thermo Scientific Type 865 Fixed Angle Rotor. Then, the supernatant was discarded and the pellet was re-suspended in 100 μL of DPBS and stored at −70°C until needed.
Labeling of EVs using PKH26
EVs isolated from nonlabeled hBM-MSCs were tagged with PKH26 at RT for 5 minutes in the dark and blocked with FBS, according to manufacturer’s instructions. The unincorporated labels were removed by hBM-MSC-EVs centrifugation at 100,000× g for 75 minutes at 4°C using a Thermo Scientific T-865 Fixed Angle Rotor, Thermo Scientific Sorvall WX Ultracentrifuge Series. hBM-MSC-EVs were washed with DPBS and subjected to additional centrifugations. Then, the pellet was re-suspended in 1 mL of DPBS for further use.
NanoSight particle tracking analysis
(NTA) of EVs isolated from hBM-MSCs The size and concentration of hBM-MSC-EVs were analyzed using the NanoSight NS300 system (Malvern Instruments, Malvern, UK) and configured with scientific CMOS camera and blue 488 nm laser. For NanoSight analysis, EVs were diluted in 1 mL of DPBS and collected and analyzed by the NTA software Version 3.2. Each of six hBM-MSC-EV samples from the different isolations was recorded three times for 60 seconds at constant temperature 23°C creating three replicable histograms, which were averaged.
EVs isolated from hBM-MSCs’ characterization by high-resolution flow cytometric analysis
Flow cytometry analysis of stained hBM-MSC-EVs was performed with Apogee A50-Micro cytometer, unique high-resolution system dedicated for the reliable characterization of small particles. To ensure the specificity of obtained data, appropriate isotype controls were also included in gating strategy. hBM-MSC-EVs were stained with the following mouse monoclonal antibodies: FITC-conjugated anti-CD9 clone M-L13, anti-CD63 clone H5C6, and anti-CD81 clone JS-81 (all from BD Biosciences, San Jose, CA, USA) and PE-conjugated anti-CD44 clone BJ18, anti-CD73 clone AD2, and anti-CD90 clone 5E10 (all from BioLegend, San Diego, CA, USA) or appropriate isotype-match controls. Briefly, hBM-MSC-EVs suspended in 0.2 μm filtered PBS were incubated with antibodies for 30 minutes at 4°C. Prior to addition, all antibodies were centrifuged at 21,000× g for 20 minutes at 4°C to remove potential protein aggregates. Additionally, hBM-MSC-EVs were stained with PKH26 membrane dye at RT for 5 minutes in the dark and blocked with FBS, according to manufacturer’s instructions. The sample of PBS only with PKH26 and FBS was also prepared as a control. Stained EV samples were analyzed by Apogee A50-Micro flow cytometer (Apogee Flow Systems, Hemel Hempstead, UK), and the percentage of gated positive events was calculated by the Histogram software (Apogee Flow Systems). Transmission electron microscopy (TEM) For ultrastructural studies, hBM-MSC-EV pellets were fixed with 2% paraformaldehyde (Sigma-Aldrich Co.) and 2.5% glutaraldehyde (Merck KGaA, Darmstadt, Germany) in 0.1 M cacodylate buffer, pH 7.4, overnight at 4°C, postfixed with 1% osmium tetroxide (Sigma-Aldrich Co.), dehydrated in a graded series of ethanol and propylene oxide (abcr GmbH, Karlsruhe, Germany), embedded in Agar 100 resin kit R1031 (Agar Scientific Ltd, Stansted, UK), and sectioned (50 nm) using ultramicrotome (RMC Boeckeler, Tucson, AZ, USA). Ultrathin sections were stained with uranyl acetate and lead citrate. Grids were examined with a JEM 1200EX electron microscope (Oxford, UK).
MRI analysis
MRI acquisition was performed using the 7T scanner (BioSpec 70/30USR; Bruker AXS Inc., Madison, WI, USA). For the detection of hBM-MSC-EVs stained with iron nanoparticles, T2-weighted sequence (TR =2,500 ms, TE =36 ms, factional anisotropy (FA) =180°, TA =2 minutes 40 seconds) was used. For MR imaging of Molday ION-labeled hBM-MSC-EVs, the pellet of ~1.3×10 9 EVs diluted in 200 μL of DPBS (Lonza) was deposited in PCR tubes and placed in the phantom consisting of 2% agar to stabilize the tubes and avoid artifacts from surrounding air. hBM-MSC-EVs labeled with Molday ION and non-labeled EVs were examined. The T2 maps were calculated from the acquired data. Internalization of EVs into hBM-MSCs To analyze the transfer of hBM-MSC-EVs into cells, hBM-MSCs at passage 5 were plated to poly-L-lysine-coated coverslips at initial density 10 3 cells/cm 2 maintained at 37°C overnight and then incubated with EVs labeled with PKH26 or Molday ION for 24 hours. After removing media and thorough washout of cells, they were fixed and subjected to immunocytochemical analysis as described earlier.
Immunocytochemical analysis
Immunocytochemistry was used to identify labeled intracellular vesicles prior to their isolation or after uptake of labeled EVs. For phenotypic analysis, indirect immunocytochemistry was performed on Molday ION-labeled hBM-MSCs and nonlabeled hBM-MSCs previously incubated with labeled hBM-MSC-EVs. The direct red fluorescence was used to capture the presence of labels and co-localize with immunocytochemical staining. The cells were fixed with 4% paraformaldehyde, blocked, and permeabilized with the mixture of 10% goat serum (Thermo Fisher Scientific), 0.1% bovine serum albumin (BSA) (Sigma-Aldrich Co.), and 0.25% Triton (Sigma-Aldrich Co.) for 1 hour at RT. Cells were incubated with the following primary mouse antihuman monoclonal antibodies: anti-CD73 (1:100; Santa Cruz Biotechnology Inc., Dallas, TX, USA), anti-CD90 (1:100; Santa Cruz Biotechnology Inc.), anti-CD44 (1:100; Santa Cruz Biotechnology Inc.), anti-STEM121 (1:100; Cellartis, Takara Bio Europe, France), anti-CD63 (1:100; BD Pharmingen), anti-CD9 (1:100; BD Pharmingen, New Jersey, USA), and anti-CD81 (1:100; Santa Cruz Biotechnology Inc.) overnight at 4°C. Then, the secondary goat antimouse antibodies conjugated with Alexa Fluor 488 nm/green (Thermo Fisher Scientific) were added and the slides were exposed for 60 minutes at RT in the dark. In addition, cell nuclei were counterstained with 5 μL (1.33 μg/1 mL) Hoechst 33258 (Sigma-Aldrich Co.). After washing with PBS, the slides were mounted with Fluorescent Mounting Medium (Dako Denmark A/S, Glostrup, Denmark). Negative controls were performed with the same procedure omitting the primary antibodies. Imaging was performed by super-resolution structured illumination microscopy (SR-SIM) on LSM 780/ELYRA PS.1 (Carl Zeiss Meditec AG, Jena, Germany) platform equipped with the ZEN 2012 software, lasers (488 or 561 nm), and 405 nm diode lamp with a 100×, NA 1.46 oil objective. Spherical aberration was minimized by choosing an immersion oil with a refractive index giving symmetrical point spread functions, and image stacks of several micrometer thicknesses were taken with 0.100 μm z-steps, five phases, five rotations per z-section. The slides analyzed with SR-SIM were registered, and the positive cells were counted.
NanoSight particle tracking analysis
(NTA) of EVs isolated from hBM-MSCs The size and concentration of hBM-MSC-EVs were analyzed using the NanoSight NS300 system (Malvern Instruments, Malvern, UK) and configured with scientific CMOS camera and blue 488 nm laser. For NanoSight analysis, EVs were diluted in 1 mL of DPBS and collected and analyzed by the NTA software Version 3.2. Each of six hBM-MSC-EV samples from the different isolations was recorded three times for 60 seconds at constant temperature 23°C creating three replicable histograms, which were averaged.
EVs isolated from hBM-MSCs’ characterization by high-resolution flow cytometric analysis
Flow cytometry analysis of stained hBM-MSC-EVs was performed with Apogee A50-Micro cytometer, unique high-resolution system dedicated for the reliable characterization of small particles. To ensure the specificity of obtained data, appropriate isotype controls were also included in gating strategy. hBM-MSC-EVs were stained with the following mouse monoclonal antibodies: FITC-conjugated anti-CD9 clone M-L13, anti-CD63 clone H5C6, and anti-CD81 clone JS-81 (all from BD Biosciences, San Jose, CA, USA) and PE-conjugated anti-CD44 clone BJ18, anti-CD73 clone AD2, and anti-CD90 clone 5E10 (all from BioLegend, San Diego, CA, USA) or appropriate isotype-match controls. Briefly, hBM-MSC-EVs suspended in 0.2 μm filtered PBS were incubated with antibodies for 30 minutes at 4°C. Prior to addition, all antibodies were centrifuged at 21,000× g for 20 minutes at 4°C to remove potential protein aggregates. Additionally, hBM-MSC-EVs were stained with PKH26 membrane dye at RT for 5 minutes in the dark and blocked with FBS, according to manufacturer’s instructions. The sample of PBS only with PKH26 and FBS was also prepared as a control. Stained EV samples were analyzed by Apogee A50-Micro flow cytometer (Apogee Flow Systems, Hemel Hempstead, UK), and the percentage of gated positive events was calculated by the Histogram software (Apogee Flow Systems).
MRI analysis
MRI acquisition was performed using the 7T scanner (BioSpec 70/30USR; Bruker AXS Inc., Madison, WI, USA). For the detection of hBM-MSC-EVs stained with iron nanoparticles, T2-weighted sequence (TR =2,500 ms, TE =36 ms, factional anisotropy (FA) =180°, TA =2 minutes 40 seconds) was used. For MR imaging of Molday ION-labeled hBM-MSC-EVs, the pellet of ~1.3×10 9 EVs diluted in 200 μL of DPBS (Lonza) was deposited in PCR tubes and placed in the phantom consisting of 2% agar to stabilize the tubes and avoid artifacts from surrounding air. hBM-MSC-EVs labeled with Molday ION and non-labeled EVs were examined. The T2 maps were calculated from the acquired data.
TEM analysis of EVs isolated from hBM-MSCs The ultrastructural analysis of hBM-MSCs confirmed the localization of Molday ION in intracellular vesicles ( Figure 3A–D ). Additionally, we have shown Molday ION attachment and accumulation at the extracellular membrane. Interestingly, some of nanoparticles were captured during their uptake by hBM-MSCs and deposition within intracellular vesicles ( Figure 3D ). The TEM also revealed that EVs isolated from hBM-MSCs consist of heterogeneous population of vesicles enriched for smaller exosomes and larger microvesicles with different sizes and shapes ( Figure 4A–C ). EVs obtained from Molday ION-tagged hBM-MSCs demonstrated that iron nanoparticles remained inside the vesicles after the isolation procedure ( Figure 4D–F ).
EVs isolated from hBM-MSCs’ characterization by high-resolution flow cytometric analysis
Comparison of tested samples with the size-defined calibrating beads revealed that majority of visualized objects possessed size between ~100 and 250 nm. However, we observed that only a small subset of analyzed events was positive for tetraspanins, with similar amount for CD81 (2.85%±0.87%) and CD63 (2.58%±1.36%) but the lowest expression for CD9 (1.43%±0.46%). In contrast, the analysis of surface antigens’ characteristic for MSCs revealed that their hBM-MSC-EVs can harbor all three tested markers but with differential expression. In particular, the highest expression was observed for CD44, reaching 21.32%±3.27% of all analyzed particles. Moreover, 16.70±7.44 and 8.75%±2.03% of acquired EVs contained CD90 and CD73, respectively ( Figure 6A ). We found that 9.7% of particles present in FBS were positive for PKH26, whereas 58.9% of events in EVs sample possessed cell-membrane content. Thus, taking into account nonspecific particle ballast derived from serum, 49.2% of analyzed hBM-MSC-EVs were specifically positive for PKH26 membrane staining ( Figure 6B ).
📊 Figures
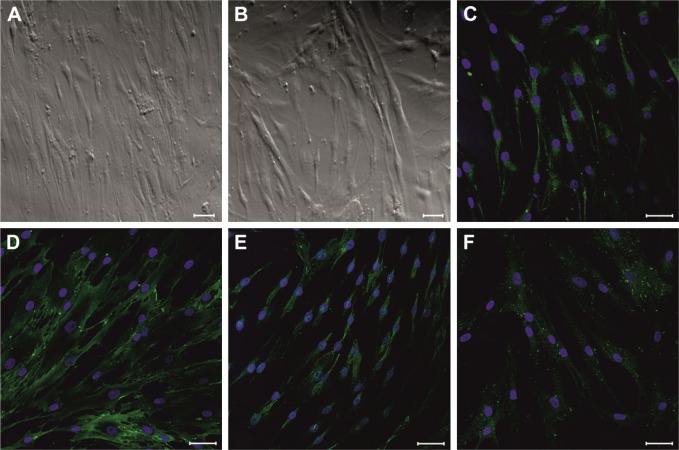
Figure 1
Morphology of expanded hBM-MSCs after 24 hours ( A ) and 7 days ( B ) cell culture in vitro. The immunohistochemical analysis of hBM-MSCs positively stained for STEM121 ( C ), CD44 ( D ), CD73 ( E ), ...
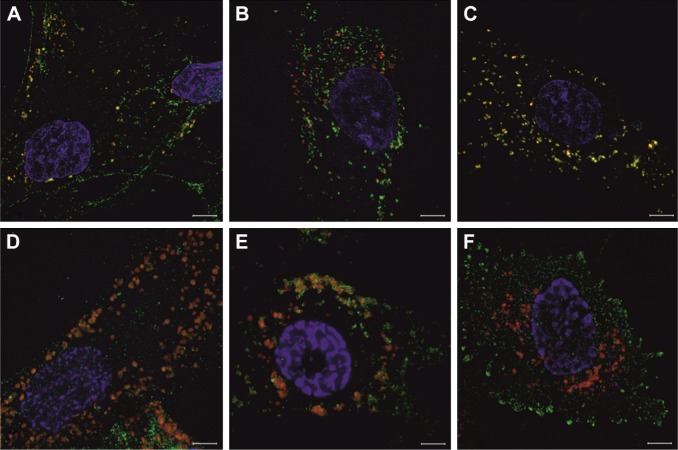
Figure 2
The SR-SIM analysis of hBM-MSCs with intracellular structures visible inside the cells positively stained with lypophilic dyes PKH26 ( A u2013 C ) or tagged with superparamagnetic iron nanoparticles c...
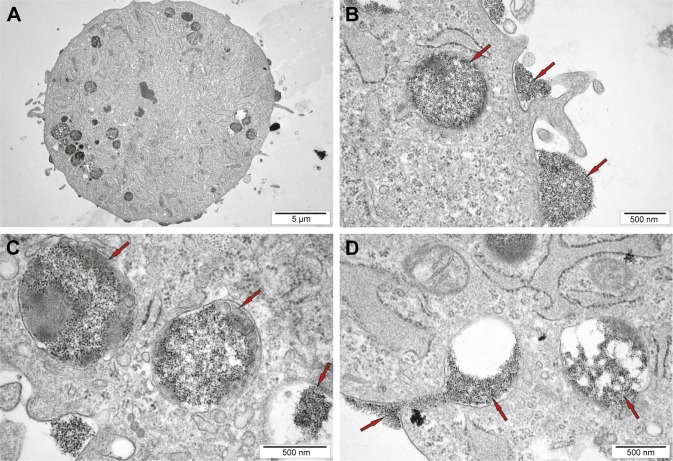
Figure 3
The ultrastructural study of hBM-MSCs labeled with Molday ION. Notes: The low magnification picture of the entire cell ( A ), the high magnification of part of cells including cell membrane and both u...
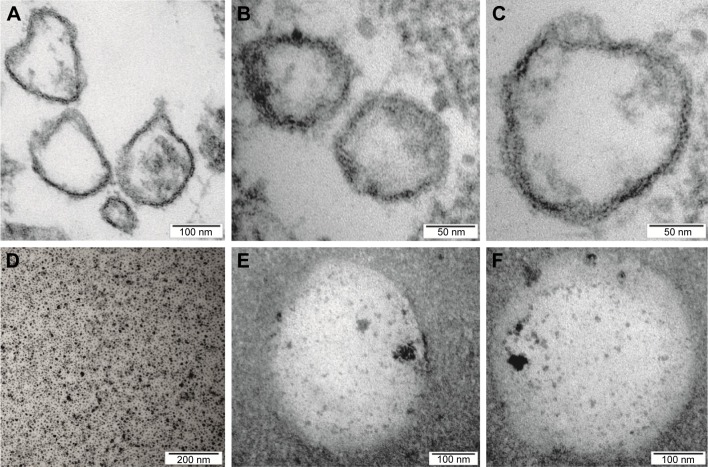
Figure 4
TEM analysis of EVs isolated from hBM-MSCs. Notes: The heterogeneous population of EVs seems to be enriched for exosomes and microvesicles in terms of their size and shape ( A u2013 C ); the sample of...
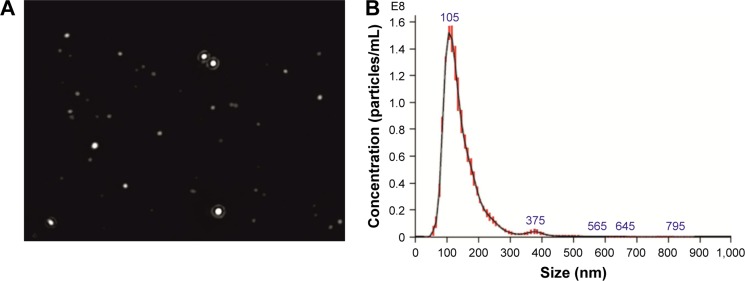
Figure 5
EVsu2019 NTA. Notes: EVs are observed at the screen shot from NTA video ( A ). Representative graph shows the results of particle concentration and their size measurements. NTA of this sample revealed...
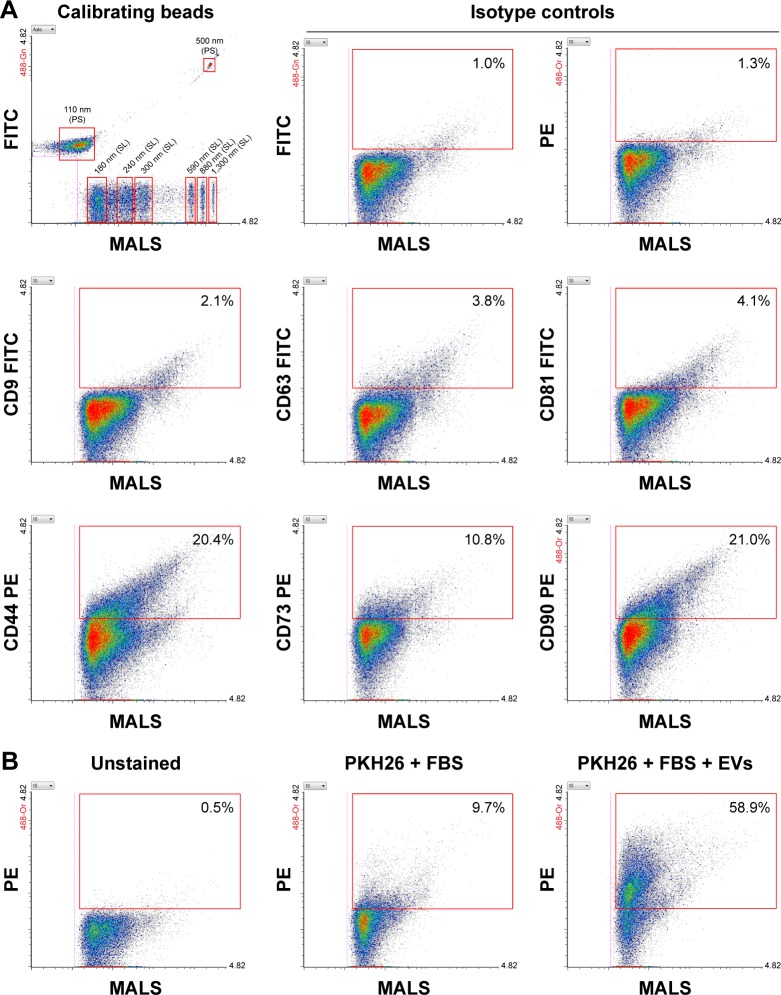
Figure 6
High-resolution flow cytometric analysis of EVs isolated from hBM-MSCs. Notes: Samples were analyzed by Apogee A50-Micro flow cytometer dedicated for the analysis of small particles. ( A ) Antigenic p...
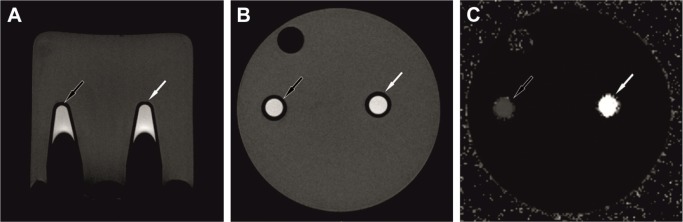
Figure 7
In vitro MR imaging of Molday ION-tracked hBM-MSC-EVs (black arrow) and nonlabeled hBM-MSC-EVs (white arrow) in phantom experiment. Notes: EV tubes were placed in agar gel ( A ). No obvious change was...
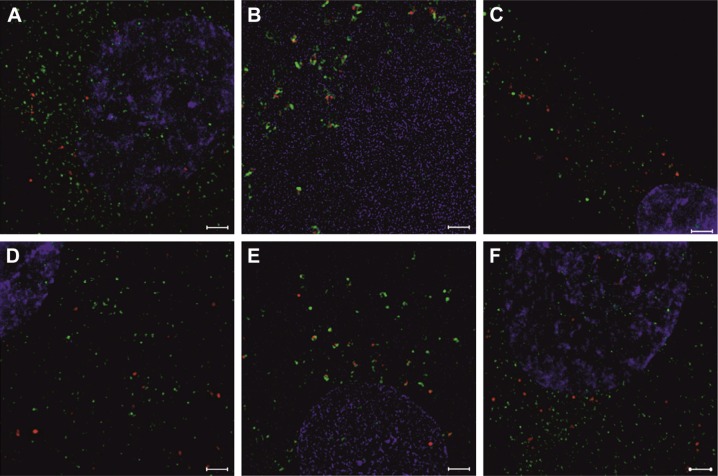
Figure 8
The SR-SIM analysis of hBM-MSCs, 24 hours after their co-culture with EVs previously stained with different dyes. Notes: EVs labeled with PKH26 ( A u2013 C ) or tagged with Molday ION ( D u2013 F ) (r...
Figure images are served from the NIH/NLM PubMed Central Open Access Subset or Europe PMC; copyright remains with the publishers and authors.
💬 Discussion
0 commentsNo comments yet. Be the first to start a discussion!
Leave a Comment