Abstract
The study of biological processes has become increasingly reliant on obtaining high-resolution spatial and temporal data through imaging techniques. As researchers demand molecular resolution of cellular events in the context of whole organisms, correlation of non-invasive live-organism imaging with electron microscopy in complex three-dimensional samples becomes critical. The developing blood vessels of vertebrates form a highly complex network which cannot be imaged at high resolution using traditional methods. Here we show that the point of fusion between growing blood vessels of transgenic zebrafish, identified in live confocal microscopy, can subsequently be traced through the structure of the organism using Focused Ion Beam/Scanning Electron Microscopy (FIB/SEM) and Serial Block Face/Scanning Electron Microscopy (SBF/SEM). The resulting data give unprecedented microanatomical detail of the zebrafish and, for the first time, allow visualization of the ultrastructure of a time-limited biological event within the context of a whole organism.
🔬 Techniques
🔭 Microscopes
🧬 Organisms
✨ Fluorophores
🧪 Sample Preparation
🔬 Cell Lines
🏭 Microscope Brands
🧪 Reagent Suppliers
💻 Software Details
🏛️ Research Organizations (ROR)
Affiliated research institutions:
📋 Methods
Zebrafish and Immunofluorescence The Tg(fli1 :EGFP ) y1 transgenic line [10] was maintained in standard conditions as previously described [19] . For immunofluorescence staining, embryos were fixed in 4% paraformaldehyde (PFA) for 2 h at 4°C, blocked for 1 h at room temperature (RT) in 10% goat serum/2% BSA/0.5% Triton in PBS, incubated overnight at 4°C with anti-acetylated tubulin antibody (T7451, Sigma) followed by incubation overnight at 4°C in secondary antibody. TEM Zebrafish were fixed in 2% PFA/1.5% glutaraldehyde in 0.1 M sodium cacodylate (pH 7.4) for 1 h, post-fixed in 1% osmium tetroxide/1.5% potassium ferrocyanide for 1 h and stained with 1% tannic acid in 0.05 M sodium cacodylate (pH 7.4) for 45 min at RT. Samples were dehydrated through an ethanol series, transferred to acetone and embedded in Durcupan resin according to the manufacturer's instructions (TAAB Laboratories Equipment Ltd). Ultrathin sections of 80 nm were cut, post-stained with lead citrate and viewed in a Tecnai Spirit Biotwin 120 keV TEM (FEI Company). Images were captured using Ultrascan and Orius CCDs (Gatan Inc.) with TIA (Tecnai Imaging and Analysis, FEI Company) and Digital Micrograph software (Gatan Inc.) respectively. Focused Ion Beam/Scanning Electron Microscopy (FIB/SEM) Zebrafish were embedded as described in ‘TEM’ above. The blockface was trimmed with a razor blade to reveal either a transverse or a lateral section through the trunk of the fish, and polished in a UCT ultramicrotome (Leica Microsystems UK) using a 90° diamond trimming knife (Diatome) so that all faces were smooth and perpendicular. Excess resin was trimmed away from the top and back surfaces of the block to reduce the volume of non-conductive material and the sample was mounted onto a 12.5 mm aluminium stub (Agar Scientific) using silver paint (Agar Scientific) and carbon-coated (Blazers CED030) to reduce charging. The sample was inserted into the stage of a Quanta 3D FEG FIB/SEM (FEI Company), raised to a working distance of 10 mm (the coincidence point of the electron and ion beams) and tilted to 52°. The block was imaged at an accelerating voltage of 5 keV and a current of 1.28 nA. The position and orientation of the zebrafish within the block was determined using secondary electron imaging mode (SEI, Everhardt Thornely Detector), whereas atomic number contrast of osmium within the tissue was imaged using a solid-state backscattered electron (BSE) detector [5] , [3] . An area of the blockface up to 80,000 µm 2 was coarse-milled at an ion beam current of 65 nA (accelerating voltage 30 keV) to remove excess resin until tissue could be seen. Subsequently a 1 µm layer of platinum was deposited using the chamber gas injection system on the block face above the AOI to stabilise the edge during milling [3] , [13] and trenches were milled on either side of the AOI to minimise redeposition of sputtered material back onto the blockface. The blockface was polished stepwise at 30, 15, 7, 5 and 3 nA until the surface was smooth. Milling conditions for the Slice and View run (S&V|, FEI Company) were 130×10 µm at 50 nm slice thickness at a current of 5 nA which gave a mill time of 73 s/slice. BSE imaging conditions were set at 5 keV accelerating voltage and 1.28 nA beam current with a dwell time of 30 µs, giving an acquistion time of 108 s/image. The image width was 114.5 µm at 2048×1768 pixels giving a final lateral resolution of 56 nm 2 /pixel. 693 images were collected over ∼35 h. Correlative Live-Confocal FIB/SEM Embryos at 28 hpf were anaesthetized in systems water containing tricane (0.016%, pH 7) and immobilized in 0.2% agarose on glass bottom culture dishes (MatTek Corp.). Embryos were kept at 28.0°C in an environmental chamber. Time-lapse microscopy was carried out on a Zeiss Axiovert 200 M fitted with an LSM 5 Pascal system. EGFP was excited with 488 nm laser emission supplied by an Argon laser. Stacks were composed of several optical slices with 1 µm slice spacing, acquired every 2 mins. The time-lapse video is a 2D representation of projected stacks. Zebrafish were fixed in 2% PFA in PBS as soon as sprouts from the ISVs had contacted and the AOI containing the anastomosing blood vessels was imaged at 10× and 40× for correlative measurements. Zebrafish were processed as described previously and embedded in moulds designed to simplify the trimming and milling steps for FIB/SEM (TAAB Laboratories Equipment Ltd). Using measurements collected in the confocal and dissecting microscopes pre- and post-embedding, the zebrafish was manually trimmed and polished to a blockface of approximately 700 µm wide by 300 µm deep (including part of the yolk sac as an orientation marker) to expose a lateral cross section of the AOI at the blockface. This was mounted on an SEM stub and imaged in the FIB/SEM as described above. The blockface was coarse milled until the myotomes were revealed and the exact orientation of the fish established. Milling conditions for the S&V|run were 400×5 µm at 72 nm slice thickness at a current of 7 nA which gave a mill time of 69 s/slice. BSE imaging conditions were set at 5 keV accelerating voltage and 1.3 nA beam current with a dwell time of 30 µs, giving an acquistion time of 108 s/image. The image width was 148.6 µm at 2048×1768 pixels giving a final resolution of 72 nm 3 /voxel. 1778 images were collected over ∼87 h. Serial Block Face/Scanning Electron Microscopy (SBF/SEM) Embryos at 72 hpf were imaged, fixed, embedded and trimmed as detailed above. The sample was trimmed to expose a transverse section through the trunk and inserted into the 3View microtome (Gatan Inc.) in the chamber of a Quanta 200 VP-FEG (FEI Company) with the block face aligned with the pole piece. In order to perform serial SEM of the block face [5] , a 50 nm slice was cut from the face with a diamond knife and the freshly cut surface of the block was scanned, and this process was repeated sequentially to collect 1000 slices over ∼15 h. Imaging was performed at an accelerating voltage of 4 keV in low vacuum mode (0.3 Torr) at 2048×2048 pixels with a pixel resolution of 24 nm 2 .
Show full methods section
Zebrafish and Immunofluorescence The Tg(fli1 :EGFP ) y1 transgenic line [10] was maintained in standard conditions as previously described [19] . For immunofluorescence staining, embryos were fixed in 4% paraformaldehyde (PFA) for 2 h at 4°C, blocked for 1 h at room temperature (RT) in 10% goat serum/2% BSA/0.5% Triton in PBS, incubated overnight at 4°C with anti-acetylated tubulin antibody (T7451, Sigma) followed by incubation overnight at 4°C in secondary antibody. TEM Zebrafish were fixed in 2% PFA/1.5% glutaraldehyde in 0.1 M sodium cacodylate (pH 7.4) for 1 h, post-fixed in 1% osmium tetroxide/1.5% potassium ferrocyanide for 1 h and stained with 1% tannic acid in 0.05 M sodium cacodylate (pH 7.4) for 45 min at RT. Samples were dehydrated through an ethanol series, transferred to acetone and embedded in Durcupan resin according to the manufacturer's instructions (TAAB Laboratories Equipment Ltd). Ultrathin sections of 80 nm were cut, post-stained with lead citrate and viewed in a Tecnai Spirit Biotwin 120 keV TEM (FEI Company). Images were captured using Ultrascan and Orius CCDs (Gatan Inc.) with TIA (Tecnai Imaging and Analysis, FEI Company) and Digital Micrograph software (Gatan Inc.) respectively. Focused Ion Beam/Scanning Electron Microscopy (FIB/SEM) Zebrafish were embedded as described in ‘TEM’ above. The blockface was trimmed with a razor blade to reveal either a transverse or a lateral section through the trunk of the fish, and polished in a UCT ultramicrotome (Leica Microsystems UK) using a 90° diamond trimming knife (Diatome) so that all faces were smooth and perpendicular. Excess resin was trimmed away from the top and back surfaces of the block to reduce the volume of non-conductive material and the sample was mounted onto a 12.5 mm aluminium stub (Agar Scientific) using silver paint (Agar Scientific) and carbon-coated (Blazers CED030) to reduce charging. The sample was inserted into the stage of a Quanta 3D FEG FIB/SEM (FEI Company), raised to a working distance of 10 mm (the coincidence point of the electron and ion beams) and tilted to 52°. The block was imaged at an accelerating voltage of 5 keV and a current of 1.28 nA. The position and orientation of the zebrafish within the block was determined using secondary electron imaging mode (SEI, Everhardt Thornely Detector), whereas atomic number contrast of osmium within the tissue was imaged using a solid-state backscattered electron (BSE) detector [5] , [3] . An area of the blockface up to 80,000 µm 2 was coarse-milled at an ion beam current of 65 nA (accelerating voltage 30 keV) to remove excess resin until tissue could be seen. Subsequently a 1 µm layer of platinum was deposited using the chamber gas injection system on the block face above the AOI to stabilise the edge during milling [3] , [13] and trenches were milled on either side of the AOI to minimise redeposition of sputtered material back onto the blockface. The blockface was polished stepwise at 30, 15, 7, 5 and 3 nA until the surface was smooth. Milling conditions for the Slice and View run (S&V|, FEI Company) were 130×10 µm at 50 nm slice thickness at a current of 5 nA which gave a mill time of 73 s/slice. BSE imaging conditions were set at 5 keV accelerating voltage and 1.28 nA beam current with a dwell time of 30 µs, giving an acquistion time of 108 s/image. The image width was 114.5 µm at 2048×1768 pixels giving a final lateral resolution of 56 nm 2 /pixel. 693 images were collected over ∼35 h. Correlative Live-Confocal FIB/SEM Embryos at 28 hpf were anaesthetized in systems water containing tricane (0.016%, pH 7) and immobilized in 0.2% agarose on glass bottom culture dishes (MatTek Corp.). Embryos were kept at 28.0°C in an environmental chamber. Time-lapse microscopy was carried out on a Zeiss Axiovert 200 M fitted with an LSM 5 Pascal system. EGFP was excited with 488 nm laser emission supplied by an Argon laser. Stacks were composed of several optical slices with 1 µm slice spacing, acquired every 2 mins. The time-lapse video is a 2D representation of projected stacks. Zebrafish were fixed in 2% PFA in PBS as soon as sprouts from the ISVs had contacted and the AOI containing the anastomosing blood vessels was imaged at 10× and 40× for correlative measurements. Zebrafish were processed as described previously and embedded in moulds designed to simplify the trimming and milling steps for FIB/SEM (TAAB Laboratories Equipment Ltd). Using measurements collected in the confocal and dissecting microscopes pre- and post-embedding, the zebrafish was manually trimmed and polished to a blockface of approximately 700 µm wide by 300 µm deep (including part of the yolk sac as an orientation marker) to expose a lateral cross section of the AOI at the blockface. This was mounted on an SEM stub and imaged in the FIB/SEM as described above. The blockface was coarse milled until the myotomes were revealed and the exact orientation of the fish established. Milling conditions for the S&V|run were 400×5 µm at 72 nm slice thickness at a current of 7 nA which gave a mill time of 69 s/slice. BSE imaging conditions were set at 5 keV accelerating voltage and 1.3 nA beam current with a dwell time of 30 µs, giving an acquistion time of 108 s/image. The image width was 148.6 µm at 2048×1768 pixels giving a final resolution of 72 nm 3 /voxel. 1778 images were collected over ∼87 h. Serial Block Face/Scanning Electron Microscopy (SBF/SEM) Embryos at 72 hpf were imaged, fixed, embedded and trimmed as detailed above. The sample was trimmed to expose a transverse section through the trunk and inserted into the 3View microtome (Gatan Inc.) in the chamber of a Quanta 200 VP-FEG (FEI Company) with the block face aligned with the pole piece. In order to perform serial SEM of the block face [5] , a 50 nm slice was cut from the face with a diamond knife and the freshly cut surface of the block was scanned, and this process was repeated sequentially to collect 1000 slices over ∼15 h. Imaging was performed at an accelerating voltage of 4 keV in low vacuum mode (0.3 Torr) at 2048×2048 pixels with a pixel resolution of 24 nm 2 .
3D Reconstruction and Segmentation of Data
FIB/SEM datasets were batch processed in Adobe Photoshop for optimal brightness and contrast, followed by alignment and reconstruction into a 3D volume using Amira (Visage Imaging Inc.). SBF/SEM datasets were aligned and reconstructed into a 3D volume using Digital Micrograph (Gatan Inc.) and Imaris (Bitplane Scientific Solutions). Features were segmented using Amira and movies were made in Amira and Imaris.
Supporting Information Movie S1 Live fluorescence imaging of blood vessel fusion in the Tg(fli1: EGFP)y1 transgenic zebrafish embryo, stills from which are shown in Fig. 1C . (1.68 MB MOV) Click here for additional data file. Movie S2 x, y and z orthoslices from the aligned FIB/SEM dataset in Fig. 3 showing the main axial vessels of a 32 hpf zebrafish embryo (movie created in Amira software). (3.41 MB MOV) Click here for additional data file. Movie S3 3D reconstruction of features from the correlative FIB/SEM dataset in Fig. 4 . The neural tube (dark blue), notochord (mid blue), endothelial cells (orange and yellow) and cells in close contact to the point of anastomosis (green, purple, lilac) are shown. Movie created using Amira software. (4.12 MB MOV) Click here for additional data file. Movie S4 x, y and z orthoslices from the 3View dataset of a 72 hpf zebrafish embryo in Fig. 5 (movie created in Imaris software). (1.76 MB MOV) Click here for additional data file. Movie S5 3D volume of the SBF/SEM dataset in Movie S4 showing a Clipping Plane which ends in the AOI highlighting the dorsal lateral anastomotic vessels (movie created in Imaris software). (2.53 MB MOV) Click here for additional data file. Movie S6 Higher resolution x, y and z orthoslices of the SBF/SEM dataset in Movie S4 focusing on the dorsal lateral anastomotic vessel in Fig. 5 (movie created in Imaris software). (2.50 MB MOV) Click here for additional data file.
📊 Figures
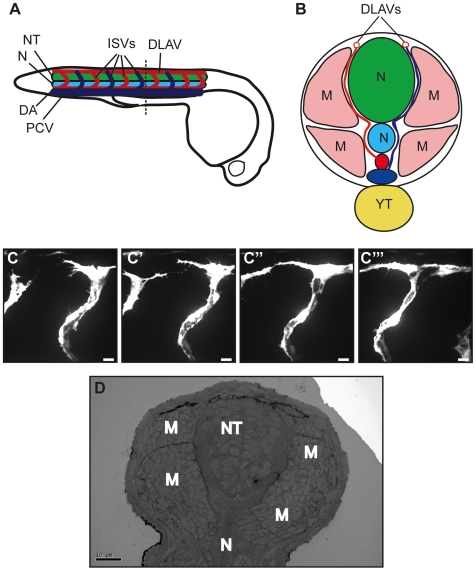
Figure 1
Preliminary studies of anastomosis in zebrafish.
(A) Longitudinal diagram of 48 hpf zebrafish embryo, with neural tube (NT, green), notochord (N, turquoise), posterior cardinal vein (PCV, dark blue), dorsal aorta (DA, red), intersegmental vessels (I...
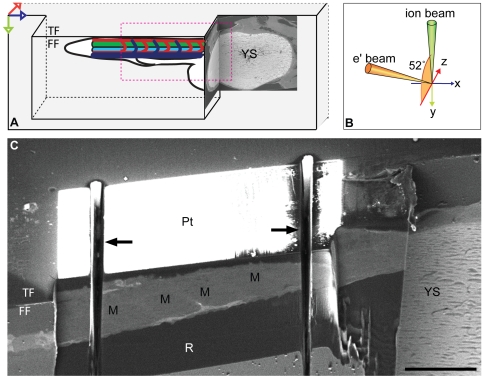
Figure 2
Sample preparation for FIB/SEM of zebrafish.
(A) Diagram showing orientation of the zebrafish after resin embedding and trimming with a diamond knife. The AOI in the zebrafish tail is placed in an overhang of resin to optimise milling and mimise...
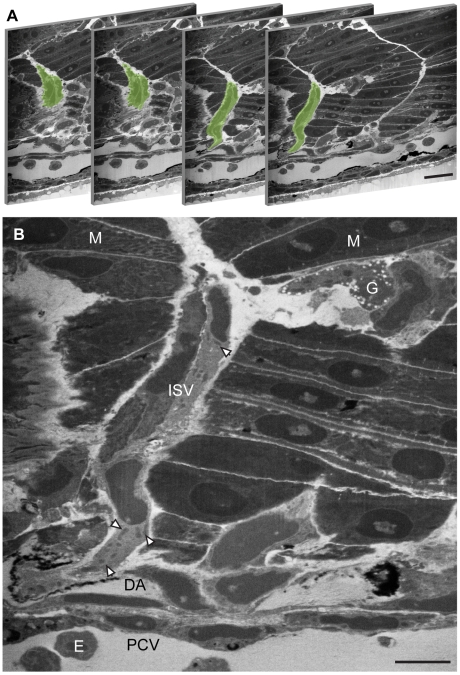
Figure 3
Localisation of the intersegmental vessels by FIB/SEM.
(A) FIB/SEM sections of a 32 hpf zebrafish embryo trunk with the ISV highlighted in green. Slices are non-consecutive sections 661, 669, 687 and 691 where one slice is 50 nm thick. (B) The pericardina...
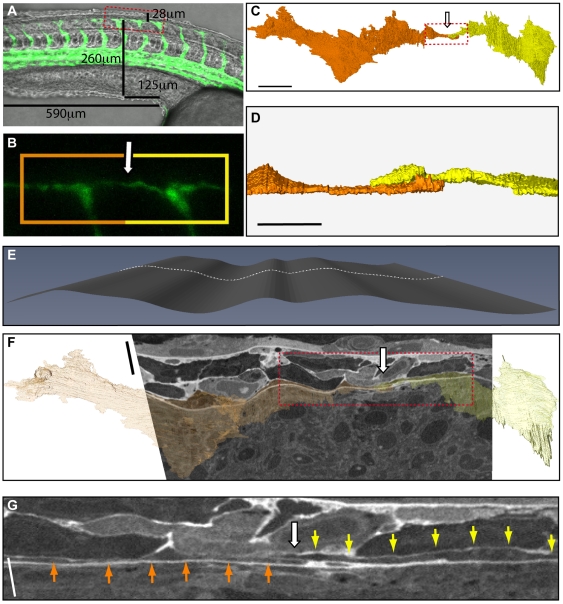
Figure 4
Anastomosis of the dorsal lateral anastomotic vessel.
(A) Still from live confocal imaging of a 28 hpf Tg( fli1 : EGFP) y1 transgenic zebrafish at the point of anastomosis of filopodia from adjacent ISVs, overlaid on a phase image of the zebrafish. Measu...
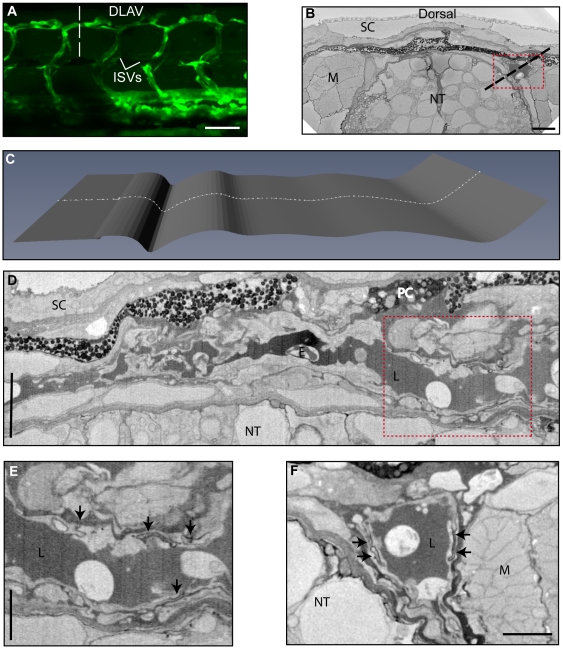
Figure 5
Ultrastructure of the formed dorsal lateral anastomotic vessel.
(A) Confocal projecion of 72 hpf Tg( fli1 : EGFP) y1 transgenic zebrafish showing the fully formed DLAV. (B) Transverse section through 3View SBF/SEM dataset showing both DLAVs (dashed line in (A)). S...
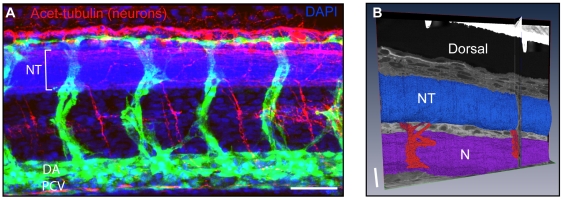
Figure 6
3D reconstruction of neuronal projections in a FIB/SEM dataset originally collected for a vascular study.
(A) 48 hpf Tg( fli1 : EGFP) y1 transgenic zebrafish displaying formed ISVs and DLAV (green) which grow around and over the NT (blue, DAPI staining). The DLAV lies underneath bundles of neurofilaments ...
Figure images are served from the NIH/NLM PubMed Central Open Access Subset or Europe PMC; copyright remains with the publishers and authors.
💬 Discussion
0 commentsNo comments yet. Be the first to start a discussion!
Leave a Comment