Abstract
AIMS: Magnetic resonance (MR) imaging is widely used for diagnostic imaging in medicine as it is considered a safe alternative to ionizing radiation-based techniques. Recent reports on potential genotoxic effects of strong and fast switching electromagnetic gradients such as used in cardiac MR (CMR) have raised safety concerns. The aim of this study was to analyse DNA double-strand breaks (DSBs) in human blood lymphocytes before and after CMR examination. METHODS AND RESULTS: In 20 prospectively enrolled patients, peripheral venous blood was drawn before and after 1.5 T CMR scanning. After density gradient cell separation of blood samples, DNA DSBs in lymphocytes were quantified using immunofluorescence microscopy and flow cytometric analysis. Wilcoxon signed-rank testing was used for statistical analysis. Immunofluorescence microscopic and flow cytometric analysis revealed a significant increase in median numbers of DNA DSBs in lymphocytes induced by routine 1.5 T CMR examination. CONCLUSION: The present findings indicate that CMR should be used with caution and that similar restrictions may apply as for X-ray-based and nuclear imaging techniques in order to avoid unnecessary damage of DNA integrity with potential carcinogenic effect.
🔬 Techniques
🔭 Microscopes
✨ Fluorophores
🧪 Sample Preparation
🏭 Microscope Brands
🧪 Reagent Suppliers
💻 Software Details
🏛️ Research Organizations (ROR)
Affiliated research institutions:
📋 Methods
Methods and results In 20 prospectively enrolled patients, peripheral venous blood was drawn before and after 1.5 T CMR scanning. After density gradient cell separation of blood samples, DNA DSBs in lymphocytes were quantified using immunofluorescence microscopy and flow cytometric analysis. Wilcoxon signed-rank testing was used for statistical analysis. Immunofluorescence microscopic and flow cytometric analysis revealed a significant increase in median numbers of DNA DSBs in lymphocytes induced by routine 1.5 T CMR examination.
Methods
Twenty consecutive patients referred for cardiac evaluation were included. After obtaining written informed consent, 10 mL of peripheral blood was drawn before and after undergoing routine contrast (gadobutrolum, Gadovist, Bayer Schering Pharma, Germany) enhanced CMR examination 18 on a 1.5 T MR scanner (Philips Achieva, Best, NL, USA) as approved by the local ethics committee (KEK-Nr. 849). PBMCs were obtained using density gradient separation (Histopaque 1077, Sigma-Aldrich) as previously established. 19 The clinical CMR protocol used in our daily routine has been recently reported in detail. 20 In brief, a commercially available MR scanner (Philips 1.5 T, Achieva, software release 3.2.1) equipped with a maximum gradient strength of 42 mT/m and a maximum gradient speed of 180 mT/m/ms was used. The following standard pulse sequences to generate images were used: gradient echo, steady-state free precession, FastSE, T 2 -weighted double-inversion black-blood spin-echo sequence for oedema imaging, balanced SSFP sequence for perfusion and inversion recovery segmented gradient echo sequence for late gadolinium enhancement. DSBs were detected by immunofluorescence microscopy using a rabbit-anti-human phospho-histone γ-H2AX and a goat-anti-rabbit-AlexaFluor-488 antibody (CST Cell Signalling Technology, adapted from May et al . 21 ). Cell nuclei were counterstained with 4′,6-diamidino-2-phenylindole (DAPI, Vector Laboratories) and the γ-H2AX foci per lymphocyte were visualized on an inverse confocal microscope (CLSM-Model SP5, Leica Microsystems) and quantified by a blinded observer. With flow cytometry (FACScanto, BD Bioscience), DSBs were additionally quantified in T-lymphocytes 22 , 23 previously identified by a mouse-anti-human CD3-APC antibody (Life Technologies). Based on forward and side light scattering, PBMCs were gated for viable single-cell events and proper compensation controls were used in flow cytometric analyses to correct for spectral overlap.
Show full methods section
Methods and results In 20 prospectively enrolled patients, peripheral venous blood was drawn before and after 1.5 T CMR scanning. After density gradient cell separation of blood samples, DNA DSBs in lymphocytes were quantified using immunofluorescence microscopy and flow cytometric analysis. Wilcoxon signed-rank testing was used for statistical analysis. Immunofluorescence microscopic and flow cytometric analysis revealed a significant increase in median numbers of DNA DSBs in lymphocytes induced by routine 1.5 T CMR examination.
Methods
Twenty consecutive patients referred for cardiac evaluation were included. After obtaining written informed consent, 10 mL of peripheral blood was drawn before and after undergoing routine contrast (gadobutrolum, Gadovist, Bayer Schering Pharma, Germany) enhanced CMR examination 18 on a 1.5 T MR scanner (Philips Achieva, Best, NL, USA) as approved by the local ethics committee (KEK-Nr. 849). PBMCs were obtained using density gradient separation (Histopaque 1077, Sigma-Aldrich) as previously established. 19 The clinical CMR protocol used in our daily routine has been recently reported in detail. 20 In brief, a commercially available MR scanner (Philips 1.5 T, Achieva, software release 3.2.1) equipped with a maximum gradient strength of 42 mT/m and a maximum gradient speed of 180 mT/m/ms was used. The following standard pulse sequences to generate images were used: gradient echo, steady-state free precession, FastSE, T 2 -weighted double-inversion black-blood spin-echo sequence for oedema imaging, balanced SSFP sequence for perfusion and inversion recovery segmented gradient echo sequence for late gadolinium enhancement. DSBs were detected by immunofluorescence microscopy using a rabbit-anti-human phospho-histone γ-H2AX and a goat-anti-rabbit-AlexaFluor-488 antibody (CST Cell Signalling Technology, adapted from May et al . 21 ). Cell nuclei were counterstained with 4′,6-diamidino-2-phenylindole (DAPI, Vector Laboratories) and the γ-H2AX foci per lymphocyte were visualized on an inverse confocal microscope (CLSM-Model SP5, Leica Microsystems) and quantified by a blinded observer. With flow cytometry (FACScanto, BD Bioscience), DSBs were additionally quantified in T-lymphocytes 22 , 23 previously identified by a mouse-anti-human CD3-APC antibody (Life Technologies). Based on forward and side light scattering, PBMCs were gated for viable single-cell events and proper compensation controls were used in flow cytometric analyses to correct for spectral overlap.
Data from flow cytometric quantification
(MFI, geometric mean of fluorescence intensity of γ-H2AXpositive T-lymphocytes) was evaluated using FlowJo software (V10.0.2, Tree Star, Inc.). Based on a variation of γ-H2AX assessment at 20% as reported by Muslimovic et al ., 22 an average difference in γ-H2AX findings reported in ex vivo experiments, 4 aiming at alpha = 0.05 and a power (1 − β ) of 0.8, the number of patients necessary was calculated between 10 and 15. SPSS 20.0 (SPSS, Chicago, IL, USA) was used for all statistical analysis. The Shapiro–Wilk test was applied to exclude normal distribution of data sets. This was followed by testing for significant differences between DSBs before and after CMR examination by using the Wilcoxon signed-rank test. P -values of
📊 Figures
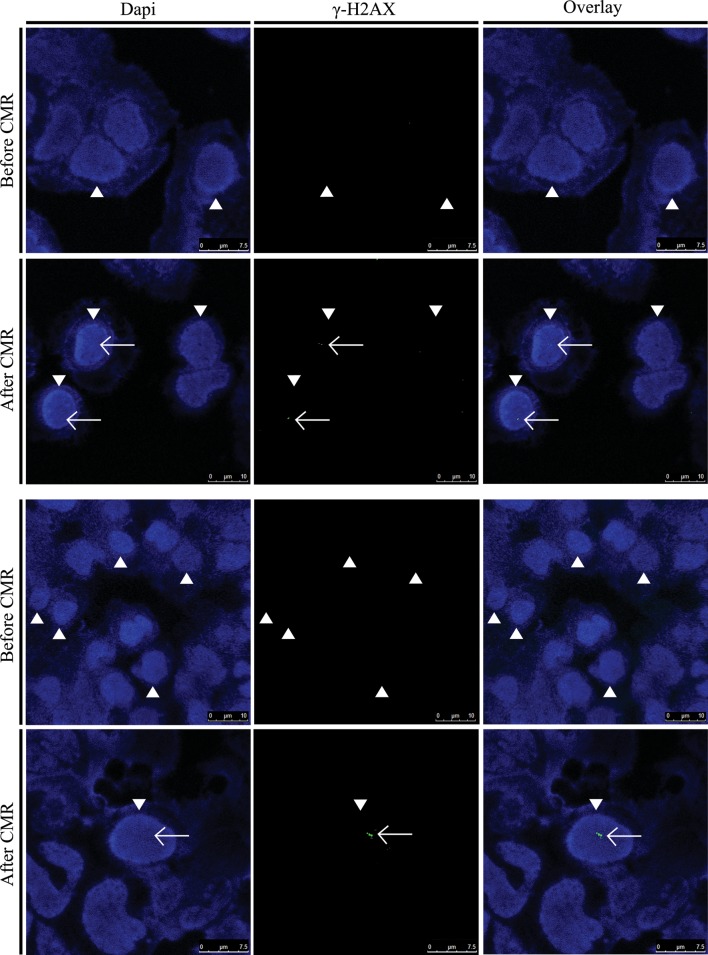
Figureu00a01
Visualization of double-strand breaks (DSBs) in nuclei (arrow heads) of human lymphocytes of two patients before and after cardiac magnetic resonance scans by immunofluorescence microscopy. DSBs (foci...
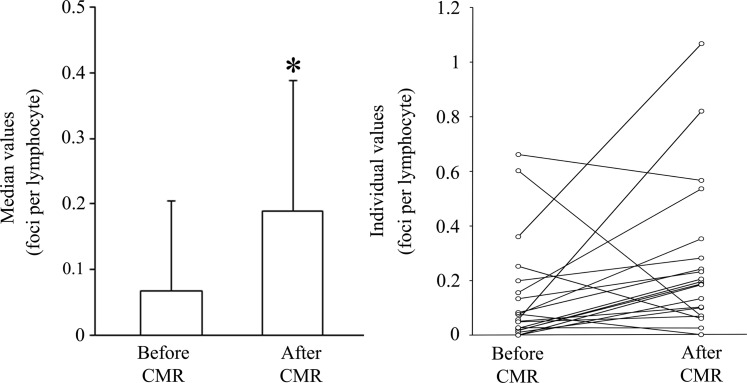
Figureu00a02
Amount of double-strand breaks before and after cardiac magnetic resonance (CMR) scan by immunofluorescence microscopy. After CMR scanning, there was a significant increase (* P < 0.05) in u03b3-H2...
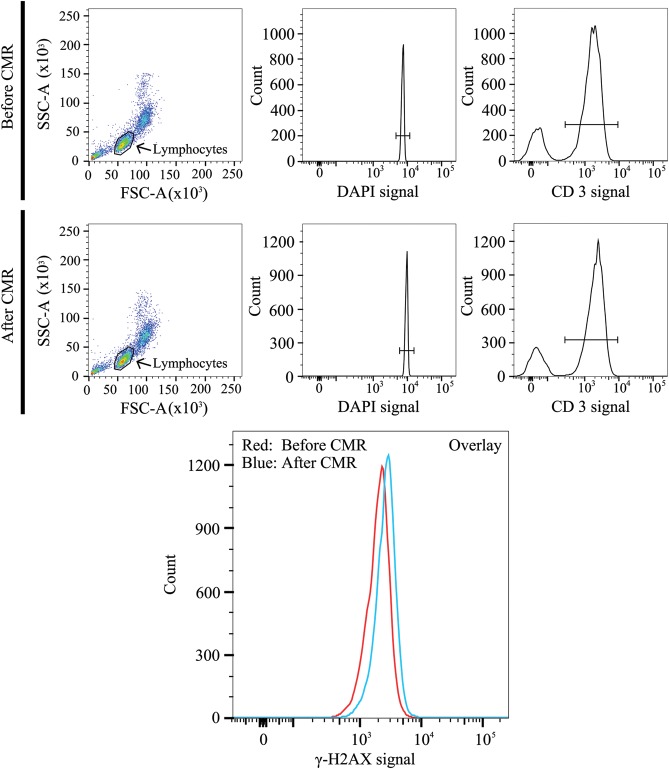
Figureu00a03
Flow cytometric analysis of double-strand breaks (u03b3-H2AXpositive T-lymphocytes) before and after cardiac magnetic resonance (CMR) scan. T-lymphocytes were readily identified by representative dot ...
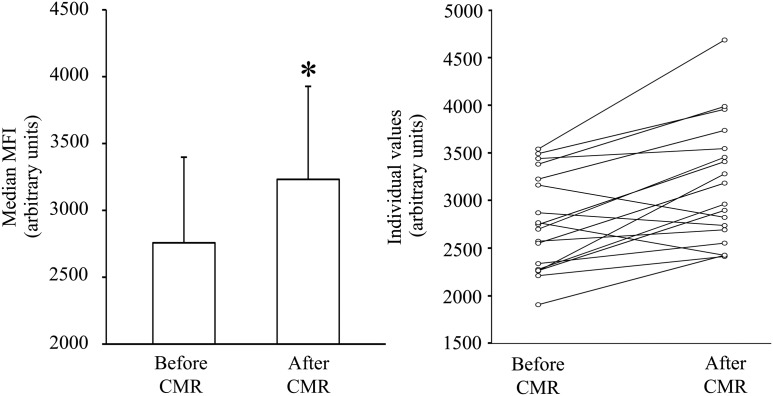
Figureu00a04
Amount of double-strand breaks before and after cardiac magnetic resonance scan by flow cytometry of u03b3-H2AXpositive T-lymphocytes using geometric mean fluorescence intensity (MFI). The median MFI ...
Figure images are served from the NIH/NLM PubMed Central Open Access Subset or Europe PMC; copyright remains with the publishers and authors.
💬 Discussion
0 commentsNo comments yet. Be the first to start a discussion!
Leave a Comment