Abstract
AbstractChronic wounds are difficult to diagnose and characterize due to a lack of quantitative biomarkers. Label-free multiphoton microscopy has emerged as a useful imaging modality capable of quantifying changes in cellular metabolism using an optical redox ratio of FAD/(NADH+FAD) autofluorescence. However, the utility of an optical redox ratio for long-term in vivo monitoring of tissue metabolism has not been robustly evaluated. In this study, we demonstrate how multiphoton microscopy can be used to monitor changes in the metabolism of individual full-thickness skin wounds in vivo. 3D optical redox ratio maps and NADH fluorescence lifetime images identify differences between diabetic and control mice during the re-epithelialization of wounds. These metabolic changes are associated with a transient increase in keratinocyte proliferation at the wound edge. Our study demonstrates that high-resolution, non-invasive autofluorescence imaging can be performed in vivo and that optical redox ratios can serve as quantitative optical biomarkers of impaired wound healing.
🔬 Techniques
🔭 Microscopes
💻 Software
✨ Fluorophores
🧪 Sample Preparation
🔬 Cell Lines
🏭 Microscope Brands
🧪 Reagent Suppliers
📷 Detectors
🎨 Filters
💻 Software Details
💻 Code & Software
💾 Data Repositories
🏛️ Research Organizations (ROR)
Affiliated research institutions:
📋 Methods
Animal model of wound healing
All experiments were approved and performed according to the University of Arkansas IACUC (Protocol #16001). C57BL/6J mice (6 weeks; male) were divided into two groups and received daily intraperitoneal injections of either 50 mg/kg streptozotocin ( n = 19) or buffer control ( n = 18) for 5 days. Blood glucose was monitored in all mice with a ReliOn™ Blood Glucose monitor bi-weekly. Mice exhibiting blood glucose levels above 250 mg/dL after a 5-h fast were considered diabetic. Diabetic mice that were exhibiting a weight loss of 10% were given insulin at a dose of 0.1 units (if BG350 mg/dL). At 12 weeks of age, the mice were anaesthetized for surgery with 2–5% isoflurane for induction and then maintained at 1–3%. On the day of wounding, the control group had a mean blood glucose of 129 ± 29 mg/dL while the diabetic group had a mean blood glucose of 454 ± 102 mg/dL. Mice were given carprofen (5 mg/kg, s.c.), and 6 mm full-thickness, excisional wounds were produced on the dorsum using a sterile biopsy punch. Excised tissue was flash frozen in Tissue-Tek ® optimal cutting temperature compound (Sakura Finetek; Tokyo, Japan) at −80 °C. Wound sizes were traced onto acetate paper at day 0 and at each imaging time point throughout the study to quantify closure. Tracings were digitized, and wound size was computed in MATLAB based on a normalized value relative to day 0. All wounds were bandaged with a primary covering of Tegaderm™ (3M; Maplewood, Maine) and secondary layer of surgical tape. In vivo multiphoton-excited fluorescence intensity imaging Mice were placed under anesthesia and imaged on days 1, 3, 5, 7, and 10 post wounding for periods of no longer than 90 min. Three image stacks were collected at the wound edge (superior, inferior, and right lateral edge) per day using a Bruker Ultima Investigator laser scanning microscope (Middleton, Wisconsin) and Ti:sapphire laser (Spectra-Physics; Santa Clara, California). All images were acquired with a 20x, 1.0 NA water-immersion objective (Olympus; Tokyo, Japan). Fluorescence emission was collected using a 680 nm low-pass filter (Chroma, ET680sp-2p). A dichroic mirror at 495 nm (Chroma, T495lpxr) separated light into two GaAsP photomultiplier tubes (PMTs) (Hamamatsu; H10770PB-40). NADH autofluorescence was collected with one PMT using a 460 (±20) nm filter (Chroma, ET460/40m-2p) 40 and 755 nm excitation. FAD autofluorescence was acquired at 900 nm excitation using the second PMT with a 525 (±25) nm emission filter (Chroma, ET525/50m-2p) to minimize contributions from NADH 62 . Second harmonic generation (SHG) signal was collected in the 460 nm channel at 900 nm. Z-stacks were acquired at three locations on the wound edge per animal consisting of images (512 × 512 pixels; 584 × 584 µm; 13-bit depth) taken en face from the top of the epithelium to a depth of 250 µm in increments of 5 µm. Rapid image acquisition (~70 ms per image slice; 3.5 s per stack) utilizing a piezo motor and 8 kHz resonant galvanometric scanning system was employed allowing for 50 sequential image stacks to be acquired in ~6–7 min for a given location. This high-speed acquisition limited motion artifacts to a small subset of the total acquired images, which could be removed later during image processing. Pixel dwell times during resonant scanning were 0.4 µs, and the cumulative pixel dwell time resulting from the acquisition of 50 z-stacks was 20 µs. Incident power never exceeded 50 mW at any depth.
Show full methods section
Animal model of wound healing
All experiments were approved and performed according to the University of Arkansas IACUC (Protocol #16001). C57BL/6J mice (6 weeks; male) were divided into two groups and received daily intraperitoneal injections of either 50 mg/kg streptozotocin ( n = 19) or buffer control ( n = 18) for 5 days. Blood glucose was monitored in all mice with a ReliOn™ Blood Glucose monitor bi-weekly. Mice exhibiting blood glucose levels above 250 mg/dL after a 5-h fast were considered diabetic. Diabetic mice that were exhibiting a weight loss of 10% were given insulin at a dose of 0.1 units (if BG350 mg/dL). At 12 weeks of age, the mice were anaesthetized for surgery with 2–5% isoflurane for induction and then maintained at 1–3%. On the day of wounding, the control group had a mean blood glucose of 129 ± 29 mg/dL while the diabetic group had a mean blood glucose of 454 ± 102 mg/dL. Mice were given carprofen (5 mg/kg, s.c.), and 6 mm full-thickness, excisional wounds were produced on the dorsum using a sterile biopsy punch. Excised tissue was flash frozen in Tissue-Tek ® optimal cutting temperature compound (Sakura Finetek; Tokyo, Japan) at −80 °C. Wound sizes were traced onto acetate paper at day 0 and at each imaging time point throughout the study to quantify closure. Tracings were digitized, and wound size was computed in MATLAB based on a normalized value relative to day 0. All wounds were bandaged with a primary covering of Tegaderm™ (3M; Maplewood, Maine) and secondary layer of surgical tape. In vivo multiphoton-excited fluorescence intensity imaging Mice were placed under anesthesia and imaged on days 1, 3, 5, 7, and 10 post wounding for periods of no longer than 90 min. Three image stacks were collected at the wound edge (superior, inferior, and right lateral edge) per day using a Bruker Ultima Investigator laser scanning microscope (Middleton, Wisconsin) and Ti:sapphire laser (Spectra-Physics; Santa Clara, California). All images were acquired with a 20x, 1.0 NA water-immersion objective (Olympus; Tokyo, Japan). Fluorescence emission was collected using a 680 nm low-pass filter (Chroma, ET680sp-2p). A dichroic mirror at 495 nm (Chroma, T495lpxr) separated light into two GaAsP photomultiplier tubes (PMTs) (Hamamatsu; H10770PB-40). NADH autofluorescence was collected with one PMT using a 460 (±20) nm filter (Chroma, ET460/40m-2p) 40 and 755 nm excitation. FAD autofluorescence was acquired at 900 nm excitation using the second PMT with a 525 (±25) nm emission filter (Chroma, ET525/50m-2p) to minimize contributions from NADH 62 . Second harmonic generation (SHG) signal was collected in the 460 nm channel at 900 nm. Z-stacks were acquired at three locations on the wound edge per animal consisting of images (512 × 512 pixels; 584 × 584 µm; 13-bit depth) taken en face from the top of the epithelium to a depth of 250 µm in increments of 5 µm. Rapid image acquisition (~70 ms per image slice; 3.5 s per stack) utilizing a piezo motor and 8 kHz resonant galvanometric scanning system was employed allowing for 50 sequential image stacks to be acquired in ~6–7 min for a given location. This high-speed acquisition limited motion artifacts to a small subset of the total acquired images, which could be removed later during image processing. Pixel dwell times during resonant scanning were 0.4 µs, and the cumulative pixel dwell time resulting from the acquisition of 50 z-stacks was 20 µs. Incident power never exceeded 50 mW at any depth.
Image processing of 3D wound edge z-stacks
Fluorescence intensity images from all 50 image z-stacks were processed to remove images that contained motion artifact(s) and register stacks. The 50 intensity image stacks of the same excitation and location were averaged together with respect to depth to create an initial average intensity z-stack (Supplementary Fig. 1a ). The individual images at a given depth in each of the 50 stacks were registered to the corresponding slice from the initial averaged stack using 2D cross correlation (Supplementary Fig. 1b ). The cross-correlation maximums for each image were found and used to calculate a mean and standard deviation for the correlation at each depth in the 50 stacks. Any image with a cross-correlation value lower than one standard deviation of the mean correlation of the 50 images was then removed. An average of 7.7 ± 0.5% of the images were discarded per stack. The remaining images were registered and averaged together to form final high-contrast image stacks of NADH TPEF, FAD/keratin TPEF, and collagen SHG which enabled resolution of individual cells in vivo without mechanically restraining the tissue (Supplementary Fig. 1b ). The final averaged image stacks of the 755 nm ex./460 nm em. channel (NADH TPEF) and 900 nm ex./525 nm em. channel (FAD/keratin TPEF) were registered together using a 3D cross-correlation algorithm and combined to create the final high-contrast in vivo wound edge stacks (Supplementary Fig. 1c ; Supplementary Movie 1 ). Fluorescence intensities from the averaged stacks were normalized by laser power and PMT gain calibrated to µM concentrations of fluorescein in Tris buffer (pH 8) as described in previous studies 14 , 22 . Briefly, concentrations of fluorescein ranging from 0.1 µM to 20 µM were used to establish a power-law relationship between PMT voltage and power-normalized image intensity, allowing for corrections in any differences in PMT voltage across days. Laser power readings were acquired for normalization at every imaging time point to account for any day-to-day variability. Pixel-wise calculations of an optical redox ratio of [FAD/(NADH+FAD)] were computed using these normalized fluorescent intensities. Resulting redox ratio values were assigned to a jet color map in MATLAB for visualization (see Figs. 2 , 3 ). The keratinocyte region within the stack was digitized using a manual tracing function in MATLAB to produce a mask of the epithelium based on the intensity image stack. The epithelial region was defined as the area between the stratum corneum and dermal collagen containing only keratinocytes. Autofluorescence from hair and hair follicles was avoided when tracing the region of interest by avoiding the region surrounding hair fluorescence within a 5–10 pixel radius. The average epithelial redox ratio for each z-stack at the wound edge was calculated from the redox ratio values within the traced regions of interest in the images at 1/4, 1/2, and 3/4 total stack depth. In vivo FLIM NADH fluorescence lifetime data was collected at a depth corresponding to the midpoint of each image stack. Images were collected with a pixel dwell time of 4.8 µs using a standard (non-resonant) galvanometric scanning system. Integration time for the lifetime images was set to 2 min. Time-resolved data were processed using SPCImage 6.4 (Becker & Hickl Gmbh; Berlin, Germany). For processing, an instrument response function for the system was measured using the second harmonic signal of urea crystals. The full width at half maximum of the instrument response function was 0.25 ns. FLIM images were spatially binned twice to get total pixel photon counts of at least 10,000 in the pixels within the epithelial edge, and an incomplete multi-exponential model was chosen. Fits were generated using the measured instrument response function and a bi-exponential decay model to separate the long ( A 2) and short ( A 1) lifetime components of bound and free NADH, respectively 13 , 34 . Images with χ ² values of
📊 Figures
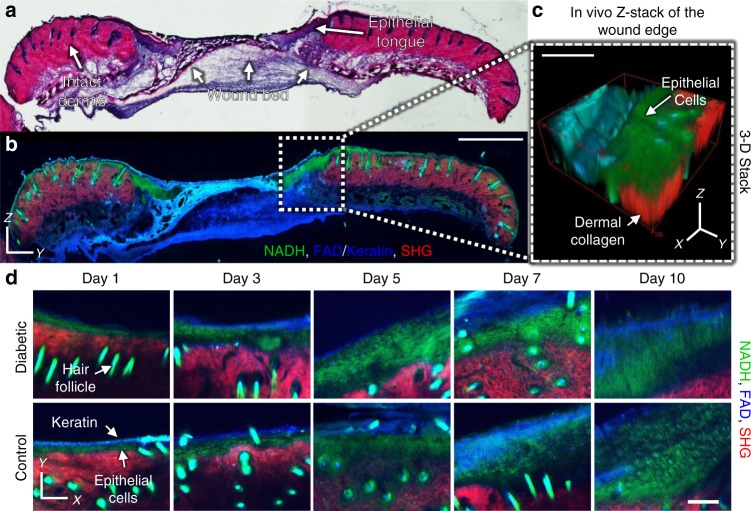
Fig. 1
Comparison of in vivo MPM imaging at the wound edge with ex vivo tissue sections. a Hematoxylin and eosin stained tissue sections at 5 days post-wounding reveal distinct skin wound regions such as the...
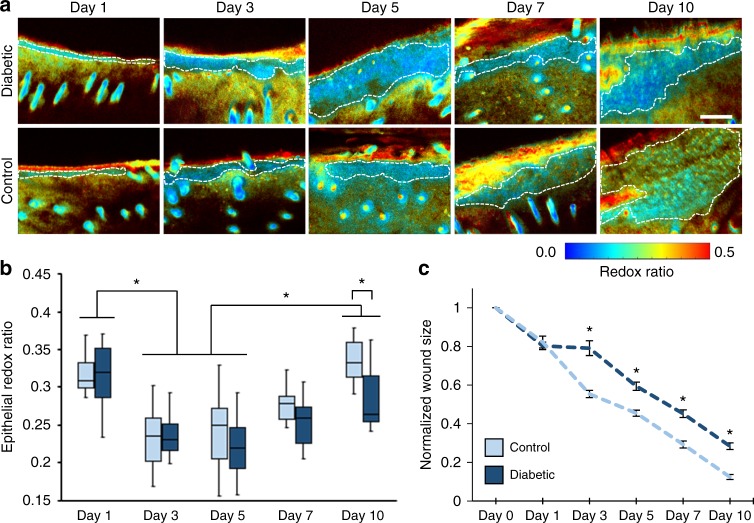
Fig. 2
Optical redox ratio of the wound edge changes over time. a In vivo redox ratio maps of FAD/(NADH+FAD) were generated from the normalized fluorescence intensities. The representative optical sections f...
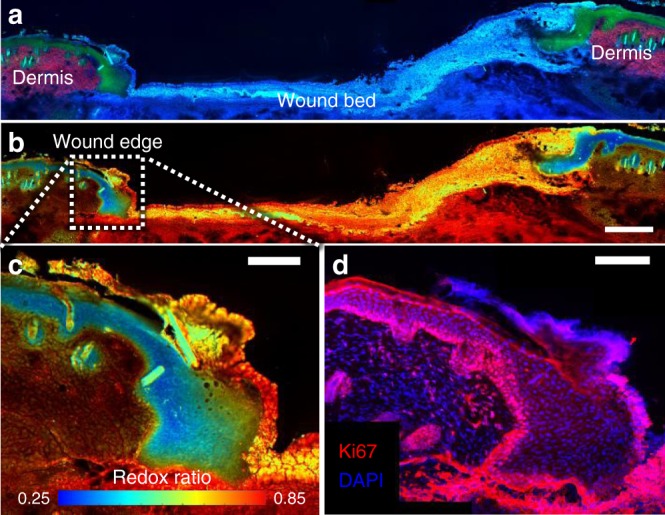
Fig. 3
Spatial patterns in the optical redox ratio of the epithelial tongue indicate a sensitivity to proliferation. a Keratinocytes in the epithelial tongue of unstained wound sections, distinct from dermal...
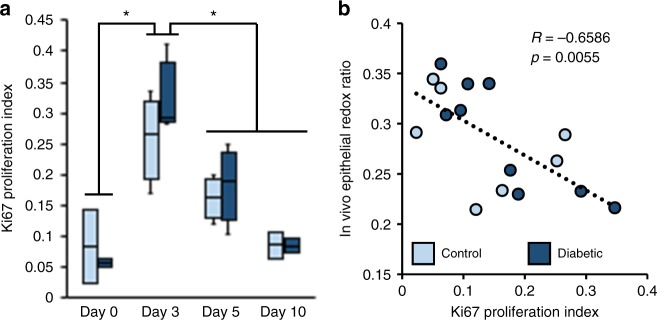
Fig. 4
A quantitative proliferation index is correlated with in vivo optical redox ratio measurements. a A proliferation index measuring the ratio of DAPI-stained cells expressing Ki67 in the epithelial tong...
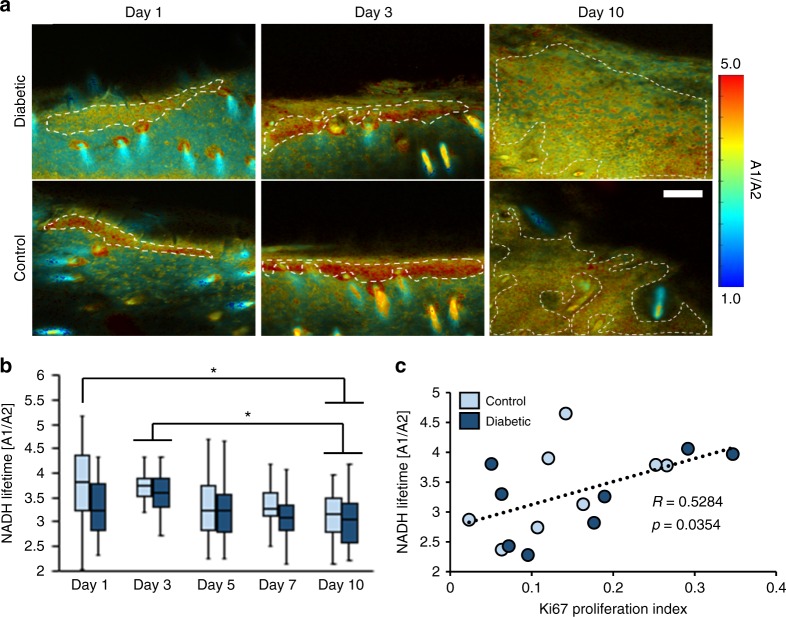
Fig. 5
FLIM data from diabetic and control wound edges indicate changes in the ratio of free (A1) and protein-bound (A2) NADH lifetime components. a Representative maps of A1/A2 demonstrate changes in free-t...
Figure images are served from the NIH/NLM PubMed Central Open Access Subset or Europe PMC; copyright remains with the publishers and authors.
💬 Discussion
0 commentsNo comments yet. Be the first to start a discussion!
Leave a Comment