Abstract
Influenza A virus (IAV) enters cells by binding to sialic acid on the cell surface. To accomplish this while avoiding immobilization by sialic acid in host mucus, viruses rely on a balance between the receptor-binding protein hemagglutinin (HA) and the receptor-cleaving protein neuraminidase (NA). Although genetic aspects of this balance are well-characterized, little is known about how the spatial organization of these proteins in the viral envelope may contribute. Using site-specific fluorescent labeling and super-resolution microscopy, we show that HA and NA are asymmetrically distributed on the surface of filamentous viruses, creating a spatial organization of binding and cleaving activities that causes viruses to step consistently away from their NA-rich pole. This Brownian ratchet-like diffusion produces persistent directional mobility that resolves the virus's conflicting needs to both penetrate mucus and stably attach to the underlying cells, potentially contributing to the prevalence of the filamentous phenotype in clinical isolates of IAV.
🔬 Techniques
🧬 Organisms
💻 Software
✨ Fluorophores
🧪 Sample Preparation
🔬 Cell Lines
🏭 Microscope Brands
🧪 Reagent Suppliers
🎨 Filters
💻 Software Details
💾 Data Repositories
🏷️ Research Resource Identifiers (RRIDs)
Verified research resources used in this paper:
🏛️ Research Organizations (ROR)
Affiliated research institutions:
📋 Methods
Key resources table
Reagent type (species) or resource Designation Source or reference Identifiers Additional information Cell line ( C. familiaris ) MDCK-II UC Berkeley Cell Culture Facility https://bds.berkeley.edu/facilities/cell-culture Cell line ( H. sapiens ) Calu-3 UC Berkeley Cell Culture Facility https://bds.berkeley.edu/facilities/cell-culture Cell line ( H. sapiens ) HEK293T UC Berkeley Cell Culture Facility https://bds.berkeley.edu/facilities/cell-culture Antibody anti-Muc5AC Thermo Fisher RRID: AB_10978001 , Cat. #: MA5-12178 IF (1:400) Antibody (lectin) FITC-labeled Erythrina cristagalli lectin (ECL) Vector RRID: AB_2336437 , Cat. #: FL-1141 IF (1:1000) Recombinant DNA reagent pcDNA3.1+vHA(G5) ( Vahey and Fletcher, 2019 ) Recombinant DNA reagent pcDNA3.1+vHA ( Vahey and Fletcher, 2019 ) Recombinant DNA reagent pcDNA3.1+vNA(ybbR) ( Vahey and Fletcher, 2019 ) Recombinant DNA reagent pcDNA3.1+vNAΔCT(ybbR) This paper Vector shown schematically in Figure 3—figure supplement 1A Recombinant DNA reagent pcDNA3.1+vNA ( Vahey and Fletcher, 2019 ) Recombinant DNA reagent pcDNA3.1+vNP(FlAsH) ( Vahey and Fletcher, 2019 ) Recombinant DNA reagent pcDNA3.1+vNP ( Vahey and Fletcher, 2019 ) Recombinant DNA reagent pcDNA3.1+vM (Ud M1) ( Vahey and Fletcher, 2019 ) Recombinant DNA reagent pcDNA3.1+vN ( Vahey and Fletcher, 2019 ) Recombinant DNA reagent pcDNA3.1+vPA ( Vahey and Fletcher, 2019 ) Recombinant DNA reagent pcDNA3.1+vPB1 ( Vahey and Fletcher, 2019 ) Recombinant DNA reagent pcDNA3.1+vPB2 ( Vahey and Fletcher, 2019 ) Peptide, recombinant protein Streptavidin Thermo Fisher Cat. #: 434302 Peptide, recombinant protein Neuraminidase from Clostridium perfringens Sigma Cat. #: N2876 Peptide, recombinant protein Fetuin from fetal bovine serum Sigma Cat. #: F3004 Peptide, recombinant protein CLPETGG peptide Genscript Chemical compound, drug Alexa Fluor 555 maleimide Thermo Fisher Cat. #: A20346 Chemical compound, drug Alexa Fluor 647 maleimide Thermo Fisher Cat. #: A20347 Chemical compound, drug CF568 maleimide Biotium Cat. #: 92024 Chemical compound, drug FlAsH-EDT2 Toronto Research Chemicals Cat. #: F335200 Software Matlab Mathworks Culturing and labeling virus Strains of influenza A virus amenable to site specific labeling on HA, NA, and NP were designed and characterized as described previously ( Vahey and Fletcher, 2019 ). Briefly, viruses expressing HA with five consecutive glycine residues following the signal sequence (for labeling via Sortase A [ Theile et al., 2013 ]), NA with a c-terminal ybbR tag (for labeling via Sfp [ Yin et al., 2006 ]), and NP with a c-terminal tetracysteine motif (for labeling via direct binding of the biarsenical dye FlAsH [ Griffin et al., 1998 ]) were rescued using reverse genetics ( Hoffmann et al., 2000 ) by transfecting co-cultures of HEK293T and MDCK-II cells with plasmids encoding each of the eight genomic segments under the control of bidirectional promoters. Cells used in this work were obtained and authenticated by the UC Berkeley Cell Culture Facility and tested negative for mycoplasma. All viruses used in this work are derived from A/WSN/1933, with the WSN M1 gene replaced by that of A/Udorn/1972, to establish the filamentous phenotype. MDCK-II cells used to propagate virus were maintained in DMEM supplemented with 10% fetal bovine serum (Thermo Fisher, 10438026) and 1x penicillin/streptomycin (Thermo Fisher, 15140122). Prior to infection, confluent monolayers of cells were washed once with PBS, and serum-containing growth media was replaced with virus growth media (MEM, 0.25% BSA, 1 μg/ml TPCK-treated trypsin, and penicillin/streptomycin). Viruses used for experiments were collected from cells following infection at MOI ~ 1 and 16 hr of growth at 37°C in virus growth media. Media containing virus was collected, centrifuged at 2000 × g for five minutes to remove cell debris, and treated with 10mU/ml soluble sialidase (from C. Perfringens , Sigma N2876) to ensure that viruses were well dispersed. Viruses were labeled in solution for 90 min at room temperature using NTC buffer (100 nM NaCl, 20 mM Tris pH 7.6, 5 mM CaCl 2 ) supplemented with 5 mM MgCl 2 , Sortase A (180 µM enzyme, 50 µM CLPETGG peptide) and SFP synthase (5 µM enzyme, 5 µM CoA probe). Following labeling, Capto Core 700 beads (GE Healthcare;~1:1 resin volume to sample volume) were used to remove residual dyes and enzymes from the solution of labeled virus. For labeling NP with the biarsenical dye FlAsH, viruses were immobilized on coverslips, washed in NTC buffer, and incubated with 2 µM FlAsH for 30 min at room temperature. Virus photobleaching To qualitatively evaluate the mobility of HA and NA on the virion surface ( Figure 1B , Figure 3—figure supplement 2B ), unfixed, immobilized viruses were imaged using total internal reflectance (TIRF) microscopy. Filamentous virus of sufficient length (>5 μm) were positioned within the field of view such that when the field stop was closed, only approximately half of the virus was exposed to illumination. This half of the virus was then bleached using maximum laser power and then imaged at lower power at 30 s intervals as the field stop was opened to monitor recovery. Representative results are shown in Figure 1B and Figure 3—figure supplement 2B .
Show full methods section
Key resources table
Reagent type (species) or resource Designation Source or reference Identifiers Additional information Cell line ( C. familiaris ) MDCK-II UC Berkeley Cell Culture Facility https://bds.berkeley.edu/facilities/cell-culture Cell line ( H. sapiens ) Calu-3 UC Berkeley Cell Culture Facility https://bds.berkeley.edu/facilities/cell-culture Cell line ( H. sapiens ) HEK293T UC Berkeley Cell Culture Facility https://bds.berkeley.edu/facilities/cell-culture Antibody anti-Muc5AC Thermo Fisher RRID: AB_10978001 , Cat. #: MA5-12178 IF (1:400) Antibody (lectin) FITC-labeled Erythrina cristagalli lectin (ECL) Vector RRID: AB_2336437 , Cat. #: FL-1141 IF (1:1000) Recombinant DNA reagent pcDNA3.1+vHA(G5) ( Vahey and Fletcher, 2019 ) Recombinant DNA reagent pcDNA3.1+vHA ( Vahey and Fletcher, 2019 ) Recombinant DNA reagent pcDNA3.1+vNA(ybbR) ( Vahey and Fletcher, 2019 ) Recombinant DNA reagent pcDNA3.1+vNAΔCT(ybbR) This paper Vector shown schematically in Figure 3—figure supplement 1A Recombinant DNA reagent pcDNA3.1+vNA ( Vahey and Fletcher, 2019 ) Recombinant DNA reagent pcDNA3.1+vNP(FlAsH) ( Vahey and Fletcher, 2019 ) Recombinant DNA reagent pcDNA3.1+vNP ( Vahey and Fletcher, 2019 ) Recombinant DNA reagent pcDNA3.1+vM (Ud M1) ( Vahey and Fletcher, 2019 ) Recombinant DNA reagent pcDNA3.1+vN ( Vahey and Fletcher, 2019 ) Recombinant DNA reagent pcDNA3.1+vPA ( Vahey and Fletcher, 2019 ) Recombinant DNA reagent pcDNA3.1+vPB1 ( Vahey and Fletcher, 2019 ) Recombinant DNA reagent pcDNA3.1+vPB2 ( Vahey and Fletcher, 2019 ) Peptide, recombinant protein Streptavidin Thermo Fisher Cat. #: 434302 Peptide, recombinant protein Neuraminidase from Clostridium perfringens Sigma Cat. #: N2876 Peptide, recombinant protein Fetuin from fetal bovine serum Sigma Cat. #: F3004 Peptide, recombinant protein CLPETGG peptide Genscript Chemical compound, drug Alexa Fluor 555 maleimide Thermo Fisher Cat. #: A20346 Chemical compound, drug Alexa Fluor 647 maleimide Thermo Fisher Cat. #: A20347 Chemical compound, drug CF568 maleimide Biotium Cat. #: 92024 Chemical compound, drug FlAsH-EDT2 Toronto Research Chemicals Cat. #: F335200 Software Matlab Mathworks Culturing and labeling virus Strains of influenza A virus amenable to site specific labeling on HA, NA, and NP were designed and characterized as described previously ( Vahey and Fletcher, 2019 ). Briefly, viruses expressing HA with five consecutive glycine residues following the signal sequence (for labeling via Sortase A [ Theile et al., 2013 ]), NA with a c-terminal ybbR tag (for labeling via Sfp [ Yin et al., 2006 ]), and NP with a c-terminal tetracysteine motif (for labeling via direct binding of the biarsenical dye FlAsH [ Griffin et al., 1998 ]) were rescued using reverse genetics ( Hoffmann et al., 2000 ) by transfecting co-cultures of HEK293T and MDCK-II cells with plasmids encoding each of the eight genomic segments under the control of bidirectional promoters. Cells used in this work were obtained and authenticated by the UC Berkeley Cell Culture Facility and tested negative for mycoplasma. All viruses used in this work are derived from A/WSN/1933, with the WSN M1 gene replaced by that of A/Udorn/1972, to establish the filamentous phenotype. MDCK-II cells used to propagate virus were maintained in DMEM supplemented with 10% fetal bovine serum (Thermo Fisher, 10438026) and 1x penicillin/streptomycin (Thermo Fisher, 15140122). Prior to infection, confluent monolayers of cells were washed once with PBS, and serum-containing growth media was replaced with virus growth media (MEM, 0.25% BSA, 1 μg/ml TPCK-treated trypsin, and penicillin/streptomycin). Viruses used for experiments were collected from cells following infection at MOI ~ 1 and 16 hr of growth at 37°C in virus growth media. Media containing virus was collected, centrifuged at 2000 × g for five minutes to remove cell debris, and treated with 10mU/ml soluble sialidase (from C. Perfringens , Sigma N2876) to ensure that viruses were well dispersed. Viruses were labeled in solution for 90 min at room temperature using NTC buffer (100 nM NaCl, 20 mM Tris pH 7.6, 5 mM CaCl 2 ) supplemented with 5 mM MgCl 2 , Sortase A (180 µM enzyme, 50 µM CLPETGG peptide) and SFP synthase (5 µM enzyme, 5 µM CoA probe). Following labeling, Capto Core 700 beads (GE Healthcare;~1:1 resin volume to sample volume) were used to remove residual dyes and enzymes from the solution of labeled virus. For labeling NP with the biarsenical dye FlAsH, viruses were immobilized on coverslips, washed in NTC buffer, and incubated with 2 µM FlAsH for 30 min at room temperature. Virus photobleaching To qualitatively evaluate the mobility of HA and NA on the virion surface ( Figure 1B , Figure 3—figure supplement 2B ), unfixed, immobilized viruses were imaged using total internal reflectance (TIRF) microscopy. Filamentous virus of sufficient length (>5 μm) were positioned within the field of view such that when the field stop was closed, only approximately half of the virus was exposed to illumination. This half of the virus was then bleached using maximum laser power and then imaged at lower power at 30 s intervals as the field stop was opened to monitor recovery. Representative results are shown in Figure 1B and Figure 3—figure supplement 2B .
STORM imaging and analysis
Samples for STORM imaging were prepared by binding labeled virus to antibody or sialic acid (i.e. fetuin) functionalized coverslips for one hour at 4°C, followed by the incubation of Dragon Green-labeled 220nm-diameter streptavidin coated beads. Viruses and beads were then fixed to the surfaces with 4% paraformaldehyde in PBS and washed 3x with buffer containing 1M Tris pH 8.0, 5% glucose, and 140 mM β-mercaptoethanol. Following these washes, the buffer was supplemented with glucose oxidase and catalase to final concentrations of 0.6 mg/ml and 0.035 mg/ml, respectively, and mounted on the microscope for imaging. STORM data was acquired in the following sequence. First, an image of the Dragon Green beads (serving as fiducial marks), HA (labeled with CF568-conjugated peptide and SrtA), and NA (labeled with AF647-CoA and SFP) was acquired, to enable registration. Next, a sequence of STORM images was acquired using a 640 nm laser at full power, with acquisition of the HA channel via a 560 nm laser at low power every 50 frames to correct for drift. After collecting 15000–35000 frames in this way, we performed STORM imaging on CF568-HA using a 560 nm laser. To correct for drift, we acquire an image every 50 frames using a 405 nm laser and 575/20 nm emission filter; these settings allow us to image the Dragon Green beads, while simultaneously accelerating blinking of the CF568 dye. For reconstructions of HA, we acquire 25000–35000 frames. For quantification and localization of blinking events, we use the ImageJ plugin Thunderstorm ( Ovesný et al., 2014 ), combined with custom Matlab scripts for additional drift correction and removal of fluorophores that remain in the ‘on’ state for more than one frame. This analysis results in a list of coordinates for each localization that we then use to reconstruct images of virus at varying resolutions. Reconstructed STORM images (e.g. Figure 1C & D ) are displayed by representing each localization as a gaussian with a standard deviation of 30 nm.
NAI challenge assay
Challenge experiments with the neuraminidase inhibitor oseltamivir are performed as described previously ( Vahey and Fletcher, 2019 ). The analysis from Figure 1E uses an image dataset from Vahey and Fletcher (2019) , reanalyzed to measure the spatial organization of HA and NA on the surface of released virus particles. We infect a polarized monolayer of MDCK cells grown on a collagen gel at MOI of 1–3. After incubating cells with virus for one hour at 37°C, we wash to remove excess virus, replacing media with virus growth media supplemented with or without a specified concentration of oseltamivir carboxylate (Toronto Research Chemicals O700980), but without TPCK-treated trypsin. At 16 hr post infection, we remove the virus containing media for labeling and imaging, and replace with media supplemented with 1 U/ml NanI from C. perfringens (Sigma N2876). After treating with this exogenous sialidase for one hour at 37°C, we again collect cell culture media for virus labeling and imaging. To measure the HA-NA polarization on viruses released in these experiments, we segment filamentous viruses with lengths > 1 μm and measure the intensity-weighted centroid (i.e. ‘center of mass’) for both the HA and NA channels. The vector connecting the NA centroid to the HA centroid defines the orientation of HA-NA polarity. Dividing the magnitude of this vector by the total particle length gives the HA-NA polarity metric plotted throughout this work.
Virus motility assay
Coverslips presenting sialic acid for virus attachment were prepared as described previously ( Vahey and Fletcher, 2019 ). Briefly, NH2-PEG-OH (Rapp Polymere, 122000–2) supplemented with 2.5 mole-percent NH2-PEG-Biotin (Rapp Polymere, 133000-25-20) was conjugated to silanized coverslips for subsequent attachment of sialylated proteins. Following PEGylation, custom PDMS chambers were attached to coverslips, and chambers were incubated for 10 min at room temperature with streptavidin at 50 µg/ml in 150 mM NaCl, 25 mM HEPEs, pH 7.2, and washed 5X in the same buffer. Fetuin (Sigma F3004) labeled with NHS-biotin was then added at 100 nM and incubated ~30 min at room temperature. Coverslips were then washed 5X in NTC buffer and equilibrated to 4°C in preparation for virus binding. For surfaces functionalized in this way ( Piehler et al., 2000 ), we expect a PEG density of ~0.75 molecules/nm 2 , corresponding to roughly one PEG-Biotin per 7 nm x 7 nm area on the surface. If each biotin is bound by one streptavidin tetramer and subsequently one molecule of biotinylated fetuin (with ~10 sialic acid residues per molecule), the surface density of sialic acid will be ~0.2 SA/nm 2 . Viruses with HA and NA enzymatically labeled as described previously were bound to coverslips equilibrated to 4°C for one hour on ice. Immediately before imaging, excess virus was washed with pre-chilled NTC, and the sample was mounted on the microscope stage. After allowing the chamber to equilibrate to room temperature, the buffer in the chamber was exchanged to NA buffer (100 mM NaCl, 50 mM MES pH 6.5, 5 mM CaCl 2 ), and timelapse recordings were collected using TIRF microscopy at 30 s intervals. To visualize trails of cleaved sialic acid, fluorescein-labeled Erythrina cristagalli lectin (ECL; Vector Labs FL-1141) was added to each well at a concentration of 5 µg/ml in NTC buffer with 10 mg/ml BSA and incubated for 30 min at room temperature. During this incubation period, rapid multivalent binding of ECL to cleaved sialic acid on the viral surface effectively blocks further motion of the virus. Images of ECL trails were acquired using TIRF microscopy without washing unbound ECL from the chamber. To analyze images of viruses, we separately segment each image according to the intensity in both the HA and NA channels. Merging the two sets of segmented images allows us to determine the position of each virus (i.e. the centroid of the combined HA and NA masks) as well as their morphological features. To determine the HA-NA polarization of each virus, we calculate the distance between the centroid of HA and NA intensity for a particular virus, divided by that virus’s length. The data in Figure 2 and Figure 3 is compiled by extracting these features for each virus in each frame of a timelapse recording. To analyze the trails of cleaved sialic acid left by mobile viruses, we segment images of samples labeled with fluorescent ECL according to the intensity of lectin staining. Because the virus itself contains high densities of sialic acid on its surface, we use a bandpass threshold to specifically quantify ECL bound to processed glycans on the coverslip (which produces a signal brighter than the background, but dimmer than the virus). Although viruses dissociate from some of the tracks, those that remain bound to the surface allow us to connect intensity of ECL labeling on the surface to intensities of HA and NA on the virus that generated the track. This data is plotted in Figure 3—figure supplement 3 , with and without normalization to NA intensity.
Quantification of NA activity using MUNANA
For assays using the fluorogenic neuraminidase substrate MUNANA, 10 µl of solution containing labeled virus was diluted into 40 µl of NA buffer (100 mM NaCl, 50 mM MES pH 6.5, 5 mM CaCl 2 ) and incubated in a test tube at 37°C. At time points of 0, 30, 60, 120, and 180 min, aliquots were collected and NA was inactivated by adding sodium carbonate to a final concentration of 100 mM, and fluorescence was measured by imaging a fixed volume of sample on a confocal microscope using excitation at 405 nm. The rate of turnover was then determined from the slope of the intensity versus time plot with the signal at 0 min subtracted from each timepoint. Because strains with wildtype NA and NAΔCT produce different titers of virus that also differ in their morphology and NA composition, we normalized samples to total NA content ( Figure 3—figure supplement 3A ), measured by immobilizing viruses on coverslips, imaging them, and integrating the total NA intensity associated with the two samples. This yields an estimated 6-fold difference in total NA content between virus with wildtype NA and viruses with NAΔCT.
Virus imaging at air-liquid interface of Calu-3 cell cultures
Calu-3 cells grown on plastic dishes for fewer than 10 passages (DMEM, 10% FBS, 1x penicillin/streptomycin, supplemented with 1 mM sodium pyruvate (Thermo Fisher, 11360070) and 1x non-essential amino acids (Thermo Fisher, 11140076)) were split at 80% confluence and seeded onto 6 mm transwell supports at 50000 cells per insert. Approximately 3 days after seeding, media from the apical compartment was removed (the ‘airlift’) and cells were provided with fresh media in the basal compartment every other day until being collected for experiments, 8–12 days following the airlift. Cells cultured in this way differentiated into a secretory phenotype, producing a layer of mucus ~1–10 µm thick over the apical surface of the monolayer ( Figure 4A ). To bind virus without washing away secreted mucus, 5–10 µl of labeled virus was added to the apical side of each transwell insert (enough to just coat the surface), and immediately removed, leaving ~1 µl of residual virus-containing solution that is approximately evenly distributed on the surface of the monolayer. The cells were then returned to the incubator for 3–6 hr, allowing virus to bind and diffuse, and allowing some of the residual moisture to dry before the cells are collected and fixed on ice for 20 min using 4% paraformaldehyde in PBS supplemented with 1 mM CaCl 2 . Following fixation, cells and mucus were labeled with MUC5AC monoclonal antibody (45M1; MA5-12178 ThermoFisher) and Erythrina cristagalli lectin labeled with FITC (5 μg/ml; Vector Laboratories, FL-1141). Following labeling, the transwell insert was carefully excised with a razor blade and inverted onto a coverslip for imaging. To quantify alignment between the HA-NA axis of a virus particle and the direction of its displacement from the associated ECL track ( Figure 4E ), fluorescent images of HA, NA, and ECL were segmented in both HA (to identify virus particles) and ECL (to identify regions of cleaved sialic acid) channels. For each segmented virus particle, we calculate the HA-NA axis (defined as the vector displacement between the center of masses for HA and NA) and the ECL displacement (defined as the vector displacement between the center of masses for HA and ECL) ( Figure 4B , right). Cases where multiple particles contact the same ECL track are excluded from analysis.
Statistics and replicates
Replicates referenced throughout this paper refer to biological replicates, defined as virus collected from separate infected cell cultures, labeled, and assayed as indicated. No statistical methods were used to predetermine sample size. Image data was excluded from analysis in rare cases if the sample drifted on the microscope stage, or if coverslip preparations showed non-specific virus binding. Statistical tests and the number of replicates used in specific cases are described in figure captions. All statistical tests were performed in Matlab R2017b using the Statistics and Machine Learning Toolbox. Confidence intervals for the data in Figure 1G were calculated using a critical value of the Student’s t distribution of 3.182 (95% confidence interval for n -1 = 3 degrees of freedom).
Additional files 10.7554/eLife.43764.023 Source code 1. Matlab code for modeling the diffusion of virus particles bound to sialic acid on two-dimensional surfaces. The folder ‘Immobile SA’ simulates the case where sialic acid is stationary on the surface, while the folder ‘Mobile SA’ simulates the case where sialic acid is able to freely diffuse (unless bound by the virus). The function run_simulations.m can be used to launch simulations in both folders. More information is contained in the documentation of each function. 10.7554/eLife.43764.024 Transparent reporting form
📊 Figures
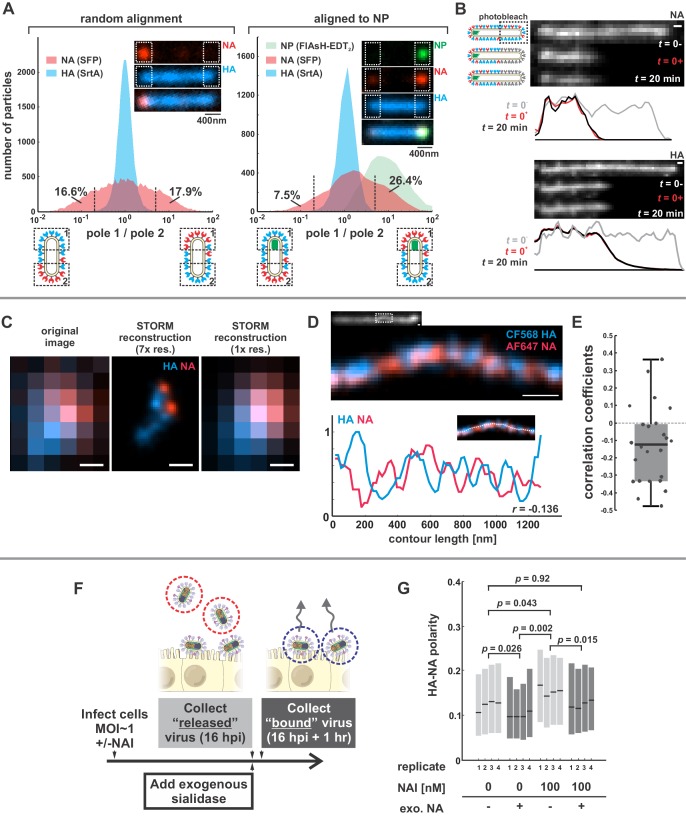
Figure 1.
Organization of the IAV envelope in filamentous virus particles.
( A ) Abundance of viral proteins at one viral pole relative to the other, measured as the ratio of intensities withinu00a0~400 nm of either end of the virus. The plot to the left compares HA and NA i...
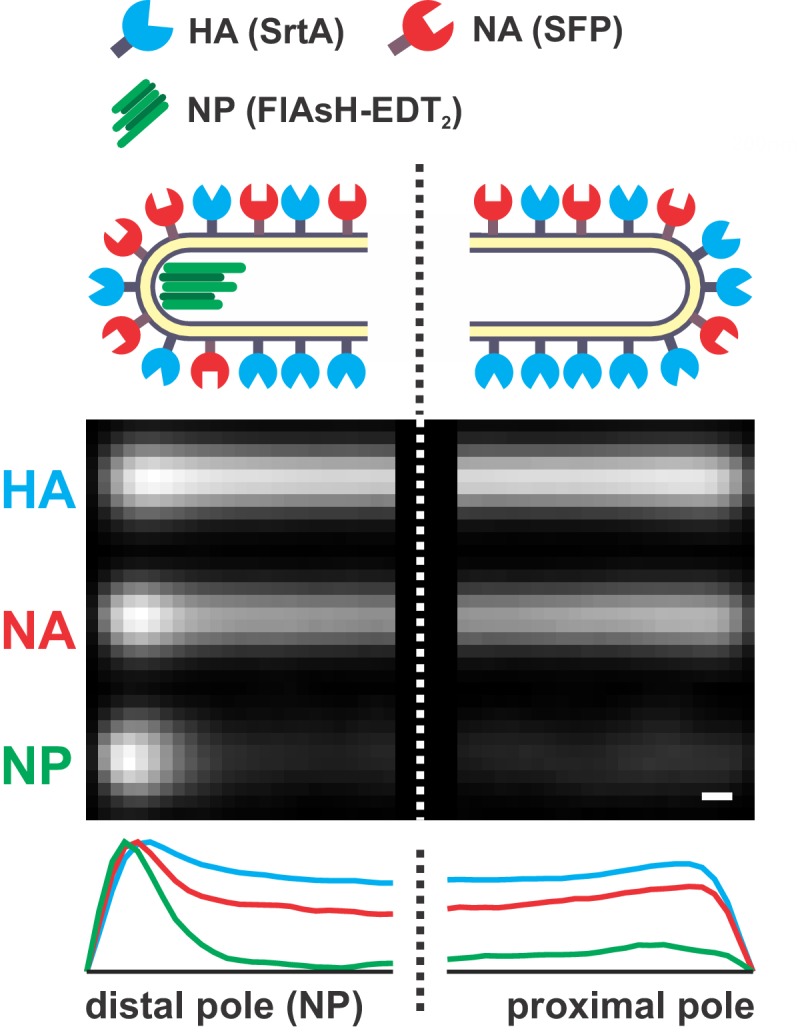
Figure 1u2014figure supplement 1.
Distribution of HA, NA, and NP in filamentous particles.
A composite image of the poles of 540 filamentous virusesu00a0u2265u00a04.5 u03bcm in length with fluorescently labeled HA (SrtA), NA (Sfp), and NP (FlAsH-EDT 2 ). Particles are aligned by the locatio...
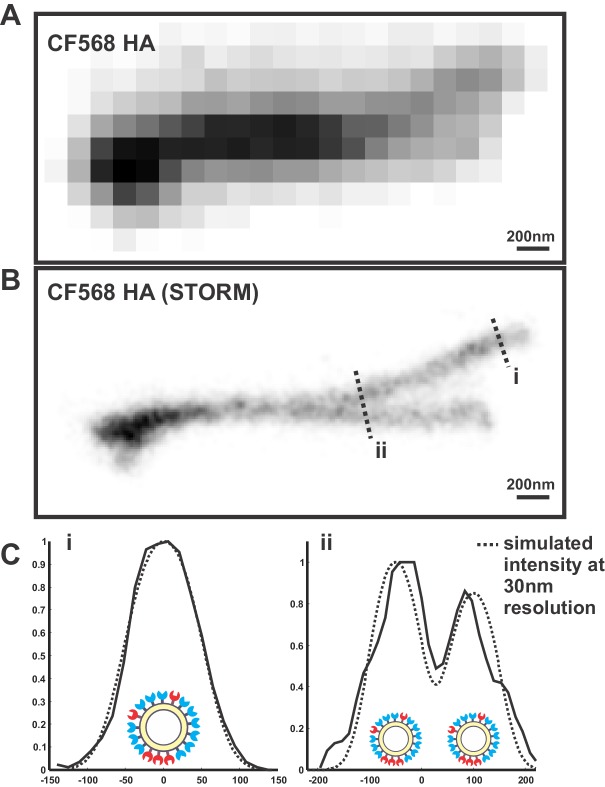
Figure 1u2014figure supplement 2.
Determining the resolution of virus images reconstructed using STORM.
( A ) Image of overlapping filamentous viruses acquired using diffraction-limited microscopy (shown with inverted contrast). ( B ) STORM reconstruction of the same image as in ( A ), with indicated cr...
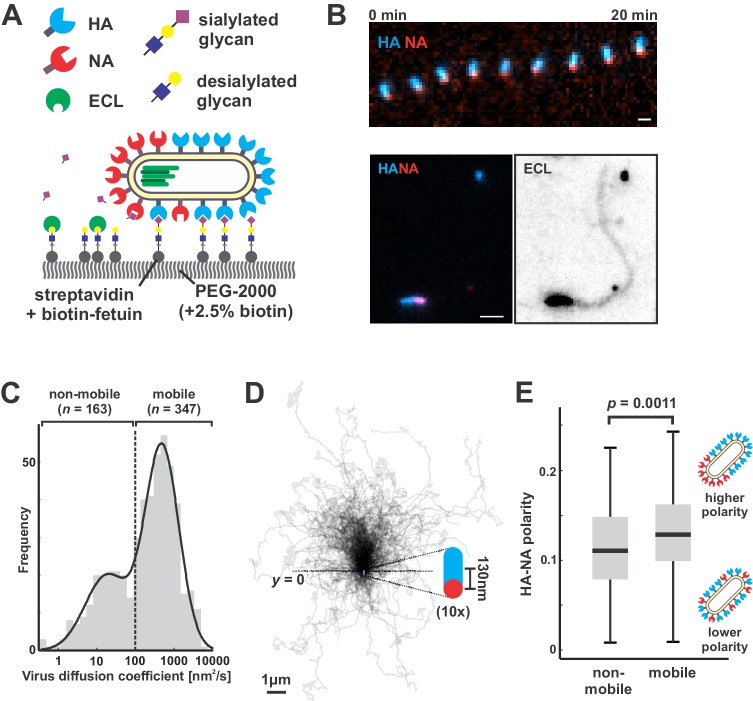
Figure 2.
Filamentous IAV diffuses via a Brownian ratchet mechanism.
( A ) Labeled viruses are placed on coverslips passivated with PEG2K and functionalized with biotinylated fetuin, which provides a high density of receptors for HA and substrates for NA that can be im...
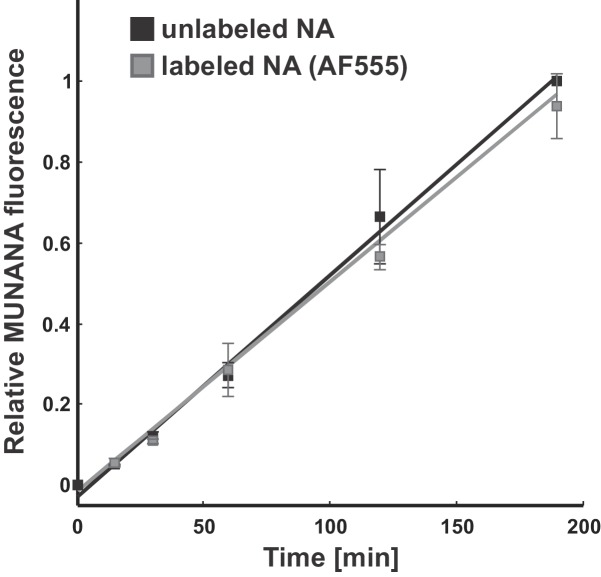
Figure 2u2014figure supplement 1.
Effect of fluorescent labeling on NA activity.
The activity of viruses labeled with Alexa fluor 555 following the same protocol used for imaging experiments matches that of unlabeled samples. Data is from three biological replicates, normalized wi...
Video 1.
Montage of IAV particles acquired using total internal reflectance microscopy at 30 s intervals.
Labeled HA is shown in blue and labeled NA is shown in red. Panels are shown at equivalent scales.
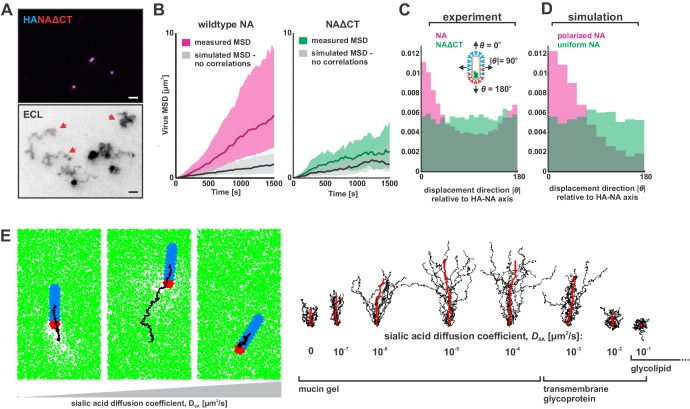
Figure 3.
Organization of the IAV envelope and diffusion of sialic acid receptors determine persistence of directional mobility.
( A ) NAu0394CT virus create ECL tracks that appear less persistent than those generated by virus with wildtype NA. Red arrows indicate tracks where viruses have dissociated (scale baru00a0=u00a02 u00...
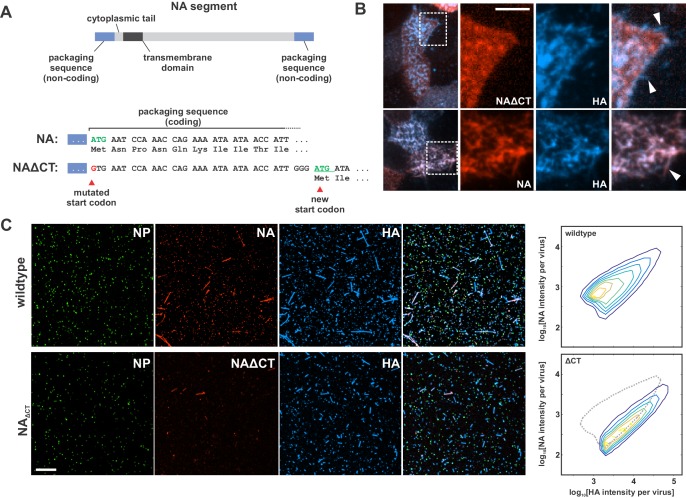
Figure 3u2014figure supplement 1.
Characterization of influenza A virus lacking the NA cytoplasmic tail (NAu0394CT).
( A ) Construction of an NA segment lacking the N-terminal cytoplasmic tail. Mutating the initial methionine and inserting a new start codon following the coding regions important for vRNA packaging e...
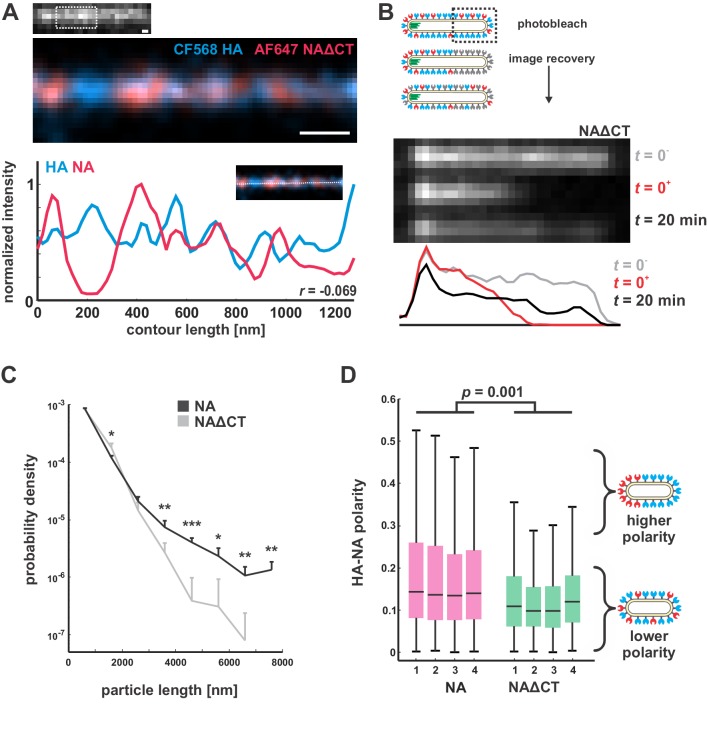
Figure 3u2014figure supplement 2.
Characterization of NAu0394CT virus organization and dynamics in the viral membrane.
( A ) STORM imaging of NAu0394CT reveals a clustered distribution of HA and NA on the surface of filamentous viruses, similar to the nanometer-scale organization of wildtype virus (scale baru00a0=u00a...
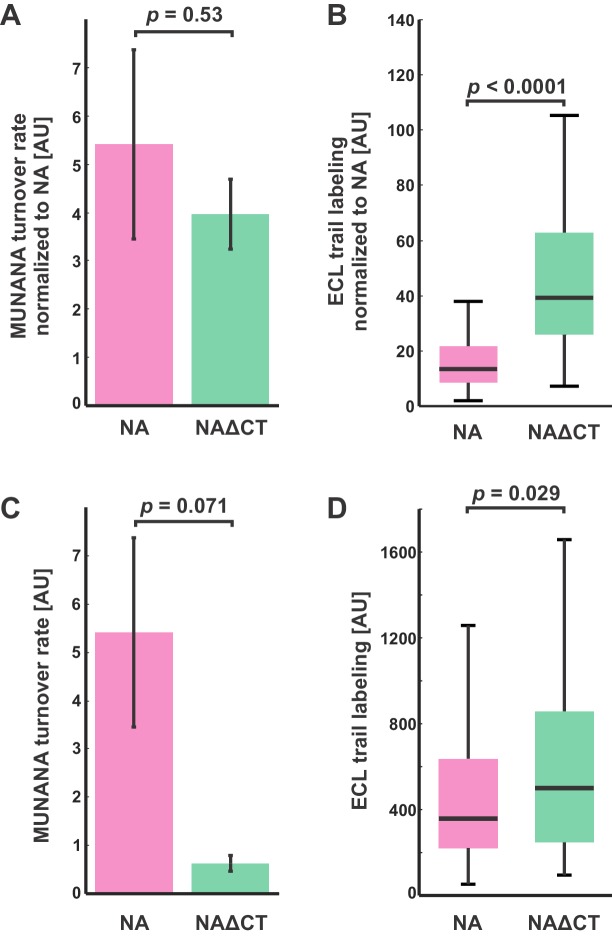
Figure 3u2014figure supplement 3.
Comparison of NA activities for soluble and immobilized substrates.
( A ) Enzymatic activity (measured using MUNANA) for intact virus samples with wildtype and NAu0394CT, normalized by relative NA content (determined by imaging fluorescently labeled virus). Rates of M...
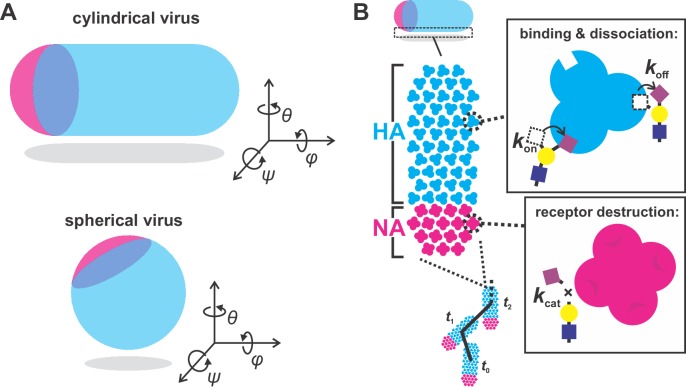
Figure 3u2014figure supplement 4.
simulation scheme.
( A ) Orientation of cylindrical (left) and spherical (right) viral particles on flat surfaces. Of the three rotational degrees of freedom, only rotations in u03b8 are considered in our simulations of...
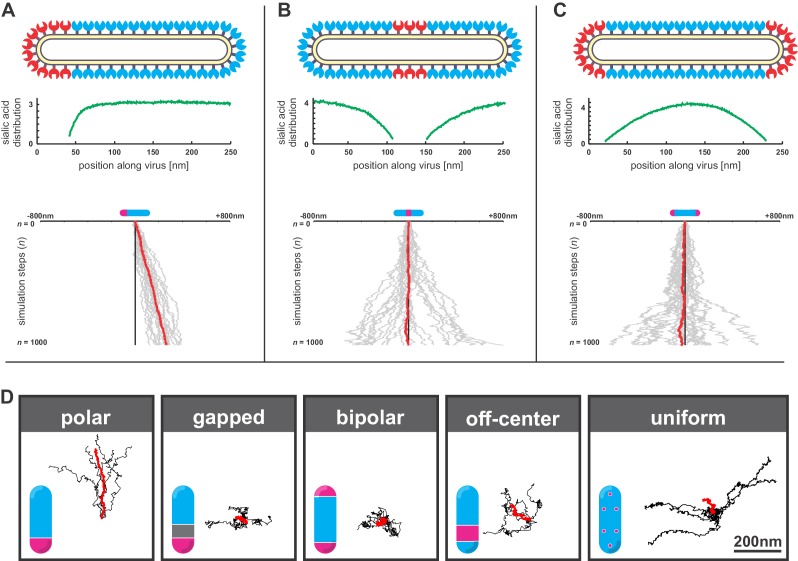
Figure 3u2014figure supplement 5.
Virus organization, sialic acid distributions, and virus trajectories in one- and two-dimensional simulations.
( A ) Polarized distributions of NA (top) result in sialic acid distributions (middle) that decrease abruptly within a few tens of nanometers of the NA cluster. While most HAs sample from uniform dist...
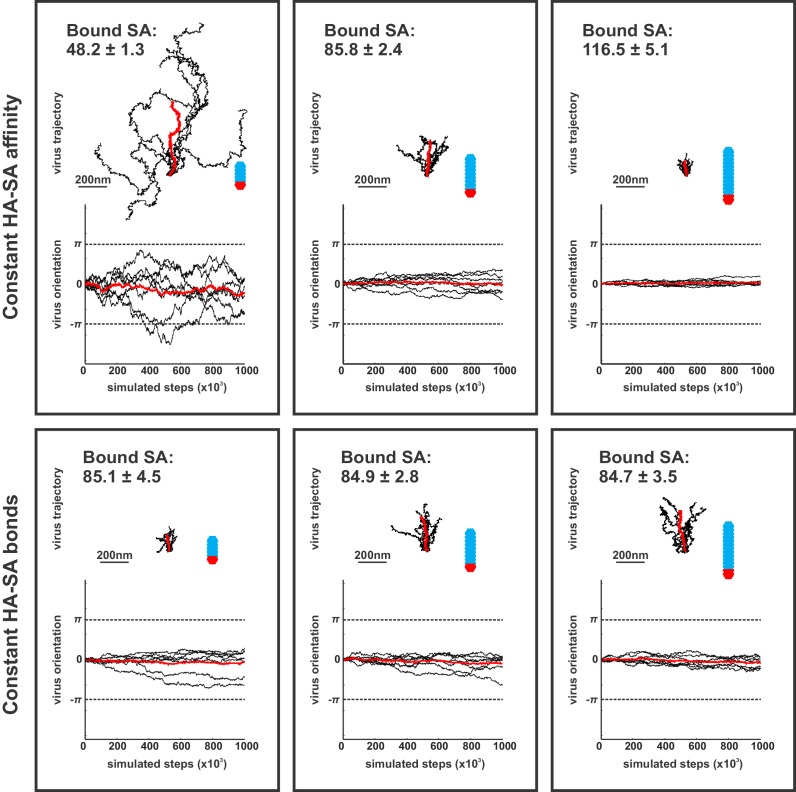
Figure 3u2014figure supplement 6.
Contributions of virus morphology and binding affinity to persistent mobility.
Simulations of virus mobility for particles 185 nm, 285 nm, and 385 nm in length, corresponding to 48, 84 and 115 simulated HA trimers per particle, respectively. For a constant HA-SA binding affinity...
Video 2.
Simulation of a filamentous virusu00a0~u00a0250 nm in length with a polarized distribution of HA (blue) and NA (red) on its surface bound to a surface coated with sialic acid (green).
Video 3.
Simulations of polarized filamentous viruses on surfaces with freely-diffusing sialic acid (green).
Simulations correspond to D SA =u00a010 u22127 u03bcm 2 /s, D SA =u00a010 u22125 u03bcm 2 /s, and D SA =u00a010 u22121 u03bcm 2 /s, as plotted in Figure 3E .
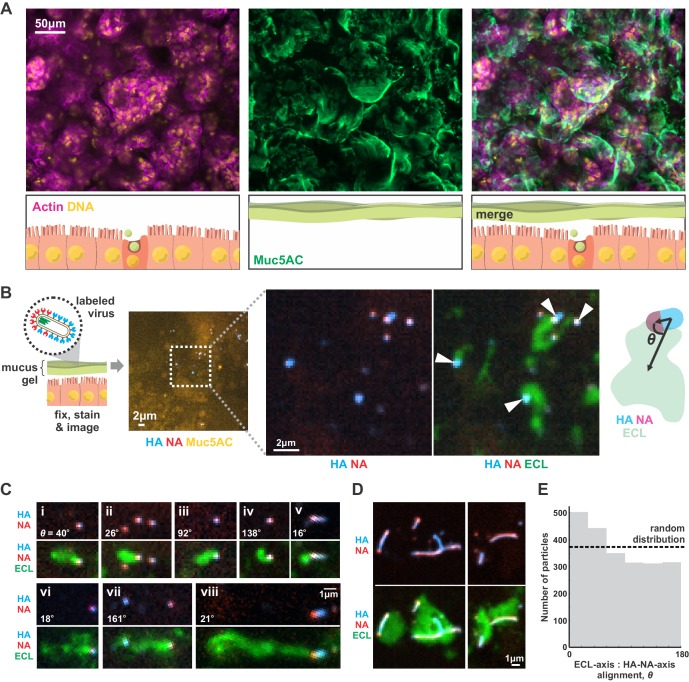
Figure 4.
IAV exhibits persistent directional mobility in native mucus gels.
( A ) Calu-3 cells cultured at an air-liquid interface foru00a0~10 days partially differentiate, secreting gel-forming mucins (visualized with an antibody against Muc5AC). ( B ) Labeled virus (fluores...
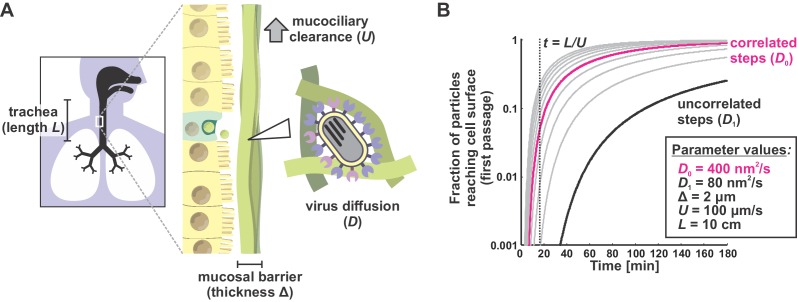
Figure 4u2014figure supplement 1.
A first passage model for virus transport in mucus.
( A ) Viruses entering the trachea (e.g. as aerosolized respiratory droplets) bind to the mucosal barrier. The probability of a particle infecting the underlying epithelium depends on the relative rat...
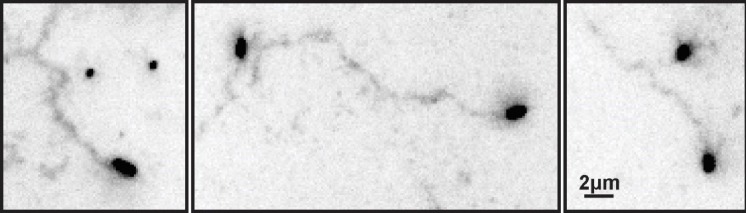
Author response image 1.
ECL tracks from unlabeled virus.
Filamentous viruses unmodified by fluorophores leave persistent trails of cleaved sialic acid (detected by labeling with ECL and displayed here with inverted contrast) similar to those left by fluores...
Figure images are served from the NIH/NLM PubMed Central Open Access Subset or Europe PMC; copyright remains with the publishers and authors.
💬 Discussion
0 commentsNo comments yet. Be the first to start a discussion!
Leave a Comment