Abstract
Bone marrow derived human mesenchymal stem cells (hMSCs) show promising potential in regeneration of defective tissue. Recently, gene silencing strategies using microRNAs (miR) emerged with the aim to expand the therapeutic potential of hMSCs. However, researchers are still searching for effective miR delivery methods for clinical applications. Therefore, we aimed to develop a technique to efficiently deliver miR into hMSCs with the help of a magnetic non-viral vector based on cationic polymer polyethylenimine (PEI) bound to iron oxide magnetic nanoparticles (MNP). We tested different magnetic complex compositions and determined uptake efficiency and cytotoxicity by flow cytometry. Additionally, we monitored the release, processing and functionality of delivered miR-335 with confocal laser scanning microscopy, real-time PCR and live cell imaging, respectively. On this basis, we established parameters for construction of magnetic non-viral vectors with optimized uptake efficiency (~75%) and moderate cytotoxicity in hMSCs. Furthermore, we observed a better transfection performance of magnetic complexes compared to PEI complexes 72 h after transfection. We conclude that MNP-mediated transfection provides a long term effect beneficial for successful genetic modification of stem cells. Hence, our findings may become of great importance for future in vivo applications.
🔬 Techniques
🔭 Microscopes
✨ Fluorophores
🧪 Sample Preparation
🔬 Cell Lines
🏭 Microscope Brands
🧪 Reagent Suppliers
🏛️ Research Organizations (ROR)
Affiliated research institutions:
📋 Methods
3.1.
Culture of hMSCs
Bone marrow derived hMSCs were obtained from sternal aspirates of patients during coronary artery bypass grafting at the Cardiac Surgery Department of the University of Rostock as previously described [ 55 ]. The donors gave written consent to use their bone marrow for research purposes. Mononuclear cells were isolated by density gradient centrifugation. For plastic adherence selection cells were cultivated in Mesenchymal Stem Cell Growth Medium (MSCGM™, Lonza, Walkersville, MD, USA) containing 100 U/mL penicillin (PAA, Coelbe, Germany) and 100 μg/mL streptomycin (PAA) at 37 °C and 5% CO 2 . When the adherent hMSC population reached 80% confluency, cells were passaged or stored in liquid nitrogen. hMSCs in passage 3 and 4 were used in all experiments. 3.2.
Immunophenotyping of hMSCs
Cell surface markers of hMSCs were fluorescently labeled with anti-human antibodies CD29-APC, CD44-PerCP-Cy5.5, CD45-V500, CD73-PE, CD117-PE-Cy7 (BD Biosciences, Heidelberg, Germany) and CD105-AlexaFluor488 (AbD Serotec, Kidlington, UK). Corresponding mouse isotype antibodies served as negative controls. 2 × 10 4 cells were acquired using BD FACS LSRII™ flow cytometer (BD Biosciences, Heidelberg, Germany) and analyzed with BD FACSDiva Software 6 (BD Biosciences). 3.3. Functional Characterization for hMSCs Differentiation capacity of hMSCs was investigated using Human Mesenchymal Stem Cell Function Identification Kit (R & D Systems, Minneapolis, MN, USA) according to the manufacturers’ protocol. After 21 days in differentiation medium, immunostaining of fatty acid binding protein-4 (FABP-4), osteocalcin and aggrecan for adipogenic, osteogenic and chondrogenic differentiation, respectively, was performed. Nuclei were stained with 4′,6-diamidino-2-phenylindol (DAPI, Invitrogen, Carlsbad, CA, USA). Samples were analyzed using ELYRA PS.1 LSM 780 microscope (Carl Zeiss, Jena, Germany) and ZEN2011 software (Carl Zeiss, Göttingen, Germany). 3.4. Preparation and Characterization of Transfection Complexes Streptavidine Magnesphere ® Paramagnetic Particles (Promega, Madison, WI, USA) were sonicated and filtered using 450 nm Millix-HV PVDF syringe driven filter (Millipore, Tullagreen, Ireland). MNP filtrate was stored in aliquots at 4 °C. Cy™3 labeled Pre-miR™ Negative Control #1 (Ambion, Austin, TX, USA) was used for uptake efficiency studies; hsa-miR-335-5p Pre-miR™ miRNA Precursor (Ambion) and Negative Control #1 Pre-miR™ (Ambion) were used for functional studies. Branched polyethylenimine (MW = 25 kDa, Sigma-Aldrich, St. Louis, MO, USA) was biotinylated using Sulfo-NHS-LC-Biotin linker (Pierce, Rockford, IL, USA) according to the manufacturers’ protocol. Briefly, NHS-LC-Biotin linker was dissolved in DMSO at a final concentration of 9.7 mM. Afterwards, biotin was added dropwise to PEI (pH 6.4) and incubated for 16 h at room temperature in the dark. To remove the unreacted biotin, dialysis was performed and the concentration of α-amino groups in PEI was determined using 2% Ninhydrin reagent (Sigma-Aldrich). PEI was stored in aliquots at 4.41 mM amine concentration at 4 °C. For optimization of complex composition different molar ratios of PEI nitrogen and miR phosphate (NP ratios) were prepared as previously described [ 2 ]. Briefly, miR and PEI were diluted in equal volumes of 5% glucose solution, mixed and incubated for 30 min at room temperature in order to form miR/PEI complexes. For miR/PEI/MNP complex formation, different iron concentrations of MNPs were mixed with miR/PEI complexes and incubated for 30 min at room temperature. Transfection complexes were freshly prepared before use. The condensation of miR by PEI was investigated by gel electrophoresis. miR/PEI complexes were mixed with loading dye and loaded onto 2% agarose gel, containing ethidium bromide. An electric field of 100 V was applied for 15 minutes and image was taken using UV illuminator (Gel Doc 2000 system, Bio-Rad, Hercules, CA, USA). The mean hydrodynamic diameter of MNPs and transfection complexes was measured using Dynamic Light Scattering (DLS) with Brookhaven 90 Plus Nanoparticle Size Analyzer (Brookhaven Instruments Corporation, New York, NY, USA). Zeta Potential was determined by Phase Analysis Light Scattering (PALS) using ZetaPALS Analyzer (Brookhaven Instruments Corporation, Holtsville, NY, USA). 3.5.
Show full methods section
3.1.
Culture of hMSCs
Bone marrow derived hMSCs were obtained from sternal aspirates of patients during coronary artery bypass grafting at the Cardiac Surgery Department of the University of Rostock as previously described [ 55 ]. The donors gave written consent to use their bone marrow for research purposes. Mononuclear cells were isolated by density gradient centrifugation. For plastic adherence selection cells were cultivated in Mesenchymal Stem Cell Growth Medium (MSCGM™, Lonza, Walkersville, MD, USA) containing 100 U/mL penicillin (PAA, Coelbe, Germany) and 100 μg/mL streptomycin (PAA) at 37 °C and 5% CO 2 . When the adherent hMSC population reached 80% confluency, cells were passaged or stored in liquid nitrogen. hMSCs in passage 3 and 4 were used in all experiments. 3.2.
Immunophenotyping of hMSCs
Cell surface markers of hMSCs were fluorescently labeled with anti-human antibodies CD29-APC, CD44-PerCP-Cy5.5, CD45-V500, CD73-PE, CD117-PE-Cy7 (BD Biosciences, Heidelberg, Germany) and CD105-AlexaFluor488 (AbD Serotec, Kidlington, UK). Corresponding mouse isotype antibodies served as negative controls. 2 × 10 4 cells were acquired using BD FACS LSRII™ flow cytometer (BD Biosciences, Heidelberg, Germany) and analyzed with BD FACSDiva Software 6 (BD Biosciences). 3.3. Functional Characterization for hMSCs Differentiation capacity of hMSCs was investigated using Human Mesenchymal Stem Cell Function Identification Kit (R & D Systems, Minneapolis, MN, USA) according to the manufacturers’ protocol. After 21 days in differentiation medium, immunostaining of fatty acid binding protein-4 (FABP-4), osteocalcin and aggrecan for adipogenic, osteogenic and chondrogenic differentiation, respectively, was performed. Nuclei were stained with 4′,6-diamidino-2-phenylindol (DAPI, Invitrogen, Carlsbad, CA, USA). Samples were analyzed using ELYRA PS.1 LSM 780 microscope (Carl Zeiss, Jena, Germany) and ZEN2011 software (Carl Zeiss, Göttingen, Germany). 3.4. Preparation and Characterization of Transfection Complexes Streptavidine Magnesphere ® Paramagnetic Particles (Promega, Madison, WI, USA) were sonicated and filtered using 450 nm Millix-HV PVDF syringe driven filter (Millipore, Tullagreen, Ireland). MNP filtrate was stored in aliquots at 4 °C. Cy™3 labeled Pre-miR™ Negative Control #1 (Ambion, Austin, TX, USA) was used for uptake efficiency studies; hsa-miR-335-5p Pre-miR™ miRNA Precursor (Ambion) and Negative Control #1 Pre-miR™ (Ambion) were used for functional studies. Branched polyethylenimine (MW = 25 kDa, Sigma-Aldrich, St. Louis, MO, USA) was biotinylated using Sulfo-NHS-LC-Biotin linker (Pierce, Rockford, IL, USA) according to the manufacturers’ protocol. Briefly, NHS-LC-Biotin linker was dissolved in DMSO at a final concentration of 9.7 mM. Afterwards, biotin was added dropwise to PEI (pH 6.4) and incubated for 16 h at room temperature in the dark. To remove the unreacted biotin, dialysis was performed and the concentration of α-amino groups in PEI was determined using 2% Ninhydrin reagent (Sigma-Aldrich). PEI was stored in aliquots at 4.41 mM amine concentration at 4 °C. For optimization of complex composition different molar ratios of PEI nitrogen and miR phosphate (NP ratios) were prepared as previously described [ 2 ]. Briefly, miR and PEI were diluted in equal volumes of 5% glucose solution, mixed and incubated for 30 min at room temperature in order to form miR/PEI complexes. For miR/PEI/MNP complex formation, different iron concentrations of MNPs were mixed with miR/PEI complexes and incubated for 30 min at room temperature. Transfection complexes were freshly prepared before use. The condensation of miR by PEI was investigated by gel electrophoresis. miR/PEI complexes were mixed with loading dye and loaded onto 2% agarose gel, containing ethidium bromide. An electric field of 100 V was applied for 15 minutes and image was taken using UV illuminator (Gel Doc 2000 system, Bio-Rad, Hercules, CA, USA). The mean hydrodynamic diameter of MNPs and transfection complexes was measured using Dynamic Light Scattering (DLS) with Brookhaven 90 Plus Nanoparticle Size Analyzer (Brookhaven Instruments Corporation, New York, NY, USA). Zeta Potential was determined by Phase Analysis Light Scattering (PALS) using ZetaPALS Analyzer (Brookhaven Instruments Corporation, Holtsville, NY, USA). 3.5.
Transfection
For transfection experiments, 1.5 × 10 4 and 1 × 10 5 cells per well were seeded in 24 and 6 well plate, respectively. 24 h after cell seeding, miR/PEI and miR/PEI/MNP complexes were freshly prepared as described above and added dropwise to the medium. 5 h after transfection cells were washed with PBS and fresh medium was supplied. 3.6. Uptake Efficiency and Cytotoxicity For determination of uptake efficiency, hMSCs were seeded in 24 well plates and transfected as described above for 5 h. Afterwards, cells were washed with 1 M NaCl solution to remove transfection complexes attached to the cell membrane and detached with Trypsin-EDTA solution (PAA). To evaluate cytotoxicity, cells were stained with Near-IR LIVE/DEAD ® Fixable Dead Cell Stain Kit (Molecular Probes, Eugene, OR, USA) and fixed with 4% PFA (Sigma-Aldrich). 2 × 10 4 cells were acquired using BD FACS LSRII™ flow cytometer (BD Biosciences) and analyzed with BD FACSDiva Software 6 (BD Biosciences, Heidelberg, Germany, 2007). 3.7.
Fluorescent Labeling of Transfection Complexes hsa-miR-335-5p Pre-miR™ miRNA Precursor
(Ambion) was labeled with Cy™5 dye using Label IT ® miRNA Labeling Kit, Version 2 (Mirus Bio LLC, Madison, WI, USA) according to the manufacturer’s protocol. Briefly, 1 μg of miR was incubated with 8 μL of Label IT reagent for 2 h at 37 °C. Unreacted dye was removed using a purification column. Labeled miR-Cy5 was stored at −20 °C in the dark. PEI was labeled using FluoReporter ® Oregon Green ® 488 Protein Labeling Kit (Molecular Probes). According to the manufacturers’ protocol, PEI was mixed with 1 M sodium bicarbonate solution. Afterwards Oregon Green ® stock solution (10 mg/mL in DMSO) was added to PEI solution and incubated for 1 h in the dark. The unbound dye was removed using a spin column. Labeled PEI-488 was stored at 4 °C protected from light. MNP were labeled with Atto 565 dye conjugated to biotin (ATTO-TEC GmbH, Siegen, Germany) during miR/PEI/MNP complex formation. Therefore, miR/PEI complexes were mixed with MNPs and Atto 565 simultaneously and incubated for 30 min in the dark. Atto 565 dye was mixed with MNP at a ratio of 1:1000 ( w / w ). Labeled MNP-565 was freshly prepared before transfection. 3.8.
Confocal Laser Scanning Microscopy
For microscopic observations, hMSCs were seeded on glass coverslips in 24 well plates and transfected with labeled complexes according to the optimized transfection protocol. miR-Cy5/PEI-488 and miR-Cy5/PEI-488/MNP-565 complexes with 5 pmol/cm 2 miR, NP ratio 10 and 1 μg/mL of iron concentration within MNPs were used. 72 h after transfection cells were first washed with 1 M NaCl solution and then fixed with 4% PFA solution (Sigma-Aldrich) for 20 min at room temperature. Afterwards nuclei were stained with 250 nM DAPI (Molecular Probes) for 15 min at room temperature. Then, cells were washed with PBS and mounted with FluorSave™ Reagent (Calbiochem, Darmstadt, Germany) on microscope slides. Images were acquired in LSM mode using ELYRA PS.1 LSM 780 microscope and processed with ZEN 2011 Software (Carl Zeiss). 3.9. Real-Time PCR For real-time PCR cells were seeded in 6 well plates and transfected with miR, miR/PEI or miR/PEI/MNP complexes as described above. 5, 24 and 72 h after transfection, total RNA was isolated with mirVana™ miRNA Isolation Kit (Ambion) according to the manufacturers’ protocol. Reverse transcription was performed using TaqMan ® MicroRNA Reverse Transcription Kit (Applied Biosystems™, Austin, TX, USA) and High Capacity cDNA Reverse Transcription Kit (Applied Biosystems™). Human mature miR-335 (Assay ID 000546), TNC (Assay ID Hs01115665_m1) and RUNX2 (Assay ID Hs00231692_m1) transcripts were quantified by StepOnePlus Real-Time PCR System (Applied Biosystems™) using the corresponding TaqMan Assays (Applied Biosystems™). To calculate the relative expression ratio (R) the ΔΔC t method was used ( Equations (1) and (2) ). Therefor RNU6B (Assay ID 001093) and Human GAPD Endogenous Control (Applied Biosystems™) were used as endogenous normalization controls for miR and protein coding genes, respectively. Untransfected cells were used as a reference. The obtained data are representative of 5 independent biological experiments ( n = 5), each of which was measured in qPCR-triplicates. (1) Δ C T = C T target - C T endogenous control (2) R = 2 - ( Δ C T sample - Δ C T reference ) 3.10.
Wound Healing Assay
For functional studies, cells were seeded in 24 well plates and transfected with miR/PEI/MNP complexes according to the optimized transfection protocol as described above. Transfection complexes were formed either with hsa-miR-335-5p Pre-miR™ miRNA Precursor (Ambion) or with scrambled Negative Control #1 Pre-miR™ (Ambion). Twenty-four hous after transfection, fresh medium was added and a scratch was created in a cell monolayer with a sterile plastic tip. Live cell migration was recorded in a time-lapse video by sequential acquisition of images every 3 min using ELYRA PS.1 LSM 780 microscope (Carl Zeiss) for 12 h at 37 °C and 5% CO 2 . The overgrown surface area was measured with ZEN 2011 Software (version 8; Carl Zeiss: Göttingen, Germany, 2012) at the beginning and at the end of the assay. 3.11.
Statistical Analysis
Statistical analyses in all experiments were performed using Student’s t -test. Particle size data are presented as mean ± standard deviation (SD). All other values are presented as mean ± standard error of the mean (SEM). A p -value < 0.05 was considered to be statistically significant.
📊 Figures
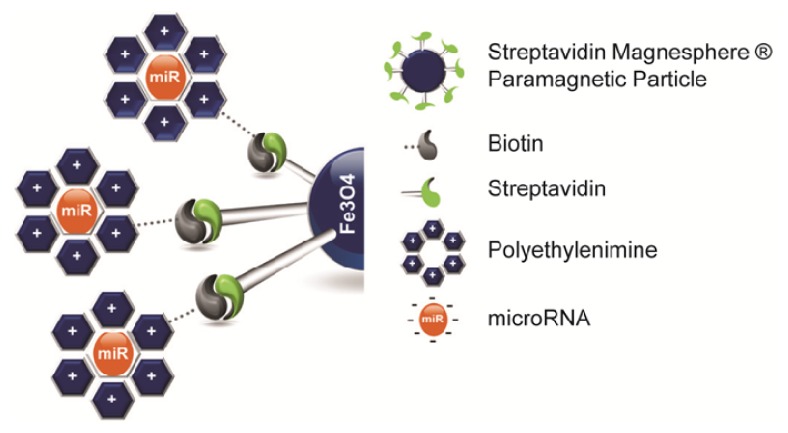
Figure 1
Schematic representation of magnetic transfection complexes Magnetic transfection complexes consist of streptavidin coated paramagnetic iron oxide nanoparticles in the core and miR/PEI polyplexes boun...
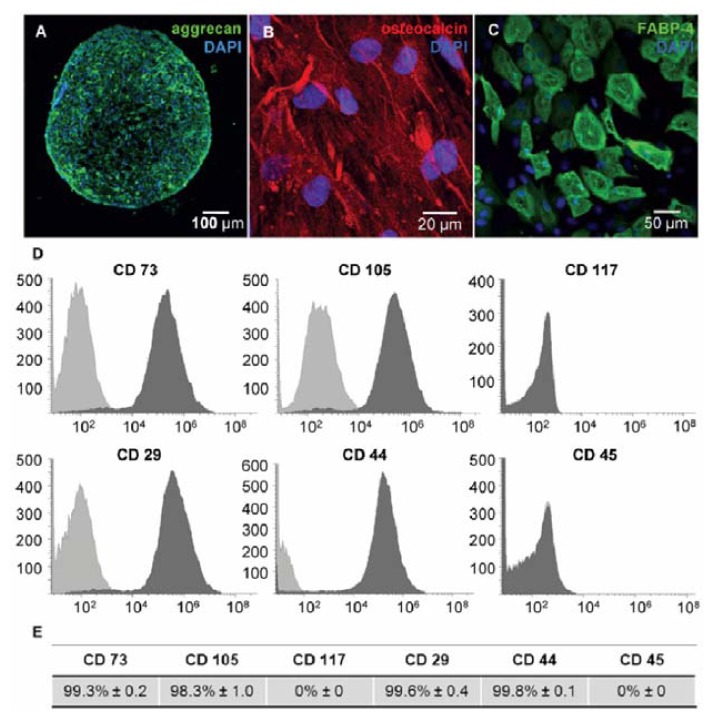
Figure 2
Characterization of hMSC ( A u2013 C ) Differentiation capacity of hMSCs was shown by immunostaining of aggrecan (green) for chondrocytes ( A ), osteocalcin (red) for osteocytes ( B ) and FABP-4 (gree...
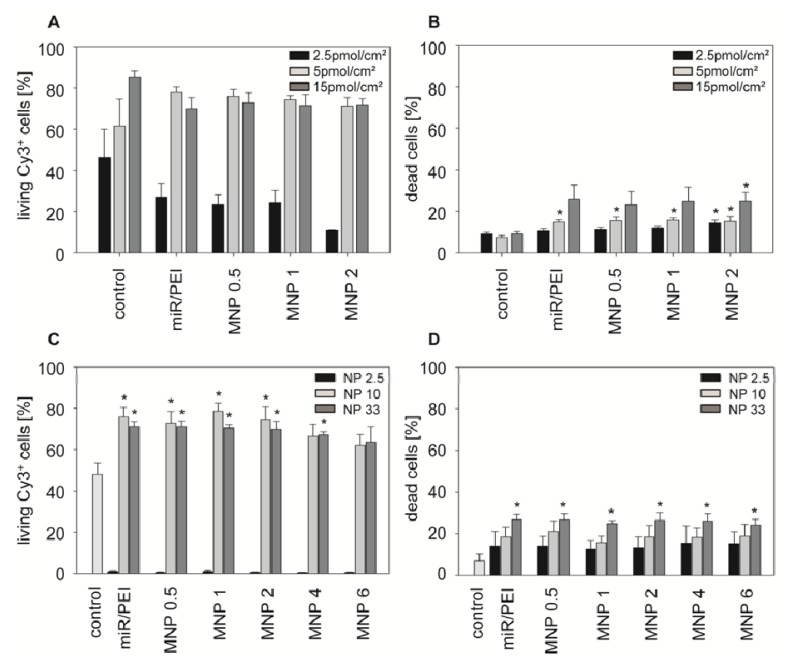
Figure 3
Transfection optimization with magnetic polyplexes in hMSCs. hMSCs were transfected with Cyu21223 labeled miR/PEI or miR/PEI/MNP complexes and the uptake efficiency ( A , C ) and cytotoxicity ( B , D ...
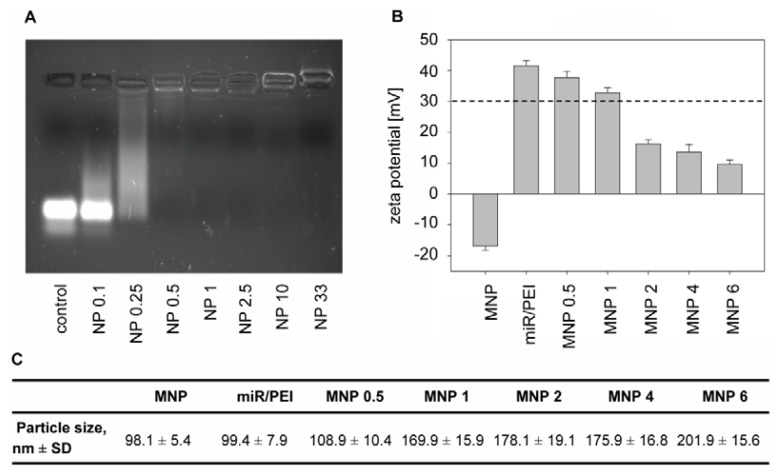
Figure 4
Characterization of transfection complexes. ( A ) Condensation of miR by PEI was examined by gel electrophoresis. Polyplexes with NP ratios from 0.1 to 33 and 20 pmol miR were investigated. miR alone ...
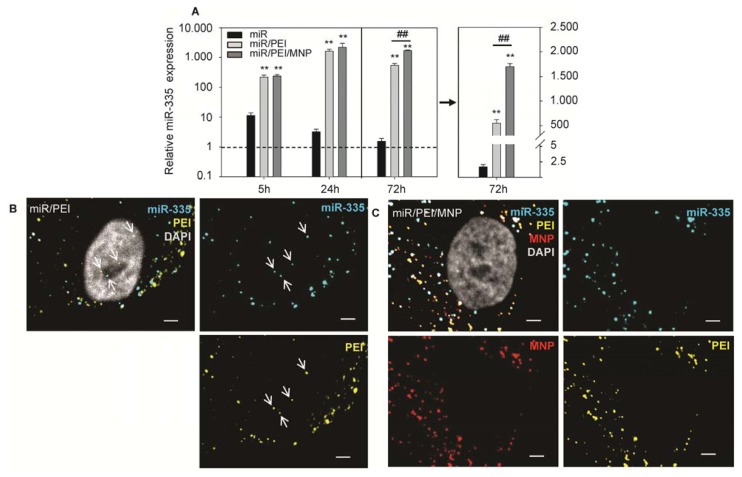
Figure 5
Processing of transfected precursor-miR. ( A ) hMSCs were transfected with precursor-miR-335 using miR/PEI or miR/PEI/MNP complexes and level of a mature miR-335 strand was detected by real time PCR 5...
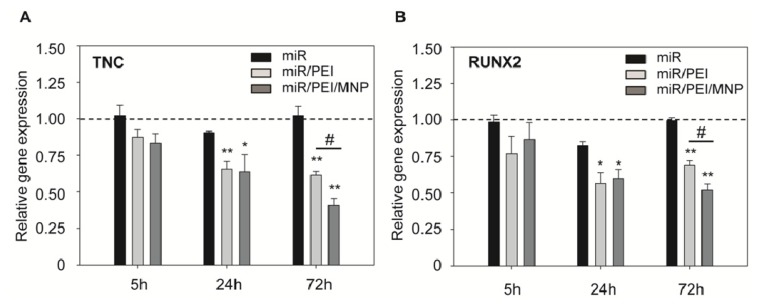
Figure 6
Efficient knockdown of miR-335 target genes. ( A , B ) hMSCs were transfected with miR/PEI or miR/PEI/MNP complexes and relative gene expression of TNC ( A ) and RUNX2 ( B ) was measured by real-time ...
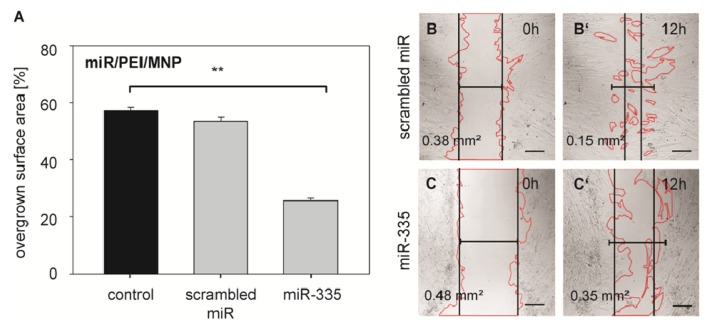
Figure 7
Migration activity of hMSCs after miR-335 transfection. ( A ) hMSCs were transfected with miR/PEI/MNP complexes and migration activity was tested 24 h after transfection. The overgrown surface area of...
Figure images are served from the NIH/NLM PubMed Central Open Access Subset or Europe PMC; copyright remains with the publishers and authors.
💬 Discussion
0 commentsNo comments yet. Be the first to start a discussion!
Leave a Comment