Abstract
The properties of keratin intermediate filaments (IFs) have been studied after transfection with green fluorescent protein (GFP)-tagged K18 and/or K8 (type I/II IF proteins). GFP-K8 and -K18 become incorporated into tonofibrils, which are comprised of bundles of keratin IFs. These tonofibrils exhibit a remarkably wide range of motile and dynamic activities. Fluorescence recovery after photobleaching (FRAP) analyses show that they recover their fluorescence slowly with a recovery t(1/2) of approximately 100 min. The movements of bleach zones during recovery show that closely spaced tonofibrils (<1 microm apart) often move at different rates and in different directions. Individual tonofibrils frequently change their shapes, and in some cases these changes appear as propagated waveforms along their long axes. In addition, short fibrils, termed keratin squiggles, are seen at the cell periphery where they move mainly towards the cell center. The motile properties of keratin IFs are also compared with those of type III IFs (vimentin) in PtK2 cells. Intriguingly, the dynamic properties of keratin tonofibrils and squiggles are dramatically different from those of vimentin fibrils and squiggles within the same cytoplasmic regions. This suggests that there are different factors regulating the dynamic properties of different types of IFs within the same cytoplasmic regions.
🔬 Techniques
🔭 Microscopes
💻 Software
✨ Fluorophores
🧪 Sample Preparation
🔬 Cell Lines
🏭 Microscope Brands
🧪 Reagent Suppliers
💻 Software Details
🏛️ Research Organizations (ROR)
Affiliated research institutions:
📋 Methods
GFP-Keratin cDNA Constructs
All restriction enzymes and DNA modifying enzymes were purchased from GIBCO BRL. Other reagents were from Sigma-Aldrich, unless otherwise noted. GFP- and yellow fluorescent protein (YFP)-tagged keratin cDNA constructs were prepared by fusing GFP and YFP to the NH 2 termini of keratin cDNAs. Human K8–pUC18 and human K18–pBluescript SK + were provided by Dr. Bishr Omary (Stanford University, Palo Alto, CA). The complete human keratin 8 cDNA sequence ( Hofmann and Franke 1997 ) was amplified by PCR using primers that create the restriction enzyme sites for BamHI at the 5′ and 3′ ends. The resulting fragment was subcloned into the BamHI site of pEGFP-C1 and pEYFP-C1 (CLONTECH Laboratories, Inc.) to generate GFP-K8 and YFP-K8, respectively. GFP-K8–FLAG was created by inserting the epitope sequence of FLAG (also known as octapeptide; GACTACAAAGACGATGACGACAAG) to the COOH terminus of GFP-K8. The complete human K18 cDNA sequence ( Oshima et al. 1986 ) was also amplified by PCR using primers that create the restriction enzyme sites for EcoRI at the 5′ end and XbaI at the 3′ end. The resulting fragment was subcloned into EcoRI/XbaI sites of pEGFP-C1 to generate GFP-K18. K18-myc was made by PCR to generate the restriction enzyme sites for HindIII at the 5′ end and for XhoI at the 3′ end of K18 and to subclone into HindIII/XhoI sites of pcDNA3 containing the myc epitope sequence (CAAGAGCAAGAAGAGGACTTGAATGTC) at the COOH terminus of the XhoI site (Invitrogene). GFP-K18–myc was prepared by subcloning the HindIII-XbaI fragment containing K18-myc into HindIII/XbaI sites of pEGFP-C3. GFP-vimentin cDNA construct was described elsewhere ( Yoon et al. 1998 ). Cyan fluorescent protein (CFP)-vimentin was generated by subcloning the BamHI-BamHI fragment containing the complete human vimentin cDNA ( Chou et al. 1996 ) into the BamHI site of pECFP-C1. All cDNA constructs were purified by CsCl 2 density–gradient centrifugation and verified by DNA sequencing ( Sambrook et al. 1989 ).
Show full methods section
GFP-Keratin cDNA Constructs
All restriction enzymes and DNA modifying enzymes were purchased from GIBCO BRL. Other reagents were from Sigma-Aldrich, unless otherwise noted. GFP- and yellow fluorescent protein (YFP)-tagged keratin cDNA constructs were prepared by fusing GFP and YFP to the NH 2 termini of keratin cDNAs. Human K8–pUC18 and human K18–pBluescript SK + were provided by Dr. Bishr Omary (Stanford University, Palo Alto, CA). The complete human keratin 8 cDNA sequence ( Hofmann and Franke 1997 ) was amplified by PCR using primers that create the restriction enzyme sites for BamHI at the 5′ and 3′ ends. The resulting fragment was subcloned into the BamHI site of pEGFP-C1 and pEYFP-C1 (CLONTECH Laboratories, Inc.) to generate GFP-K8 and YFP-K8, respectively. GFP-K8–FLAG was created by inserting the epitope sequence of FLAG (also known as octapeptide; GACTACAAAGACGATGACGACAAG) to the COOH terminus of GFP-K8. The complete human K18 cDNA sequence ( Oshima et al. 1986 ) was also amplified by PCR using primers that create the restriction enzyme sites for EcoRI at the 5′ end and XbaI at the 3′ end. The resulting fragment was subcloned into EcoRI/XbaI sites of pEGFP-C1 to generate GFP-K18. K18-myc was made by PCR to generate the restriction enzyme sites for HindIII at the 5′ end and for XhoI at the 3′ end of K18 and to subclone into HindIII/XhoI sites of pcDNA3 containing the myc epitope sequence (CAAGAGCAAGAAGAGGACTTGAATGTC) at the COOH terminus of the XhoI site (Invitrogene). GFP-K18–myc was prepared by subcloning the HindIII-XbaI fragment containing K18-myc into HindIII/XbaI sites of pEGFP-C3. GFP-vimentin cDNA construct was described elsewhere ( Yoon et al. 1998 ). Cyan fluorescent protein (CFP)-vimentin was generated by subcloning the BamHI-BamHI fragment containing the complete human vimentin cDNA ( Chou et al. 1996 ) into the BamHI site of pECFP-C1. All cDNA constructs were purified by CsCl 2 density–gradient centrifugation and verified by DNA sequencing ( Sambrook et al. 1989 ).
Cell Cultures and Transient Transfection
SW13 vim − cells (a gift from Dr. Robert Evans, University of Colorado, Denver, CO) were grown in DME with 10% FCS and antibiotics (100 U/ml penicillin and streptomycin). HeLa, MCF-7, and PtK2 epithelial cells were grown in MEM with 10% FCS, 5 mM sodium pyruvate, 0.1 mM nonessential amino acid solution (GIBCO BRL), and antibiotics. GFP-, YFP-, and CFP-tagged keratin and vimentin cDNA constructs were transiently transfected according to Huang et al. 1998 . Subconfluent cells grown in 100-mm dishes were trypsinized and suspended in 250 μl of culture medium containing 10 mM Hepes, pH 7.1. The suspension was mixed with 7 μg of target DNA and 13 μg of sheared salmon sperm DNA (Amresco Inc.). In cotransfection experiments, 5 μg of each target DNA and 10 μg of sheared salmon sperm DNA were used. Subsequently, the suspension was electroporated at 0.25 V/960 μFD (Gene Pulser II; Bio-Rad Laboratories) and plated onto 35-mm dishes. It should be noted that the results obtained in cells transfected with GFP-keratin cDNA constructs with or without the myc or FLAG tag were identical (data not shown).
Microinjection
A monoclonal antibody against dynein intermediate chain (clone 70.1; Sigma-Aldrich) was dialyzed against PBS and concentrated to a final concentration of 1 mg/ml ( Burkhardt et al. 1997 ). PtK2 cells grown onto locator coverslips (Bellco Glass, Inc.) were microinjected using an automated microinjection system (Eppendorf Scientific, Inc.) and then returned to a CO 2 incubator at 37°C, as described previously ( Goldman et al. 1996 ). At 3–4 h after microinjection, cells were fixed for immunofluorescence or maintained live for time-lapse observations.
Immunofluorescence
Indirect immunofluorescence was carried out as described by Miller et al. 1993 . The primary antibodies used were rabbit polyclonal anti–bovine tongue keratin ( Jones et al. 1988 ), polyclonal antioctapeptide (anti-FLAG; Zymed Laboratories), mouse monoclonal anti–vimentin (V9; Sigma-Aldrich), monoclonal anti–β-tubulin (Amersham Pharmacia Biotech), monoclonal antitransferrin receptor (Zymed Laboratories), or monoclonal anti-myc (9E10; Evan et al. 1985 ). The secondary antibodies used were Alexa 488– or Alexa 633–conjugated goat anti–mouse IgG, Alexa 633–conjugated goat anti–mouse IgM, or Alexa 568–conjugated goat anti–rabbit IgG (Molecular Probes Inc.). Alexa 568–conjugated phalloidin (Molecular Probes Inc.) was also used to label microfilaments (MFs).
Live Cell Studies
Transfected cells were trypsinized at 48 h after transfection and replated onto coverslips to achieve 70% confluence in culture medium containing 10 mM Hepes, pH 7.1. For time-lapse observations and FRAP analyses, coverslips were placed on slides with glass feet, sealed with a mixture of vaseline, beeswax, and lanolin (1:1:1), and maintained at 37°C with an air-stream stage incubator (ASI 400; Nevtek) ( Yoon et al. 1998 ). In some cases, transfected cells were treated with nocodazole and/or cytochalasin B at final concentrations of 10 and 2 μM, respectively. In other cases, calyculin A (Calbiochem) was used at a final concentration of 0.5 nM. For energy depletion studies, 50 mM 2-deoxy-glucose and 0.05% sodium azide were added to glucose-deficient culture medium ( Yoon et al. 1998 ). Time-Lapse Observations Time-lapse observations were made with a ZEISS LSM 510 confocal microscope equipped with a 100×, 1.4 NA oil immersion objective. GFP images were acquired by excitation at 488 nm and emission at 515–545 nm. YFP and CFP images were simultaneously collected by excitation at 458 and 514 nm and emission at 475–525 and 530 nm, respectively. Images of GFP-keratin were collected every 2–15 min for periods up to 3 h, and images of GFP-vimentin were collected every 30 s for up to 40 min in the same focal plane (see Yoon et al. 1998 ). Phase–contrast images of cells were taken before, during, and immediately after time-lapse observations to ensure that there were no significant changes in cell shape and position during periods of observation.
Fluorescence Recovery after Photobleaching Analyses
FRAP analyses were carried out with the confocal microscope as described by Yoon et al. 1998 . For PtK2 cells expressing both YFP-K8 and CFP-vimentin, bar-shaped regions were bleached at 458 and 514 nm for 3 s, and recovery was monitored at 2-min intervals. For PtK2 cells expressing either GFP-K8/K18 or GFP-vimentin, bar-shaped regions were bleached at 488 nm for 3 s, and recovery was monitored at 15-min intervals for GFP-K8/K18 tonofibrils and at 2-min intervals for GFP-vimentin fibrils. Phase–contrast images of cells were taken before and immediately after FRAP analyses to ensure that there were no significant changes in cell shape and position. Shear Stress Experiments For shear stress studies, PtK2 cells grown on Bioptics coverslips were subjected to uniform laminar (two-dimensional) flow in a temperature-controlled parallel plate flow chamber (FCS2; Bioptics, Inc.) ( Helmke et al. 2000 ) mounted on the stage of the confocal microscope. Shear stress, τ (dyn/cm 2 ) was calculated from the following relation: τ = 3 Qv /2 a 2 ω, where Q = volumetric flow rate (ml/s), v = culture medium viscosity (Poise), a = channel half height (cm), and ω = channel width (cm). A peristaltic pump was calibrated and used to generate known rates of flow. The viscosity of the culture medium measured at 37°C was 7.339 × 10 −3 Poise using an Ostwald viscometer. The channel width is assumed to be the same as the dimension of the T-bar in the chamber (1.3 cm). The channel half height is governed by the thickness of the gasket (0.2 mm).
Image Analysis
As indicated above, analyses of the motile properties of GFP-tagged IFs were restricted to cells that exhibited no obvious shape changes as determined by phase–contrast microscopy. If the average displacement of a cell's margins was >0.08 μm in 40 min (0.02 μm/min), it was excluded from the analyses. This ensured that any recorded movements of IFs were due to their intrinsic properties and not passive reflections of significant changes in cell shape (see Yoon et al. 1998 ). Position, length, and grayscale pixel values were measured on digitized confocal images using the Metamorph image analysis program (Universal Imaging Corp.). Pixel values were converted to distance using the confocal scale bars. The average rate of movement was determined by calculating distance versus time. To adjust for sample fading during FRAP analyses, the average grayscale pixel value of the prebleach image was measured, and this value was used to normalize the intensity level of subsequent images ( Yoon et al. 1998 ). Fluorescence recovery t 1/2 were estimated by measuring the average grayscale pixel values across bleached fibrils at each time point using the line-scan function. All data were reported as mean ± SDs.
Preparation of IF-enriched Cytoskeletons and Immunoblotting Analyses
IF-enriched cytoskeletal preparations ( Zackroff and Goldman 1979 ) were made from PtK2 cells after treatment with 0.5 nM calyculin A for 30 min. These preparations were separated by SDS-PAGE ( Laemmli 1970 ). Immunoblotting was carried out according to Towbin et al. 1979 . The primary antibodies used were mouse monoclonal K8-pSer431 (5B3; Ku and Omary 1997 ), monoclonal K18-pSer33 (IB4; Ku and Omary 1998 ), and rabbit polyclonal anti-K8/K18 (R275). The secondary antibodies used were peroxidase-conjugated goat anti–mouse IgG or peroxidase-conjugated goat anti–rabbit IgG (Jackson ImmunoResearch Laboratories). Online Supplemental Material The QuickTime videos from which images of Fig. 3 (FRAP analyses), Fig. 5 (shape change and wave propagation), and Fig. 6 (translocation of squiggles) were taken can be found at http://www.jcb.org/cgi/content/full/153/3/503/DC1.
Online Supplemental Material The QuickTime videos from which images of Fig. 3 (FRAP analyses), Fig. 5 (shape change and wave propagation), and Fig. 6 (translocation of squiggles) were taken can be found at http://www.jcb.org/cgi/content/full/153/3/503/DC1.
Supplemental Material [Supplemental Material Index]
📊 Figures
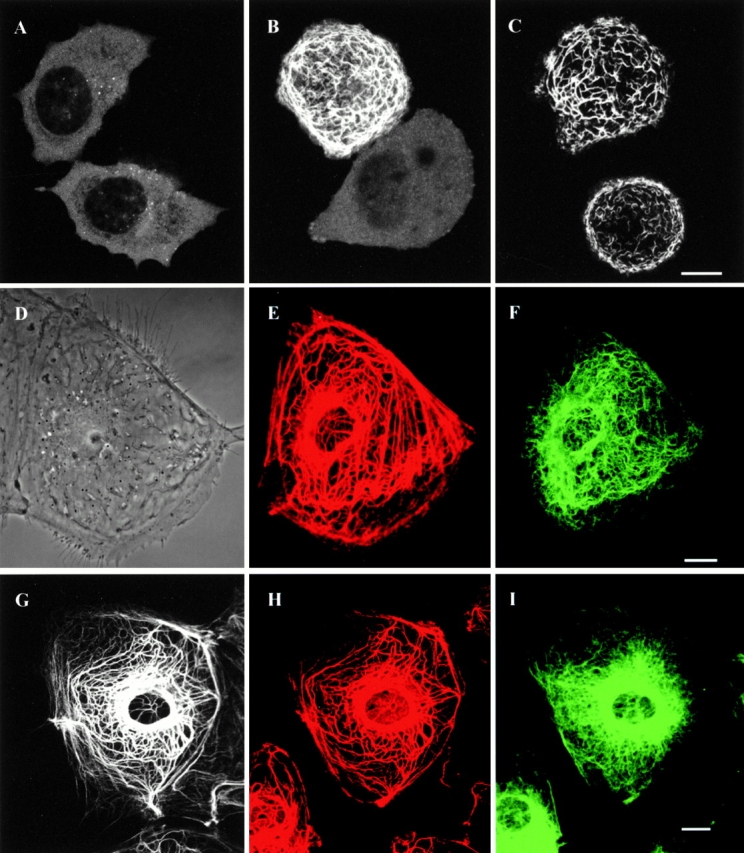
Figure 1
(A) No filamentous networks are seen in live SW13 vim u2212 cells expressing GFP-K8 alone. Transfected cells display mainly diffuse and punctate fluorescence patterns. (B) Cotransfection with GFP-K8 a...
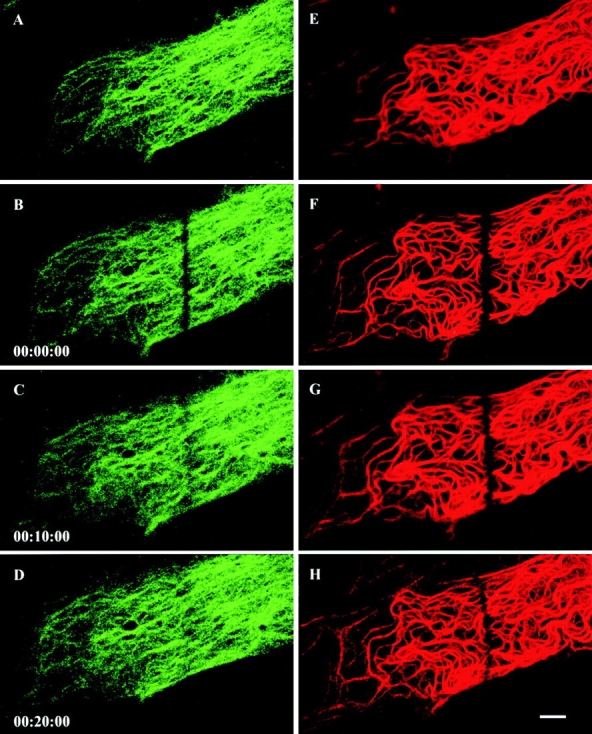
Figure 2
FRAP analyses of CFP-vimentin fibrils and YFP-K8 tonofibrils in the same live PtK2 epithelial cell. Bar-shaped regions are photobleached, and recovery of fluorescence is monitored at 2-min intervals f...
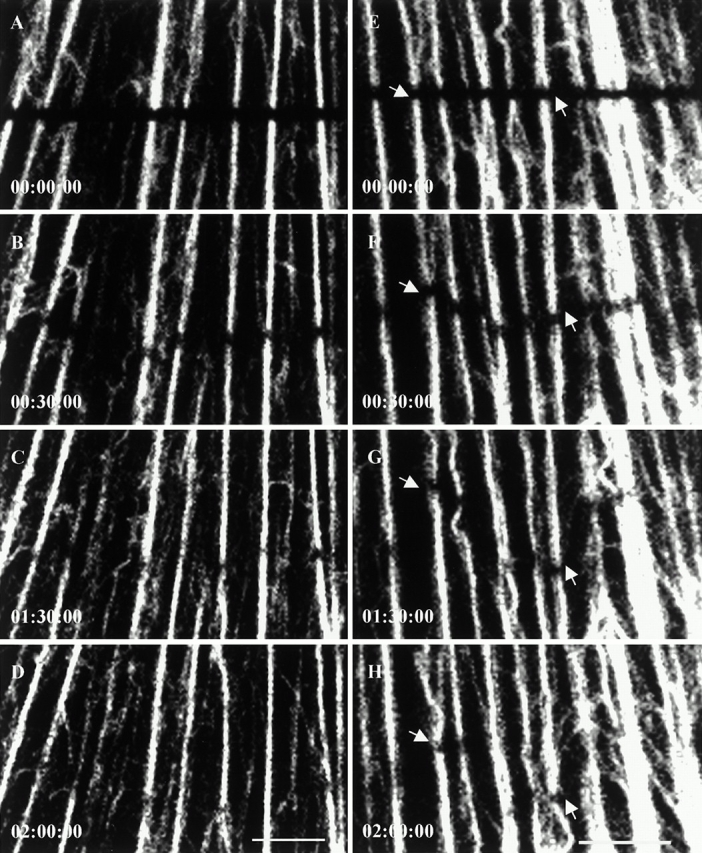
Figure 3
FRAP analyses of tonofibrils containing GFP-K8 (Au2013D) and GFP-K18 (Eu2013H) in live PtK2 cells. Bar-shaped regions are photobleached, and fluorescence recovery is monitored at 15-min intervals. Ble...
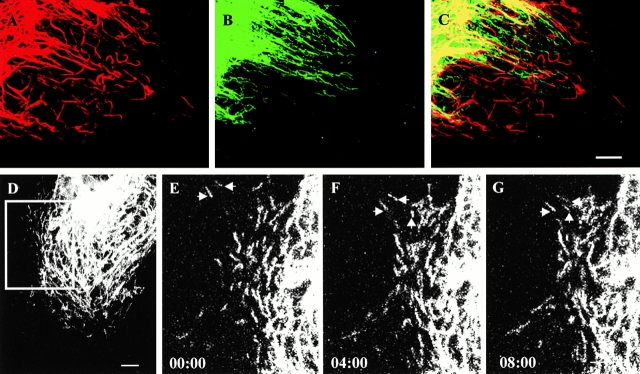
Figure 6
(Au2013C) The overall distributions of keratin and vimentin squiggles are compared in an untransfected PtK2 cell after fixation and processing for double immunofluorescence. Keratin squiggles (A) and ...
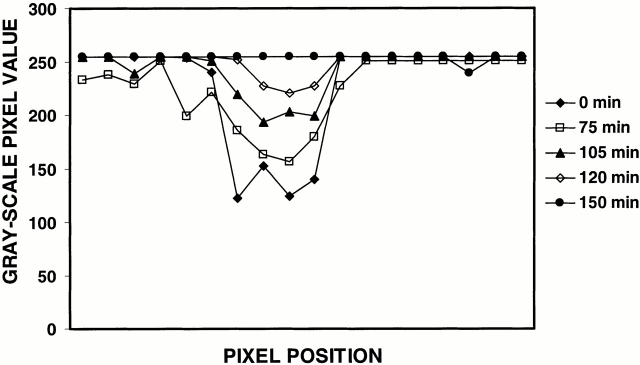
Figure 4
Fluorescence intensity measurements along photobleached tonofibrils in live PtK2 cells. Grayscale pixel values are measured along the bleach zone of a tonofibril containing GFP-K18 at each time point ...
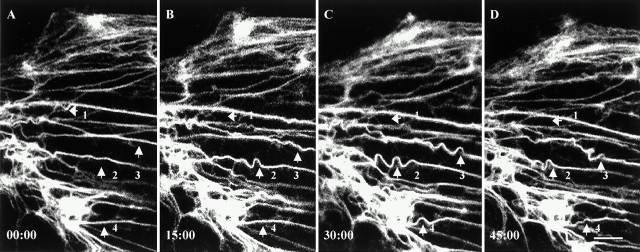
Figure 5
Time-lapse observations of tonofibrils in live PtK2 cells transfected with GFP-K18. These fibrils exhibit extensive bending or wave-like movements. In many instances, these waveforms appear to be prop...
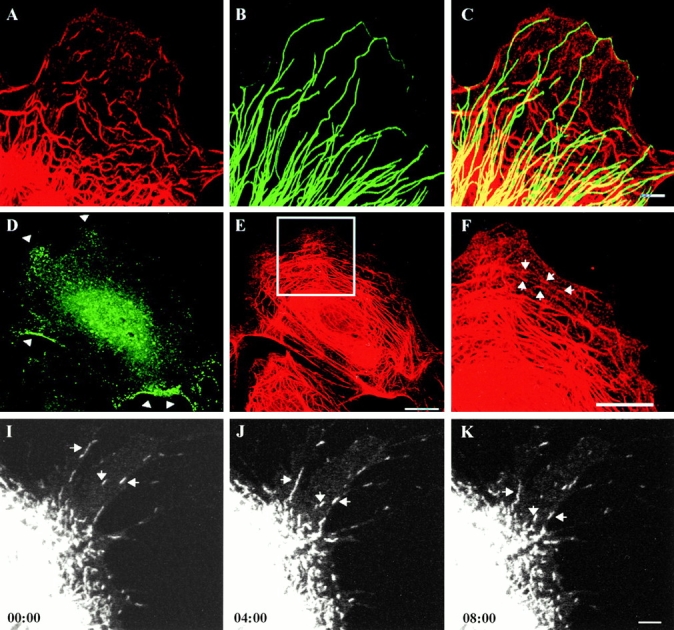
Figure 8
(Au2013C) The relationship between keratin squiggles and MTs in an untransfected PtK2 cell. Keratin squiggles (A) are visualized with rabbit antiu2013bovine tongue keratin and MTs (B) with a monoclona...
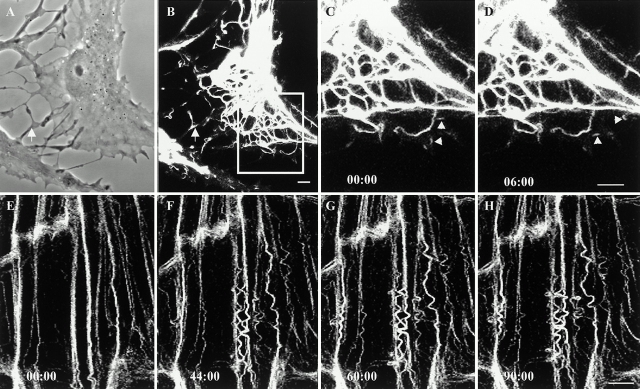
Figure 7
(Au2013D) Time-lapse observations of GFP-K18 are made in a live PtK2 cell after treatment with 20 u03bcM cytochalasin B for 30 min. Cell margins are retracted, and the overall morphology is arborized ...
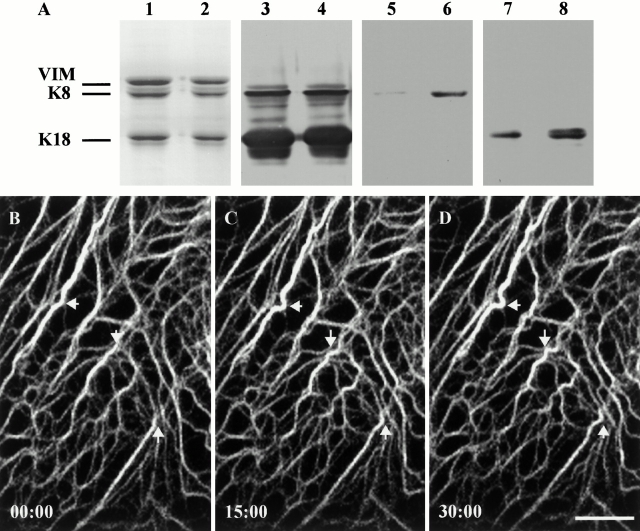
Figure 9
(A) PtK2 cells were cultured in the absence or presence of calyculin A (0.5 nM for 30 min). Subsequently, IF-enriched cytoskeletal preparations were made, and equal amounts of protein were loaded per ...
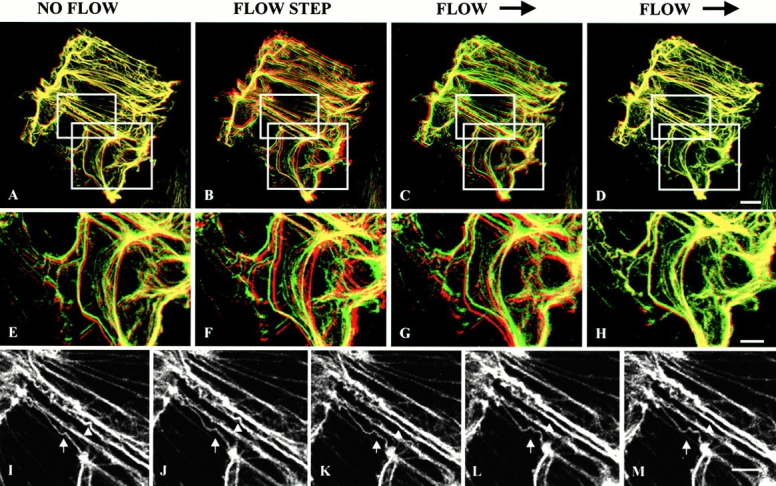
Figure 10
GFP-K18 images are compared before and after a step increase in flow applied to PtK2 cells. Confocal images at 2-min intervals are pseudocolored red and green. Flow direction is left to right. In merg...
Figure images are served from the NIH/NLM PubMed Central Open Access Subset or Europe PMC; copyright remains with the publishers and authors.
💬 Discussion
0 commentsNo comments yet. Be the first to start a discussion!
Leave a Comment