Abstract
The mammalian vomeronasal organ encodes pheromone information about gender, reproductive status, genetic background and individual differences. It remains unknown how pheromone information interacts to trigger innate behaviors. In this study, we identify vomeronasal receptors responsible for detecting female pheromones. A sub-group of V1re clade members recognizes gender-identifying cues in female urine. Multiple members of the V1rj clade are cognate receptors for urinary estrus signals, as well as for sulfated estrogen (SE) compounds. In both cases, the same cue activates multiple homologous receptors, suggesting redundancy in encoding female pheromone cues. Neither gender-specific cues nor SEs alone are sufficient to promote courtship behavior in male mice, whereas robust courtship behavior can be induced when the two cues are applied together. Thus, integrated action of different female cues is required in pheromone-triggered mating behavior. These results suggest a gating mechanism in the vomeronasal circuit in promoting specific innate behavior.DOI: http://dx.doi.org/10.7554/eLife.03025.001.
🔬 Techniques
✨ Fluorophores
🧪 Sample Preparation
🏭 Microscope Brands
🧪 Reagent Suppliers
📷 Detectors
🔎 Objectives
💻 Software Details
📋 Protocols
💾 Data Repositories
🏛️ Research Organizations (ROR)
Affiliated research institutions:
📋 Methods
Mice
All mice were maintained in Lab Animal Service Facility of Stowers Institute at 12:12 light/dark cycle and provided with food and water ad libitum . Experimental protocols were approved by the Institutional Animal Care and Use Committee at Stowers Institute (Protocol 2013-0117) and were in compliance with NIH Guide for Care and Use of Animals. TetO-GCaMP2 ( He et al., 2008 ) mice and OMP-IRES-tTA (OIVT) ( Yu et al., 2004 ) mice were described previously. These two lines were crossed to induce GCaMP2 expression in the vomeronasal and olfactory sensory neurons. Responses to urine and other chemical stimuli were recorded from the VNO isolated from OIVT; tetO-GCaMP2 mice at 2-6 months of age. To generate the tetO-V1r-IRES-tdTomato lines, coding region of either V1re9, V1re12, V1rj2 or V1rj3 was cloned from the genomic DNA of C57BL/6 mice by PCR and placed in between the tetracycline-dependent promoter (tetO) and IRES-tdTomato. The DNA was then linearized and injected to the pronuclei of zygotes from F1 (CBA/J; C57Bl/10J) mice. Founders were crossed to OIVT and Gγ8-tTA ( Nguyen et al., 2007 ) to generate compound heterozygotes containing OIVT, Gγ8-tTA and tetO-V1r-IRES-tdTomato alleles so that ectopic V1rs are expressed in the VNO. These mice are further crossed to TetO-GCaMP2 mice to generate compound heterozygotes containing all four alleles. Sexually naïve 3-month-old male C57BL/6J mice were used to examine courtship behaviors. Overiectomized females were prepared using 2-month-old BALB/c females by enucleating the ovaries. These females were used as recipient females at 3–6 months of age. To collect urine samples from females at different estrous status, 3- to 4-week-old female C57BL/6 mice were injected with pregnant mare's serum gonadotropin (PMSG) to induce synchronized estrus. Urine samples and chemicals Urine samples were collected from 5 IU of PMSG-injected females from 1 day before to 5 days after injection in metabolic cages. Urine collected 2–3 days after PMSG injection were considered as estrus samples. Non-estrus samples were collected 4–5 days after PMSG injection. The freshly collected urine samples were centrifuged to remove solid contaminants and frozen at −80°C until use. For calcium imaging experiments, each urine sample was diluted 100 times with Ringer's solution (in mM: 125 NaCl, 2.5 KCl, 2 CaCl 2 , 2 MgCl 2 , 25 NaHCO 3 , 10 HEPES and 10 glucose). For behavioral experiments, each urine sample was painted to recipient females without dilution. Sulfated steroids were purchased from Steraloids (Newport, RI), the catalog IDs were used to label the compounds. The sulfated steroids used in this study are summarized in the Supplementary file 3 . Each steroid was diluted with dimethyl sulfoxide (DMSO) to generate 20 mM stock solution before further diluted with Ringer's solution to the concentrations tested.
Show full methods section
Mice
All mice were maintained in Lab Animal Service Facility of Stowers Institute at 12:12 light/dark cycle and provided with food and water ad libitum . Experimental protocols were approved by the Institutional Animal Care and Use Committee at Stowers Institute (Protocol 2013-0117) and were in compliance with NIH Guide for Care and Use of Animals. TetO-GCaMP2 ( He et al., 2008 ) mice and OMP-IRES-tTA (OIVT) ( Yu et al., 2004 ) mice were described previously. These two lines were crossed to induce GCaMP2 expression in the vomeronasal and olfactory sensory neurons. Responses to urine and other chemical stimuli were recorded from the VNO isolated from OIVT; tetO-GCaMP2 mice at 2-6 months of age. To generate the tetO-V1r-IRES-tdTomato lines, coding region of either V1re9, V1re12, V1rj2 or V1rj3 was cloned from the genomic DNA of C57BL/6 mice by PCR and placed in between the tetracycline-dependent promoter (tetO) and IRES-tdTomato. The DNA was then linearized and injected to the pronuclei of zygotes from F1 (CBA/J; C57Bl/10J) mice. Founders were crossed to OIVT and Gγ8-tTA ( Nguyen et al., 2007 ) to generate compound heterozygotes containing OIVT, Gγ8-tTA and tetO-V1r-IRES-tdTomato alleles so that ectopic V1rs are expressed in the VNO. These mice are further crossed to TetO-GCaMP2 mice to generate compound heterozygotes containing all four alleles. Sexually naïve 3-month-old male C57BL/6J mice were used to examine courtship behaviors. Overiectomized females were prepared using 2-month-old BALB/c females by enucleating the ovaries. These females were used as recipient females at 3–6 months of age. To collect urine samples from females at different estrous status, 3- to 4-week-old female C57BL/6 mice were injected with pregnant mare's serum gonadotropin (PMSG) to induce synchronized estrus. Urine samples and chemicals Urine samples were collected from 5 IU of PMSG-injected females from 1 day before to 5 days after injection in metabolic cages. Urine collected 2–3 days after PMSG injection were considered as estrus samples. Non-estrus samples were collected 4–5 days after PMSG injection. The freshly collected urine samples were centrifuged to remove solid contaminants and frozen at −80°C until use. For calcium imaging experiments, each urine sample was diluted 100 times with Ringer's solution (in mM: 125 NaCl, 2.5 KCl, 2 CaCl 2 , 2 MgCl 2 , 25 NaHCO 3 , 10 HEPES and 10 glucose). For behavioral experiments, each urine sample was painted to recipient females without dilution. Sulfated steroids were purchased from Steraloids (Newport, RI), the catalog IDs were used to label the compounds. The sulfated steroids used in this study are summarized in the Supplementary file 3 . Each steroid was diluted with dimethyl sulfoxide (DMSO) to generate 20 mM stock solution before further diluted with Ringer's solution to the concentrations tested.
Calcium imaging with VNO slices
Details of imaging setup and procedures were described previously ( Ma et al., 2011 ). Briefly, VNO slices were maintained in carboxygenated (95% O 2 , 5% CO 2 ) mouse artificial cerebrospinal fluid (mACSF; in mM: 125 NaCl, 2.5 KCl, 1 MgCl 2 , 2 CaCl 2 , 1.25 NaH 2 PO 4 , 25 NaHCO 3 and 10 glucose) at room temperature. Carboxygenated mACSF was also used to superfuse VNO slices at a speed of 1 ml/min. The flow was kept unidirectional by placing the inlet and outlet at the apical and basal sides of VNO epithelium, respectively. Urine samples and steroids were delivered through the HPLC injection valve in Ringer's solution. To minimize mechanical artifacts, a continuous flow (∼0.3 ml/min) of Ringer's solution was maintained during the experiment. Solutions were switched by using the injection valve without disrupting the flow. Time-lapse acquisition of GCaMP2 signals from a VNO slice was performed on AxioScope FS2 (Carl Zeiss, Oberkochen, Germany) microscope with a 20X/0.5NA water-dipping lens. In experiments using OMP-IRES-tTA; tetO-GCaMP2 mice, GCaMP2 was excited at 930 nm (Ti-Sapphire laser, Coherent, Santa Clara, CA) and visualized through a 685 nm short-pass emission filter. In the experiment of Gg8-tTA; OMP-IRES-tTA; tetO-V1r-tdTomato; tetO-GCaMP2 mice, TdTomato and GCaMP2 were excited at 950 nm and visualized through 560 nm long-pass and 500–550 band-pass filters, respectively. Image processing and data analysis, including region of interest (ROI) detection and automated signal analyses, were performed using computer programs written in Matlab. For ROI detection, VNO images for each stimulus were first registered using the elastic registration library function of Axovision (Carl Zeiss), with the first frame chosen as reference. Then, for each stimulus, the local (specific to the stimulus) ROIs were detected in two steps: (1) generate ROI candidates by using a customized signal-to-noise ratio criteria; (2) select the candidates as ROIs with manual inspection. Subsequently, the local ROIs were integrated to generate a list of global (non-specific to any stimulus) ROIs. For signal peak analysis, the temporal profiles of image intensity at the global ROIs were individually extracted as raw signals and a scalar value ΔF/F was calculated. In order to compute F, a baseline fitting step was performed to model photo-bleaching effect and a peak detection step was performed to model the signal peak. ΔF was computed as the difference between the signal peak and the baseline. The computation was then manually validated to exclude possible errors. A threshold of 30% ΔF/F was imposed to identify VSNs as responding to a stimulus.
Receptor cloning
To isolate VSNs exhibiting a specific response profile, calcium imaging was conducted with a 40X/0.8NA water-dipping lens. GCaMP2 signal was excited by EXFO X-Cite 120PC light source equipped with a band-pass filter (450–490 nm). The epifluorescent images were acquired by a CCD camera (Carl Zeiss HRM). Under bright-field and superimposed fluorescent illumination, the cytoplasmic content of an identified VSN was aspirated into a glass capillary (2 μm tip size). The content was transferred to a PCR tube containing lysis buffer ( Kurimoto et al., 2007 ). Samples were immediately frozen on dry ice and kept at −80°C until use. cDNAs of each sample was reverse transcribed from total RNA and amplified by the procedure described previously ( Kurimoto et al., 2007 ). First-strand cDNAs were synthesized using a V1 (dT) 24 primer. Unreacted primer was specifically eliminated by exonuclease treatment and second strands were then generated with a V3 (dT) 24 primer after poly(dA) tailing of the first-strand cDNAs. By again using V1 (dT) 24 and V3 (dT) 24 primers, the double-stranded cDNAs were then amplified by 20-cycle-PCR. V1r or V2r genes were amplified by 17 V1r and 7 V2r degenerate PCR primers ( Supplementary file 1 ). Each primer pair was examined for the coverage of members of each receptor group by performing RT-PCR analysis by using either pooled VNO mRNA samples or single cell samples ( Supplementary file 2 ). PCR products were cloned into pGEM-T vector followed by sequence analysis. The sequence annotation was conducted by using the custom-made program with the custom-made receptor database containing all identified VRs. In situ hybridization In situ hybridization is performed following the protocol described by Ishii et al. (2004) . Urine purification 4 ml of urine was incubated with 2 g of a polymeric adsorbent resin, Amberlite XAD4 (Sigma-Aldrich, St. Louis, MO), overnight at 4°C. After incubation, the mixture of urine and the resin was transferred to a poly-prep chromatography column (Bio-rad, Hercules, CA) and the flow-through was gravitationally collected. 35 ml of ultrapure water and the same amount of acetone were sequentially applied to the resin, and eluted fractions were collected, lyophilized and stored at −20°C until use. The acetone fraction was dissolved in 30% methanol (MeOH), 0.1% trifluoroacetic acid (TFA) in water and passed through a 0.2 μm PTFE membrane filter (Sigma-Aldrich). The filtrated sample was then loaded onto a reverse-phase high-performance liquid chromatography (HPLC) column (Atlantis T3, 10 mm × 250 mm, Waters, Milford, MA). Bound compounds were eluted with a gradient of 30–80% MeOH, 0.1% TFA in water at 4 ml/min, and eluted fractions were collected every 2 min (fraction T1-25). Fractions were lyophilized and stored at −20°C until use. For VNO imaging experiment, lyophilized fractions were dissolved in Ringer’s solution with final concentration correspond to 1/10 of the original urine sample used. For behavioral experiment, lyophilized T16 fraction was dissolved in PBS with the final concentration was equivalent to the original urine sample used. Electro-olfactogram (EOG) recordings Field potentials were recorded from the ciliated layer of intact MOE. Briefly, the MOE was exposed and perfused with oxygenated mACSF. Field potential was recorded using glass pipettes (10 μm diameter) connected to an AI 401 pre-amplifier (Molecular Devices, Sunnyvale, CA). The signals were further amplified by a signal conditioner (Molecular Devices), digitized at 1 kHz by Digidata 1322A (Molecular Devices), low-pass filtered at 20 Hz and further analyzed using pCLAMP. Stimuli were delivered through a second glass pipette controlled by the HPLC injection valve. Applications of ACSF and 0.1% DMSO were used for evaluating the baseline activities. Multiple applications of 2-heptanone (twice at a beginning and once at the last) was used for evaluating the tissue viability.
Behavior assay
Individual males were single-housed for at least 3 weeks without bedding change prior to the test. Assays were performed in the home cages. Males were habituated to the behavioral room by transferring their cages to the room for 1 hr each day for 3 days prior to the assay. On the day of assay, males were again habituated for 30 min before recipient females were introduced into male cages. The females were painted with one of the following stimuli: vehicle (PBS), estrus or non-estrus urine, 10 μM sulfated estrogens (E1050, E1103) in vehicle or in none-estrus urine, HPLC fraction in vehicle or with 10 μM sulfated estrogens. The stimuli were painted on the anogenital area and dried for 10 min before the females were introduced to male home cages. All assays were conducted in the dark cycle of the animals and video-taped. To minimize the influence of behavioral differences of the recipient females, each female was randomly assigned to each of the stimuli and used multiple times with at least 2 weeks of interval. For aggression assay, individual males were singly housed for 2–3 weeks. During the test, a group-housed CBA male was introduced to the home cage of the resident male. All the behavioral data were scored manually using Observer XT software (Noldus Information Technology, Wageningen, Netherlands). Male mounting behavior was counted based on the definitions as follows: (1) males approach females and run his head first along her flank then onto the back, (2) male arms are locked in front over female's hips and over her middle section so that males and females are positioned genital to genital, (3) males show the pelvic thrust with a stable frequency. At least 10 naïve males were tested with each stimulus. Male aggression was scored when the resident male attacked and bit the flank of the intruder male. Kruskal–Wallis test and Mann–Whitney's post-hoc test were used to analyze the data on the frequency, duration and latency of mounting behavior.
Additional files 10.7554/eLife.03025.022 Supplementary file 1. Summary of degenerate PCR primers. List of primers designed against different clade members of the V1r and V2r families of genes. DOI: http://dx.doi.org/10.7554/eLife.03025.022 10.7554/eLife.03025.023 Supplementary file 2. Coverage of degenerate primers. Receptor genes identified from degenerate RT-PCR using whole VNO and single cells. Results from single cells are pooled from multiple experiments. In the Coverage column, bold face numbers indicate 100% coverage of the clade members and italicized numbers indicate coverage lower than 50%. DOI: http://dx.doi.org/10.7554/eLife.03025.023 10.7554/eLife.03025.024 Supplementary file 3. Sulfated steroids tested. List of the Steraloids IDs and names of sulfated steroids tested in the experiments. DOI: http://dx.doi.org/10.7554/eLife.03025.024
📊 Figures
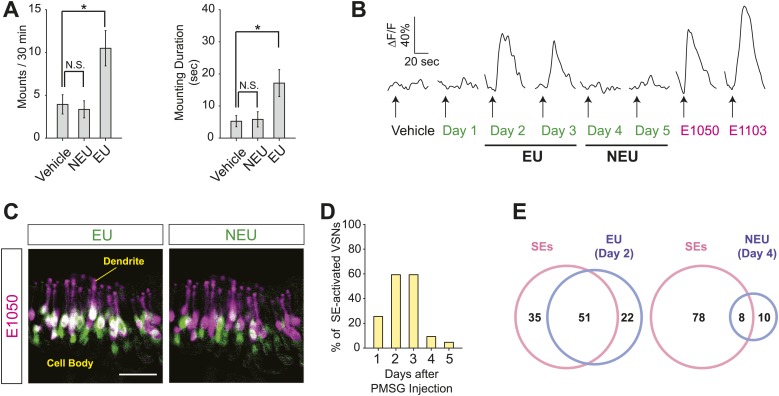
Figure 1.
Sulfated estrogens mimic the activity of estrus signal in urine.
( A ) The number (left) and duration (right) of mounting behavior of sexually nau00efve males toward ovariectomized females painted with vehicle (n = 16), non-estrus urine (NEU; n = 14) or estrus urin...
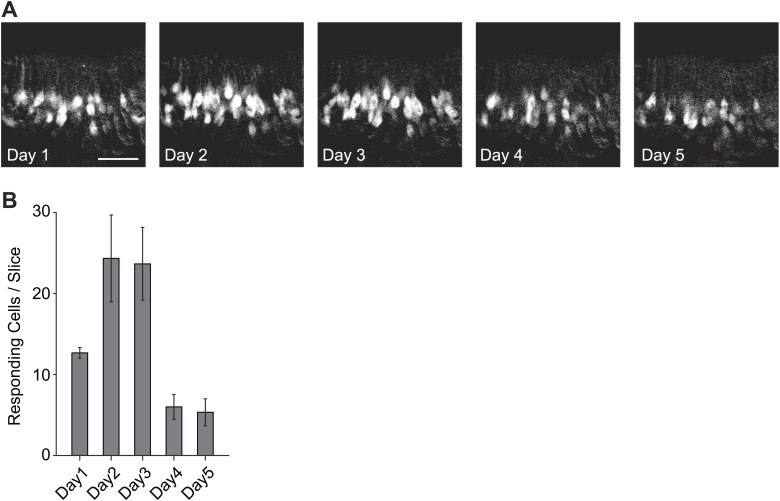
Figure 1u2014figure supplement 1.
Activation of the VSNs by female mouse urine.
( A ) Representative images of the VNO slice response pattern to urine samples collected from females 1 to 5 days after PMSG injection. Scale bar, 50 u03bcm. ( B ) Bar graph showing the number of resp...
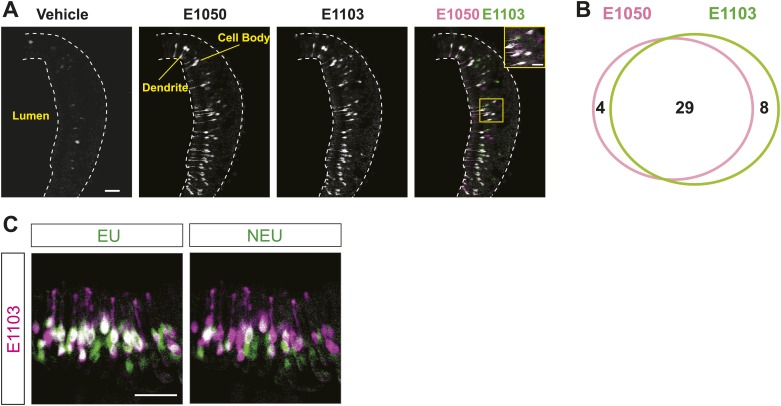
Figure 1u2014figure supplement 2.
Activation of the VSNs by sulfated estrogen E1050 and E1103.
( A ) Representative images of a GCaMP2 VNO slice responding to vehicle, 100 nM E1050 and E1103. Bright cells are the activated neurons. VSNs responding to E1050 (magenta) or E1103 (green) are color-c...
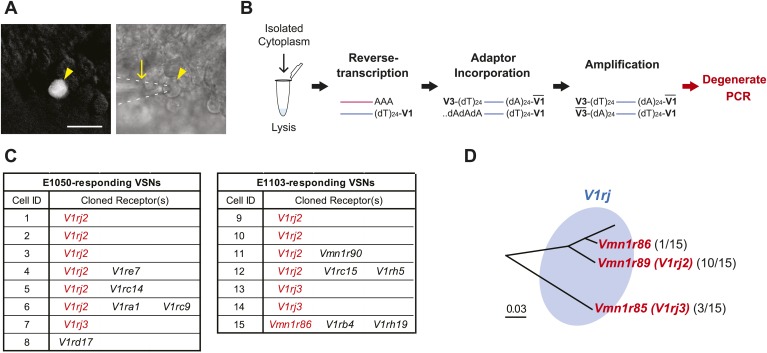
Figure 2.
VSNs responding to estrus signal express V1rj receptors.
( A ) Representative images of the single-cell isolation procedure. Arrowheads indicate a responding cell illuminated under fluorescence (left), which is aspirated into a micro-capillary (arrow) under...
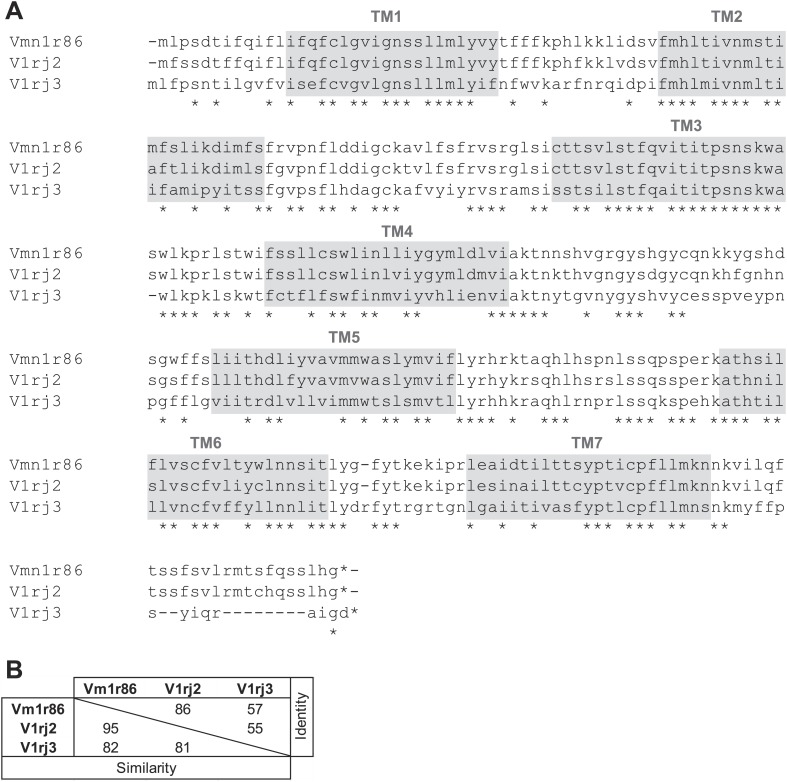
Figure 2u2014figure supplement 1.
Members of V1rj group receptors are homologous to each other.
( A ) Alignment of amino acid sequences of the members of V1Rj group receptors found in sulfated estrogens responding cells. Identical residues are indicated by asterisks. The potential transmembrane ...
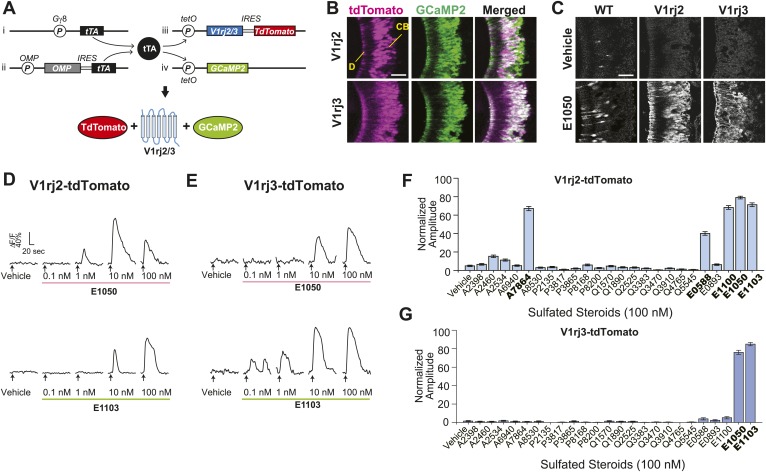
Figure 3.
V1rj receptors selectively respond to sulfated estrogens.
( A ) Schematic illustration of transgenic alleles that induce ectopic V1rj2- or V1rj3-expression in the VNO: (i) Gu03b38-tTA allele drives tTA expression in immature VSNs; (ii) Knock-in OMP-IRES-tTA ...
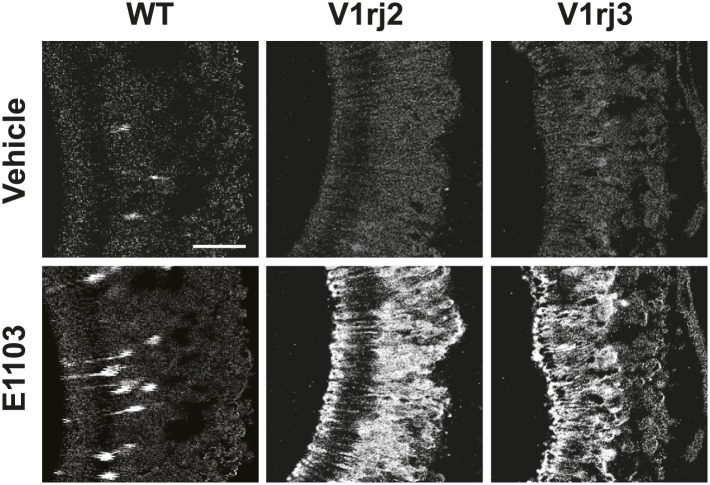
Figure 3u2014figure supplement 1.
E1103 activates V1rj2/3-expressing VSNs.
Representative images of GCaMP2 VNO slices from the control (left), V1rj2-tdTomato-expressing (middle) and V1rj3-tdTomato-expressing (right) mice responding to vehicle (top) or 100 nM E1103 (bottom). ...
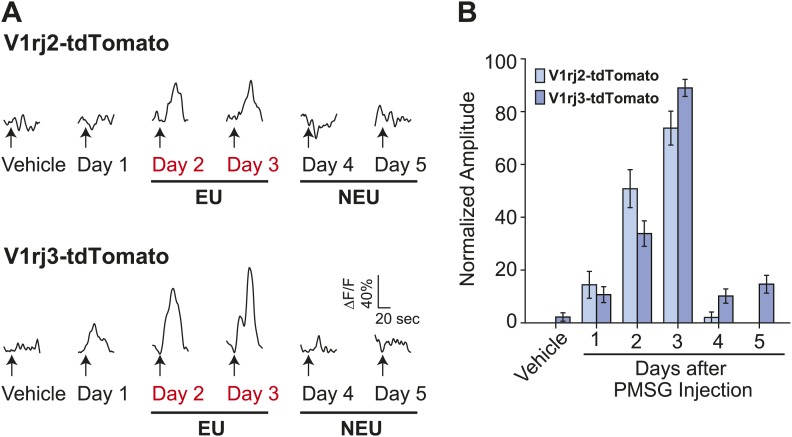
Figure 4.
V1rj receptors selectively respond to estrus urinary cues.
( A ) Traces showing GCaMP2 responses of a representative V1rj2-tdTomato-expressing cell (top) and a V1rj3-tdTomato-expressing cell (bottom) to urine samples collected from females 1 to 5 days after P...
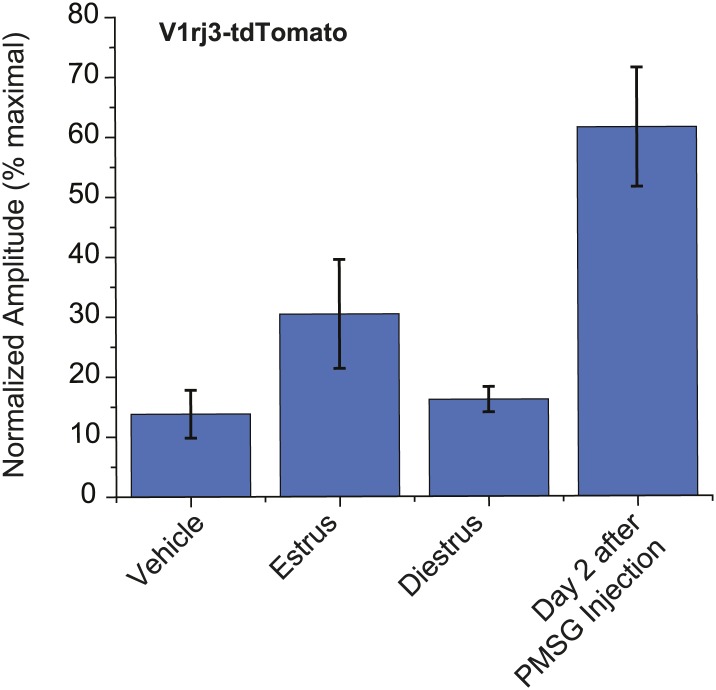
Figure 4u2014figure supplement 1.
Urine from estrous females in natural estrus cycle activates V1rj3-expressing VSNs.
Bar graph showing normalized response amplitude of V1j3-expressing VSNs to urine from estrous and diestrous females in the natural estrus cycle. Error bars, SEM. DOI: http://dx.doi.org/10.7554/eLife.0...
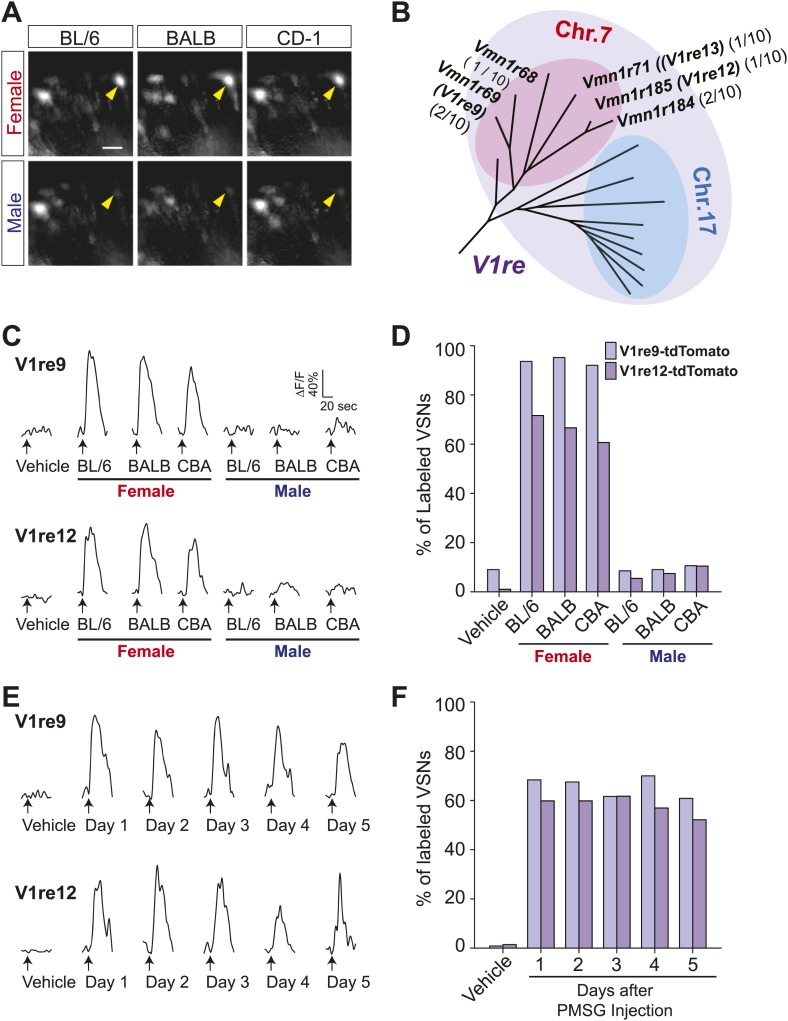
Figure 5.
V1re-Chr.7 group receptors recognize female-specific gender signals.
( A ) Representative images of VSNs responding to urine samples from either females (top) or males (bottom) of different mouse strains. White arrow-heads indicate a Female Urine Specific Cell (FUSC). ...
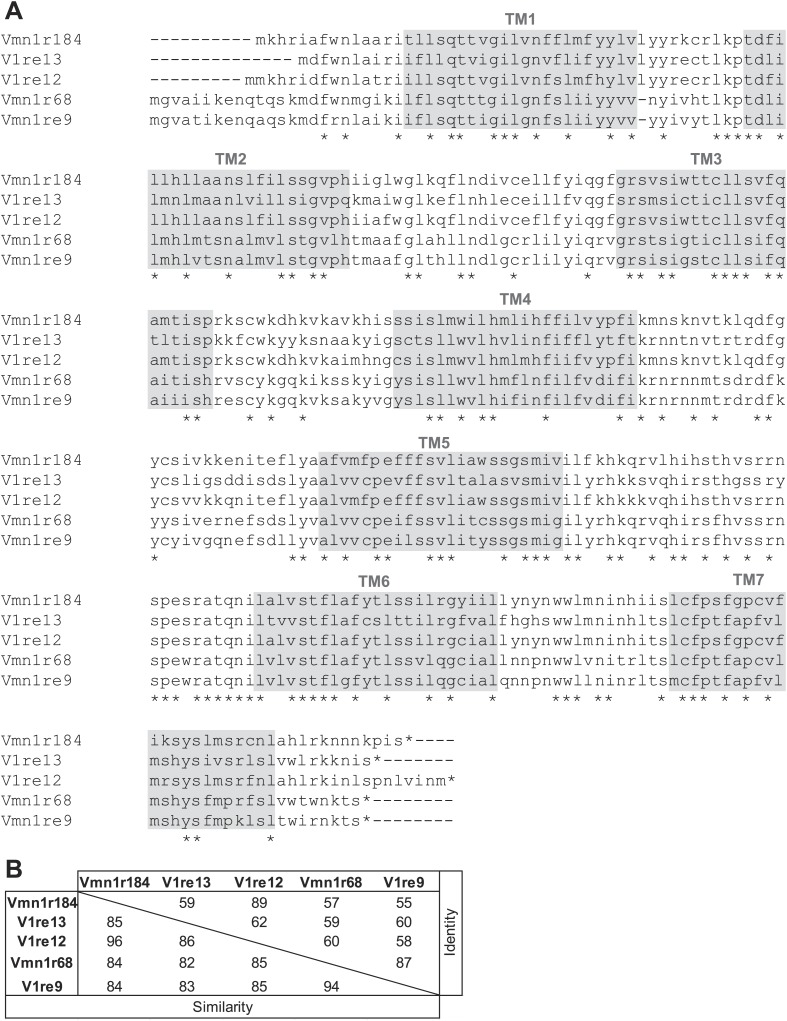
Figure 5u2014figure supplement 1.
Members of V1re-Chr.7 group receptors are homologous to each other.
( A ) Alignment of amino acid sequences of the members of V1re-Chr.7 group receptors found in FUSCs. Identical residues are indicated by asterisks. The potential transmembrane (TM) domains are highlig...
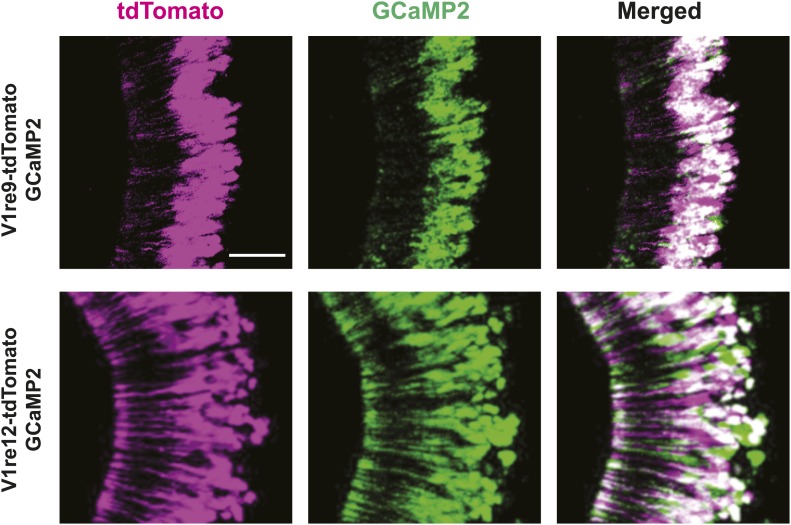
Figure 5u2014figure supplement 2.
V1re9/12-expressing VSNs express GCaMP2.
Representative images of VNO of Gu03b38-tTA;OIVT;tetO-V1re9-tdTomato;tetO-GCaMP2 (top) and Gu03b38-tTA;OIVT;tetO-V1re12-tdTomato;tetO-GCaMP2 (bottom) mice. Scale bar, 50 u03bcm. DOI: http://dx.doi.org...
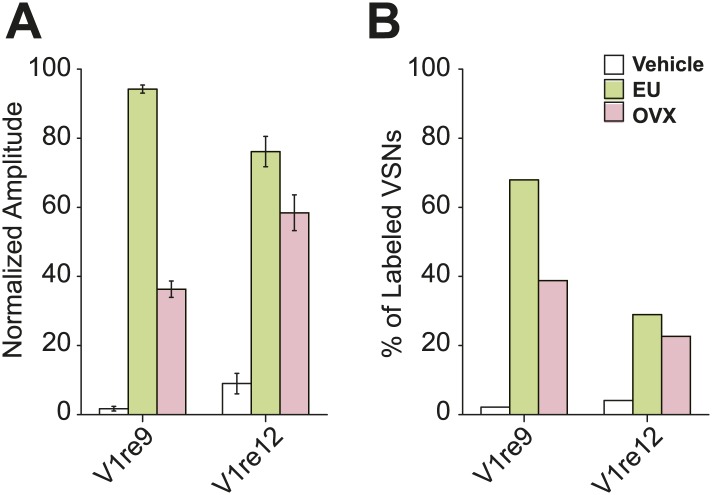
Figure 5u2014figure supplement 3.
Urine sample from ovariectomized females activates V1re9/e12-expressing cells.
( A ) Bar graph showing normalized response amplitude of V1e9 (n = 133) or V1re12 (n = 137) VSNs labeled by both GCaMP2 and tdTomato to urine from estrus (EU) and ovariectomized (OVX) females. ( B ) B...
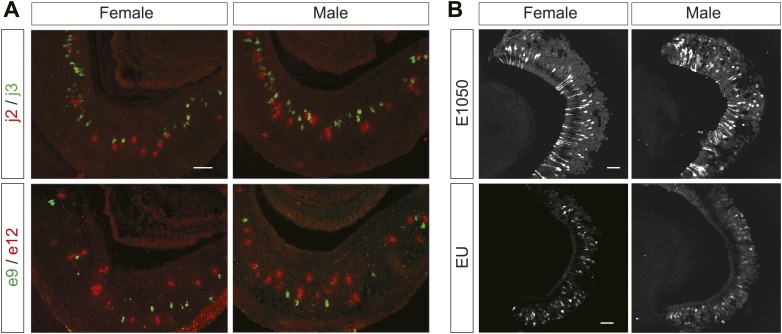
Figure 6.
The female cues are detected in male and female VNOs.
( A ) Double in situ hybridization of VNO slices. Top row: confocal images showing cells expressing V1rj2 (red) and V1rj3 (green) in VNO sections obtained from female (left) and male (right) mice. Bot...
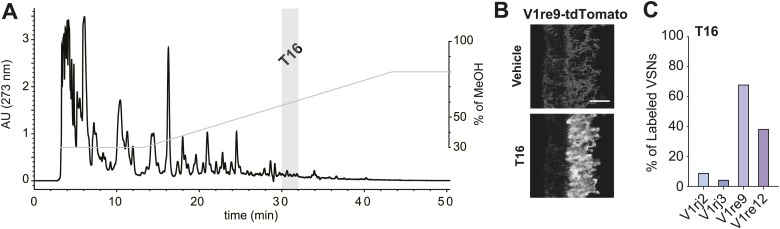
Figure 7.
T16 fraction contains the female-specific gender cue.
( A ) Chromatogram of HPLC purification using a C18 column. The light gray bar indicates the T16 fraction that activates the V1re9 and V1re12 receptors. ( B ) A representative image of GCaMP2 VNO slic...

Figure 7u2014figure supplement 1.
Acetone fraction from XAD4 resins retains VNO-stimulatory activity.
Representative images of a GCaMP2 VNO slice in response to vehicle ( A ), estrus urine (EU; B ), flow-through ( C ), water ( D ) and acetone ( E ) fractions. Scale bar, 50 u03bcm. DOI: http://dx.doi.o...
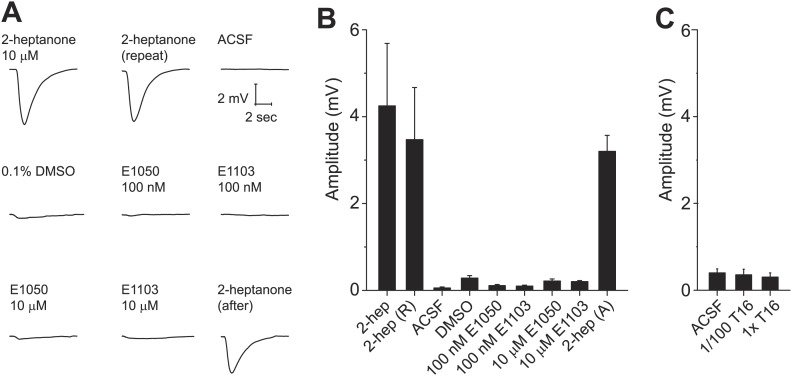
Figure 8.
Sulfated estrogens and T16 fraction do not activate the main olfactory system.
( A ) Traces showing EOG responses to 2-heptanone, E1050 and E1103. ( B and C ) Bar graphs showing the mean amplitude of EOG responses to 2-heptanone, E1050 and E1103 ( B ) and the T16 fraction ( C )....
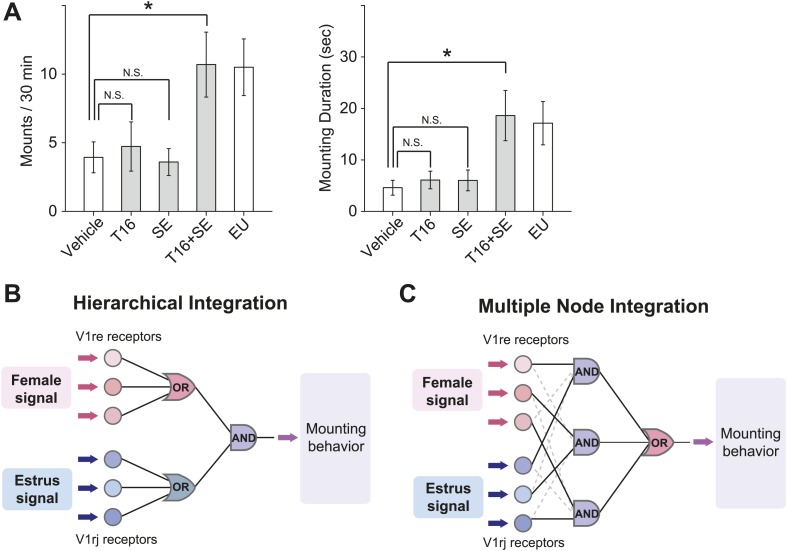
Figure 9.
Combined female and estrus cues are sufficient to promote mounting behavior.
( A ) The number (left), duration (middle) and latency (right) of mounting behavior of nau00efve males toward females painted with vehicle, T16 (n = 13), SE (n = 10), T16+SE (n = 13) or EU samples. Th...
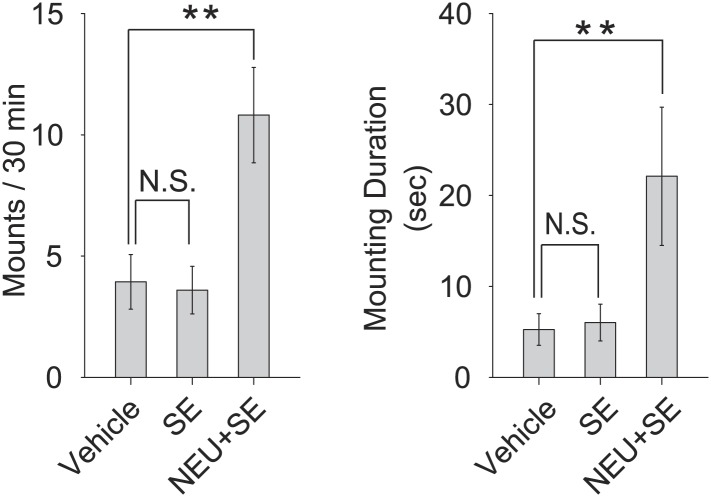
Figure 9u2014figure supplement 1.
Sulfated estrogens promote courtship in conjunction with NEU.
The number (left panel), duration (middle panel) and latency (right panel) of mounting behavior of sexually nau00efve males toward the females painted with either vehicle, SE or non-estrus urine (NEU)...
Figure images are served from the NIH/NLM PubMed Central Open Access Subset or Europe PMC; copyright remains with the publishers and authors.
💬 Discussion
0 commentsNo comments yet. Be the first to start a discussion!
Leave a Comment