Abstract
OBJECTIVE The ATP-binding cassette transporter A1 (ABCA1) is essential for normal insulin secretion from β-cells. The aim of this study was to elucidate the mechanisms underlying the impaired insulin secretion in islets lacking β-cell ABCA1. RESEARCH DESIGN AND METHODS Calcium imaging, patch clamp, and membrane capacitance were used to assess the effect of ABCA1 deficiency on calcium flux, ion channel function, and exocytosis in islet cells. Electron microscopy was used to analyze β-cell ultrastructure. The quantity and distribution of proteins involved in insulin-granule exocytosis were also investigated. RESULTS We show that a lack of β-cell ABCA1 results in impaired depolarization-induced exocytotic fusion of insulin granules. We observed disturbances in membrane microdomain organization and Golgi and insulin granule morphology in β-cells as well as elevated fasting plasma proinsulin levels in mice in the absence of β-cell ABCA1. Acute cholesterol depletion rescued the exocytotic defect in β-cells lacking ABCA1, indicating that elevated islet cholesterol accumulation directly impairs granule fusion and insulin secretion. CONCLUSIONS Our data highlight a crucial role of ABCA1 and cellular cholesterol in β-cells that is necessary for regulated insulin granule fusion events. These data suggest that abnormalities of cholesterol metabolism may contribute to the impaired β-cell function in diabetes.
🔬 Techniques
✨ Fluorophores
🧪 Sample Preparation
🏭 Microscope Brands
🧪 Reagent Suppliers
💻 Software Details
🏛️ Research Organizations (ROR)
Affiliated research institutions:
📋 Methods
RESEARCH DESIGN AND METHODS
Calcium imaging, patch clamp, and membrane capacitance were used to assess the effect of ABCA1 deficiency on calcium flux, ion channel function, and exocytosis in islet cells. Electron microscopy was used to analyze β-cell ultrastructure. The quantity and distribution of proteins involved in insulin-granule exocytosis were also investigated.
RESEARCH DESIGN AND METHODS Animals. ABCA1 β-cell–specific knockout and control ABCA1 floxed mice have been described previously ( 5 ). Mice were bred to a pure C57Bl6 background as described previously ( 12 ). All studies were approved by the University of British Columbia Animal Care Committee. Physiologic and metabolic studies. Intraperitoneal glucose tolerance tests, islet isolation, glucose-stimulated insulin secretion, and islet cholesterol measurements were performed as described previously ( 5 , 6 ). Plasma proinsulin levels were measured using the rat/mouse proinsulin ELISA kit (Mercodia, Uppsala, Sweden) ( 13 ). For cholesterol efflux measurements, islets were loaded with 1 μCi/mL [ 3 H]cholesterol overnight. Islets were then washed and incubated in RPMI 1640 medium containing 0.1% BSA, with or without 10 μg/mL human apolipoprotein A-I (apoA-I) (Athens Research and Technology, Athens, GA), for 4 h. Medium was collected, and cells were lysed in 0.1 N NaOH/0.1% SDS. Radioactivity in samples was measured by scintillation counting. Cholesterol efflux is expressed as a percentage of counts in medium over total (medium plus islets) counts. Ca 2+ imaging. Islets were dispersed and imaged as described previously ( 14 ). Cytosolic Ca 2+ was imaged in Fura-2-acetoxymethyl–loaded cells. Area under the curve was measured over the first 10 min of 10 mmol/L glucose, the first 5 min of 100 μmol/L tolbutamide, and the first 5 min of 30 mmol/L KCl perfusion. Cells that failed to raise the 340:380 ratio 2 SDs above the baseline within 5 min after treatment with 10 mmol/L glucose were excluded from the analysis. Electrophysiology. Ca 2+ current recordings were made in the whole-cell configuration of the patch-clamp technique from isolated β-cells. Recordings were digitized at 20 KHz and filtered at 5 KHz using the Axopatch200B patch-clamp amplifier and Clampex 8.0 (Molecular Devices Corp., Union City, CA). Bath perfusate contained (in mmol/L): NaCl, 95; CsCl, 5; MgCl 2 , 0.6; BaCl 2 , 20; HEPES, 5; glucose, 10; tetraethylammonium-Cl, 20; and 0.0005 tetrodotoxin (pH adjusted to 7.4 with NaOH, 21–24°C). Patch pipettes were pulled from borosilicate glass (GB150-86-15; Sutter Instrument Co., Novato, CA) to yield resistances between 1.7 and 2.0 MΩ when backfilled with buffer solution. Pipette tips were filled with a buffer solution containing (in mmol/L): CsCl, 120; tetraethylammonium-Cl, 20; MgCl 2 , 2; EGTA, 10; HEPES, 10; and ATP, 2 (pH adjusted to 7.2 with CsOH). Cells were voltage-clamped at −80 mV, and whole-cell capacitance was determined from analog compensation. Series resistance compensation of 80–90% was applied. To evoke total whole-cell Ca 2+ currents, cells were hyperpolarized to −90 mV (200-ms duration) and then depolarized to 10 mV (250-ms duration). Leak subtraction was applied using a p/5 protocol. K + current recordings were performed with an EPC10 patch-clamp amplifier controlled with PatchMaster software (HEKA Electronik, Lambrecht, Germany) as described previously ( 15 ). Data were analyzed using FitMaster (HEKA Electronik) and SigmaPlot 10 software (Systat Software, Inc., Point Richmond, CA). Capacitance measurements were performed as described previously ( 16 ). Whole-cell capacitance responses were normalized to initial cell size and expressed as femtofarad per picofarad. FM1-43 imaging. Islet cells were dispersed and plated on glass coverslips. Cells were loaded with 8 µmol/L FM1-43 in voltage-dependent K + (K v ) bath solution (as described above) for 10 min at 37°C. Cells were then imaged on an upright epifluorescence microscope (Olympus Canada, Inc., Markham, ON, Canada) at original magnification ×10. Fluorescence emission was measured at 520 nm after excitation at 480 nm at a rate of 0.33 frames/min. Cells were bathed in K v bath solution at 37°C, and 1 mol/L KCl was added to adjust the final concentration of KCl to 25 mmol/L as indicated. Electron microscopy. Islets were cultured in Hams’ F-10 medium containing 10% (v/v) FBS and 6 mmol/L d -glucose and high-pressure frozen, freeze substituted, processed, and plastic embedded, essentially as described previously ( 17 ). Ribbons of thin (40–60-nm) sections were cut on a microtome for survey at 80–100 keV to assess the quality of islet freeze preservation on Tecnai T12 (FEI Company, Hillsboro, OR) or JEOL 1011 (JEOL Australia, Frenchs Forest, NSW, Australia) microscopes. Stereology. Sample grids were viewed on the electron microscope at appropriate magnification and digital images captured at random to ensure an unbiased analysis/quantification. After capturing or freezing each image (or in live mode), an appropriate imaging grid (e.g., 1,000 × 1,000 nm) stored as a macro program in the camera/image analysis software was overlaid onto the image field. Points at which the grid lines intersected were counted for the cytoplasm versus other organelles compartments such as mitochondria, digestive/autophagic structures, and mature insulin granules. The relative volume of a given compartment in the cell was calculated by measuring the ratio of points over the compartment of interest/points over the cytoplasm, expressed as a percentage of cytoplasmic volume occupied by that compartment. Lipid raft isolation and Western blotting. MIN6 cells were lysed in 170 µL ice-cold 2-( N -morpholino)ethanesulfonic acid (Mes)-buffered saline (25 mmol/L Mes, 150 mmol/L NaCl, pH 6.5) containing 0.25% Triton X-100 and protease inhibitor mix and incubated at 4°C for 30 min. The lysate was homogenized with 20 strokes of a Dounce homogenizer. Equal amounts of protein in 150 µL were added to an equal volume of 80% (w/v) sucrose and overlayed with 300 µL of 30% sucrose and 225 µL of 5% sucrose. After centrifugation at 54,000 rpm in a Beckman TLS-55 rotor (Beckman Coulter, Inc., Fullerton, CA) for 20 h, 70-μL fractions were collected from the top of the gradient and designated fractions number 1 (top) through 11 (bottom). For epidermal growth factor (EGF) signaling, islets were incubated in RPMI 1640 medium with 0.5% BSA overnight, stimulated with 50 ng/mL EGF for 20 min, and lysed in SDP + buffer (50 mM Tris pH 8.0, 150 mM NaCl, 1% Igepal, 40 mM B-glycerophosphate, 10 mM NaF, 1× Roche complete protease inhibitor, 1 mM sodium orthovanadate, and 800 μM PMSF) after washing. Equivalent amounts of total protein (30 μg) or equal volumes (lipid rafts) were immunoblotted as previously described ( 6 ) using antibodies to flotillin (BD Transduction Laboratories, Mississauga, ON, Canada), synaptosomal-associated protein-25 (Covance, Princeton, NJ), transferrin receptor (Invitrogen, Burlington, ON, Canada), AKT and pAKT (Ser-473; Cell Signaling, Beverly, MA), vesicle-associated membrane protein 2 (VAMP-2), syntaxin-4, syntaxin-1, and actin (Abcam, Cambridge, MA). Protein bands were analyzed by densitometry using Quantity One (Bio-Rad, Hercules, CA) or ImageJ software (National Institutes of Health, Bethesda, MD). Statistical analysis. Data are presented as means ± SE. Differences between groups were calculated by the Student t test for two groups or one-way ANOVA with the Newman-Keuls post-test for three groups, with P = 0.05 considered significant.
Show full methods section
RESEARCH DESIGN AND METHODS
Calcium imaging, patch clamp, and membrane capacitance were used to assess the effect of ABCA1 deficiency on calcium flux, ion channel function, and exocytosis in islet cells. Electron microscopy was used to analyze β-cell ultrastructure. The quantity and distribution of proteins involved in insulin-granule exocytosis were also investigated.
RESEARCH DESIGN AND METHODS Animals. ABCA1 β-cell–specific knockout and control ABCA1 floxed mice have been described previously ( 5 ). Mice were bred to a pure C57Bl6 background as described previously ( 12 ). All studies were approved by the University of British Columbia Animal Care Committee. Physiologic and metabolic studies. Intraperitoneal glucose tolerance tests, islet isolation, glucose-stimulated insulin secretion, and islet cholesterol measurements were performed as described previously ( 5 , 6 ). Plasma proinsulin levels were measured using the rat/mouse proinsulin ELISA kit (Mercodia, Uppsala, Sweden) ( 13 ). For cholesterol efflux measurements, islets were loaded with 1 μCi/mL [ 3 H]cholesterol overnight. Islets were then washed and incubated in RPMI 1640 medium containing 0.1% BSA, with or without 10 μg/mL human apolipoprotein A-I (apoA-I) (Athens Research and Technology, Athens, GA), for 4 h. Medium was collected, and cells were lysed in 0.1 N NaOH/0.1% SDS. Radioactivity in samples was measured by scintillation counting. Cholesterol efflux is expressed as a percentage of counts in medium over total (medium plus islets) counts. Ca 2+ imaging. Islets were dispersed and imaged as described previously ( 14 ). Cytosolic Ca 2+ was imaged in Fura-2-acetoxymethyl–loaded cells. Area under the curve was measured over the first 10 min of 10 mmol/L glucose, the first 5 min of 100 μmol/L tolbutamide, and the first 5 min of 30 mmol/L KCl perfusion. Cells that failed to raise the 340:380 ratio 2 SDs above the baseline within 5 min after treatment with 10 mmol/L glucose were excluded from the analysis. Electrophysiology. Ca 2+ current recordings were made in the whole-cell configuration of the patch-clamp technique from isolated β-cells. Recordings were digitized at 20 KHz and filtered at 5 KHz using the Axopatch200B patch-clamp amplifier and Clampex 8.0 (Molecular Devices Corp., Union City, CA). Bath perfusate contained (in mmol/L): NaCl, 95; CsCl, 5; MgCl 2 , 0.6; BaCl 2 , 20; HEPES, 5; glucose, 10; tetraethylammonium-Cl, 20; and 0.0005 tetrodotoxin (pH adjusted to 7.4 with NaOH, 21–24°C). Patch pipettes were pulled from borosilicate glass (GB150-86-15; Sutter Instrument Co., Novato, CA) to yield resistances between 1.7 and 2.0 MΩ when backfilled with buffer solution. Pipette tips were filled with a buffer solution containing (in mmol/L): CsCl, 120; tetraethylammonium-Cl, 20; MgCl 2 , 2; EGTA, 10; HEPES, 10; and ATP, 2 (pH adjusted to 7.2 with CsOH). Cells were voltage-clamped at −80 mV, and whole-cell capacitance was determined from analog compensation. Series resistance compensation of 80–90% was applied. To evoke total whole-cell Ca 2+ currents, cells were hyperpolarized to −90 mV (200-ms duration) and then depolarized to 10 mV (250-ms duration). Leak subtraction was applied using a p/5 protocol. K + current recordings were performed with an EPC10 patch-clamp amplifier controlled with PatchMaster software (HEKA Electronik, Lambrecht, Germany) as described previously ( 15 ). Data were analyzed using FitMaster (HEKA Electronik) and SigmaPlot 10 software (Systat Software, Inc., Point Richmond, CA). Capacitance measurements were performed as described previously ( 16 ). Whole-cell capacitance responses were normalized to initial cell size and expressed as femtofarad per picofarad. FM1-43 imaging. Islet cells were dispersed and plated on glass coverslips. Cells were loaded with 8 µmol/L FM1-43 in voltage-dependent K + (K v ) bath solution (as described above) for 10 min at 37°C. Cells were then imaged on an upright epifluorescence microscope (Olympus Canada, Inc., Markham, ON, Canada) at original magnification ×10. Fluorescence emission was measured at 520 nm after excitation at 480 nm at a rate of 0.33 frames/min. Cells were bathed in K v bath solution at 37°C, and 1 mol/L KCl was added to adjust the final concentration of KCl to 25 mmol/L as indicated. Electron microscopy. Islets were cultured in Hams’ F-10 medium containing 10% (v/v) FBS and 6 mmol/L d -glucose and high-pressure frozen, freeze substituted, processed, and plastic embedded, essentially as described previously ( 17 ). Ribbons of thin (40–60-nm) sections were cut on a microtome for survey at 80–100 keV to assess the quality of islet freeze preservation on Tecnai T12 (FEI Company, Hillsboro, OR) or JEOL 1011 (JEOL Australia, Frenchs Forest, NSW, Australia) microscopes. Stereology. Sample grids were viewed on the electron microscope at appropriate magnification and digital images captured at random to ensure an unbiased analysis/quantification. After capturing or freezing each image (or in live mode), an appropriate imaging grid (e.g., 1,000 × 1,000 nm) stored as a macro program in the camera/image analysis software was overlaid onto the image field. Points at which the grid lines intersected were counted for the cytoplasm versus other organelles compartments such as mitochondria, digestive/autophagic structures, and mature insulin granules. The relative volume of a given compartment in the cell was calculated by measuring the ratio of points over the compartment of interest/points over the cytoplasm, expressed as a percentage of cytoplasmic volume occupied by that compartment. Lipid raft isolation and Western blotting. MIN6 cells were lysed in 170 µL ice-cold 2-( N -morpholino)ethanesulfonic acid (Mes)-buffered saline (25 mmol/L Mes, 150 mmol/L NaCl, pH 6.5) containing 0.25% Triton X-100 and protease inhibitor mix and incubated at 4°C for 30 min. The lysate was homogenized with 20 strokes of a Dounce homogenizer. Equal amounts of protein in 150 µL were added to an equal volume of 80% (w/v) sucrose and overlayed with 300 µL of 30% sucrose and 225 µL of 5% sucrose. After centrifugation at 54,000 rpm in a Beckman TLS-55 rotor (Beckman Coulter, Inc., Fullerton, CA) for 20 h, 70-μL fractions were collected from the top of the gradient and designated fractions number 1 (top) through 11 (bottom). For epidermal growth factor (EGF) signaling, islets were incubated in RPMI 1640 medium with 0.5% BSA overnight, stimulated with 50 ng/mL EGF for 20 min, and lysed in SDP + buffer (50 mM Tris pH 8.0, 150 mM NaCl, 1% Igepal, 40 mM B-glycerophosphate, 10 mM NaF, 1× Roche complete protease inhibitor, 1 mM sodium orthovanadate, and 800 μM PMSF) after washing. Equivalent amounts of total protein (30 μg) or equal volumes (lipid rafts) were immunoblotted as previously described ( 6 ) using antibodies to flotillin (BD Transduction Laboratories, Mississauga, ON, Canada), synaptosomal-associated protein-25 (Covance, Princeton, NJ), transferrin receptor (Invitrogen, Burlington, ON, Canada), AKT and pAKT (Ser-473; Cell Signaling, Beverly, MA), vesicle-associated membrane protein 2 (VAMP-2), syntaxin-4, syntaxin-1, and actin (Abcam, Cambridge, MA). Protein bands were analyzed by densitometry using Quantity One (Bio-Rad, Hercules, CA) or ImageJ software (National Institutes of Health, Bethesda, MD). Statistical analysis. Data are presented as means ± SE. Differences between groups were calculated by the Student t test for two groups or one-way ANOVA with the Newman-Keuls post-test for three groups, with P = 0.05 considered significant.
📊 Figures
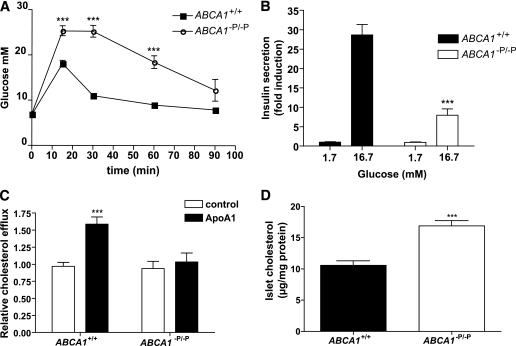
FIG. 1.
Mice lacking u03b2-cell ABCA1 show impaired glucose tolerance, impaired insulin secretion, impaired islet cholesterol efflux, and increased islet cholesterol levels. A : Plasma glucose levels during g...
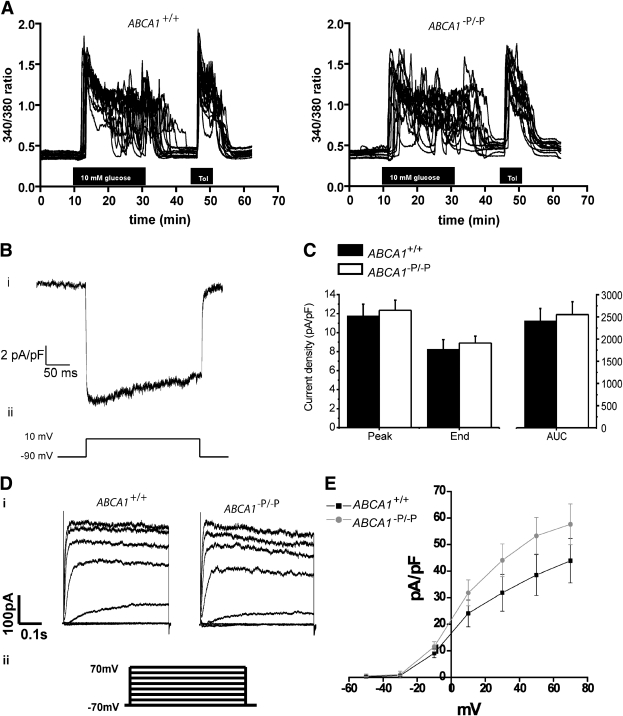
FIG. 2.
Ca 2+ influx and ion channel activity unaltered in u03b2-cells lacking ABCA1 . A : Influence of 10 mmol/L glucose and 100 u03bcmol/L tolbutamide (Tol) on [Ca 2+ ] i . [Ca 2+ ] i was monitored as the 3...
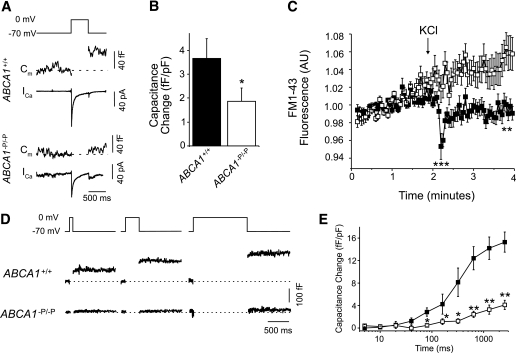
FIG. 3.
Depolarization-induced exocytosis is impaired in u03b2-cells lacking ABCA1 . A : u03b2-Cell membrane capacitance (C m ) and voltage-dependent Ca 2+ currents (I Ca ) in response to a single 500-ms depo...
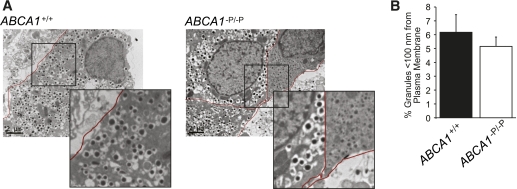
FIG. 4.
u03b2-Cells lacking ABCA1 show similar number of docked granules. A : Representative electron micrographs. Insert shows docked granules at the plasma membrane in more detail. B : The percentage of sec...
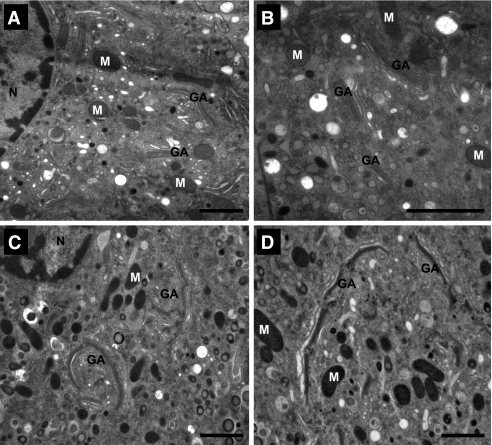
FIG. 5.
Major alterations to Golgi organization in ABCA1 u2212P/u2212P u03b2-cells. The Golgi region in u03b2-cells from control mice ( A and B ) reflected the hallmark architecture of Golgi membranes organiz...
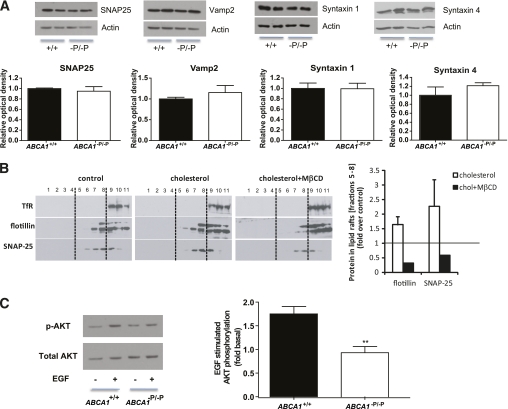
FIG. 6.
Cholesterol accumulation alters membrane microdomain organization and impairs SNARE protein localization. A : SNAP-25, VAMP-2, syntaxin-1, and syntaxin-4 protein levels in isolated islets. Graphs repr...
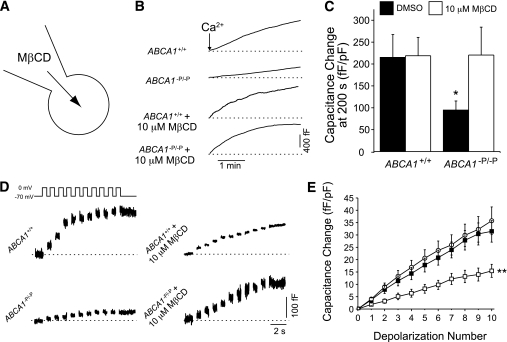
FIG. 7.
The exocytotic defect in ABCA1 u2212P/u2212P u03b2-cells is rescued by acute intracellular cholesterol depletion. A : Whole-cell membrane capacitance from u03b2-cells after intracellular dialysis with...
Figure images are served from the NIH/NLM PubMed Central Open Access Subset or Europe PMC; copyright remains with the publishers and authors.
💬 Discussion
0 commentsNo comments yet. Be the first to start a discussion!
Leave a Comment