Abstract
AbstractThe liquid and glass states of metal–organic frameworks (MOFs) have recently become of interest due to the potential for liquid-phase separations and ion transport, alongside the fundamental nature of the latter as a new, fourth category of melt-quenched glass. Here we show that the MOF liquid state can be blended with another MOF component, resulting in a domain structured MOF glass with a single, tailorable glass transition. Intra-domain connectivity and short range order is confirmed by nuclear magnetic resonance spectroscopy and pair distribution function measurements. The interfacial binding between MOF domains in the glass state is evidenced by electron tomography, and the relationship between domain size and Tg investigated. Nanoindentation experiments are also performed to place this new class of MOF materials into context with organic blends and inorganic alloys.
🔬 Techniques
💻 Software
🧪 Sample Preparation
🏭 Microscope Brands
🧪 Reagent Suppliers
💻 Software Details
💾 Data Repositories
🏛️ Research Organizations (ROR)
Affiliated research institutions:
📋 Methods
Synthesis
All crystalline samples studied here crystallize in the Pbca space group, with cell volumes of 4342 Å 3 , 4280 Å 3 and 4466 Å 3 for ZIF-4-Zn, ZIF-4-Co and ZIF-62, respectively. The preparation of mixed samples was done in 0.5 g quantities. For example, for a 50/50 ratio mixture, 0.25 g of each MOF was placed in a 10 ml stainless steel jar, along with 2 × 7 mm diameter stainless steel balls. The mixture was then milled for 5 min (or, to produce a finer particle size for one control sample, for 20 min) in a Retsch MM400 grinder mill operating at 25 Hz. Powder X-ray diffraction patterns of both ball-milled mixtures are shown in Supplementary Information, demonstrating the lack of amorphization. Differential scanning calorimetry DSC characterizations were conducted using a Netzsch STA 449 F1 instrument in platinum crucibles at a 10 °C min −1 heating rate. The simultaneous DSC–thermogravimetric analysis in Supplementary Figure 5 was performed using a TA instruments Q-600 series differential scanning calorimeter, with the sample (~7 mg) held on an aluminium pan under a continuous flow of dry Ar gas. The data were obtained using a heating rate of 10 °C min −1 . T g s were determined by the method described elsewhere 48 . X-ray powder diffraction Data were collected with a Bruker-AXS D8 diffractometer using Cu Kα ( λ = 1.540598 Å) radiation and a LynxEye position sensitive detector in Bragg–Brentano parafocussing geometry. Combined SAXS and WAXS X-ray data were collected at the I22 beamline at the Diamond Light Source, UK ( λ = 0.9998 Å, 12.401 keV). The SAXS detector was positioned at a distance of 9.23634 m from the sample as calibrated using a 100 nm period Si 3 N 4 grating (Silson, UK), giving a usable Q range of 0.0018–0.18 Å −1 . The WAXS detector was positioned at a distance of 0.16474 m from the sample as calibrated using a standard CeO 2 sample (NIST SRM 674b, Gaithersburg, USA), giving a usable Q range of 0.17–4.9 Å −1 . Samples were loaded into 1.5 mm diameter borosilicate capillaries under argon inside a glovebox and sealed with Blu-tac and Para-film to prevent the ingress of air. Samples were heated using a Linkam THMS600 capillary stage (Linkam Scientific, UK) from room temperature to 600 °C at 10 °C min −1 . Simultaneous SAXS/WAXS data were collected every 1 °C. Data were reduced to one dimensional using the DAWN package 49 , 50 and standard reduction pipelines 51 . Values for the power law behaviour of the samples were found using the power law model of SASView 4.1.1 52 . Data were fitted over the range 0.003 ≤ q ≤ 0.005 Å −1 . Particle size distributions were calculated using the McSAS package 53 , 54 , a minimal assumption Monte Carlo method for extracting size distributions from small-angle scattering data. Data were fitted over the range 0.002 ≤ q ≤ 0.18 Å −1 with a sphere model.
Show full methods section
Synthesis
All crystalline samples studied here crystallize in the Pbca space group, with cell volumes of 4342 Å 3 , 4280 Å 3 and 4466 Å 3 for ZIF-4-Zn, ZIF-4-Co and ZIF-62, respectively. The preparation of mixed samples was done in 0.5 g quantities. For example, for a 50/50 ratio mixture, 0.25 g of each MOF was placed in a 10 ml stainless steel jar, along with 2 × 7 mm diameter stainless steel balls. The mixture was then milled for 5 min (or, to produce a finer particle size for one control sample, for 20 min) in a Retsch MM400 grinder mill operating at 25 Hz. Powder X-ray diffraction patterns of both ball-milled mixtures are shown in Supplementary Information, demonstrating the lack of amorphization. Differential scanning calorimetry DSC characterizations were conducted using a Netzsch STA 449 F1 instrument in platinum crucibles at a 10 °C min −1 heating rate. The simultaneous DSC–thermogravimetric analysis in Supplementary Figure 5 was performed using a TA instruments Q-600 series differential scanning calorimeter, with the sample (~7 mg) held on an aluminium pan under a continuous flow of dry Ar gas. The data were obtained using a heating rate of 10 °C min −1 . T g s were determined by the method described elsewhere 48 . X-ray powder diffraction Data were collected with a Bruker-AXS D8 diffractometer using Cu Kα ( λ = 1.540598 Å) radiation and a LynxEye position sensitive detector in Bragg–Brentano parafocussing geometry. Combined SAXS and WAXS X-ray data were collected at the I22 beamline at the Diamond Light Source, UK ( λ = 0.9998 Å, 12.401 keV). The SAXS detector was positioned at a distance of 9.23634 m from the sample as calibrated using a 100 nm period Si 3 N 4 grating (Silson, UK), giving a usable Q range of 0.0018–0.18 Å −1 . The WAXS detector was positioned at a distance of 0.16474 m from the sample as calibrated using a standard CeO 2 sample (NIST SRM 674b, Gaithersburg, USA), giving a usable Q range of 0.17–4.9 Å −1 . Samples were loaded into 1.5 mm diameter borosilicate capillaries under argon inside a glovebox and sealed with Blu-tac and Para-film to prevent the ingress of air. Samples were heated using a Linkam THMS600 capillary stage (Linkam Scientific, UK) from room temperature to 600 °C at 10 °C min −1 . Simultaneous SAXS/WAXS data were collected every 1 °C. Data were reduced to one dimensional using the DAWN package 49 , 50 and standard reduction pipelines 51 . Values for the power law behaviour of the samples were found using the power law model of SASView 4.1.1 52 . Data were fitted over the range 0.003 ≤ q ≤ 0.005 Å −1 . Particle size distributions were calculated using the McSAS package 53 , 54 , a minimal assumption Monte Carlo method for extracting size distributions from small-angle scattering data. Data were fitted over the range 0.002 ≤ q ≤ 0.18 Å −1 with a sphere model.
NMR spectroscopy
NMR samples were prepared by digesting ~8 mg of sample in 100 μL of 35 wt% DCl in D 2 O (purchased from Sigma Aldrich, 99% deuterated) then dissolved in 500 μL of DMSO- d 6 (purchased from Sigma Aldrich, 99.9% deuterated). All 1 H NMR spectra were recorded on a Bruker Avance III 400 MHz spectrometer.
Total scattering measurements
X-ray data were collected at the I15-1 beamline at the Diamond Light Source, UK ( λ = 0.161669 Å, 76.7 keV). A sample of (ZIF-4-Co)(ZIF-62)(50/50), and a small amount of the (ZIF-4-Co) 0.5 (ZIF-62) 0.5 sample used in the neutron total scattering experiment were loaded into borosilicate glass capillaries of 1.17 mm (inner) diameter. Data on the samples, empty instrument and capillary were collected in the region of ∼0.4 < Q
📊 Figures
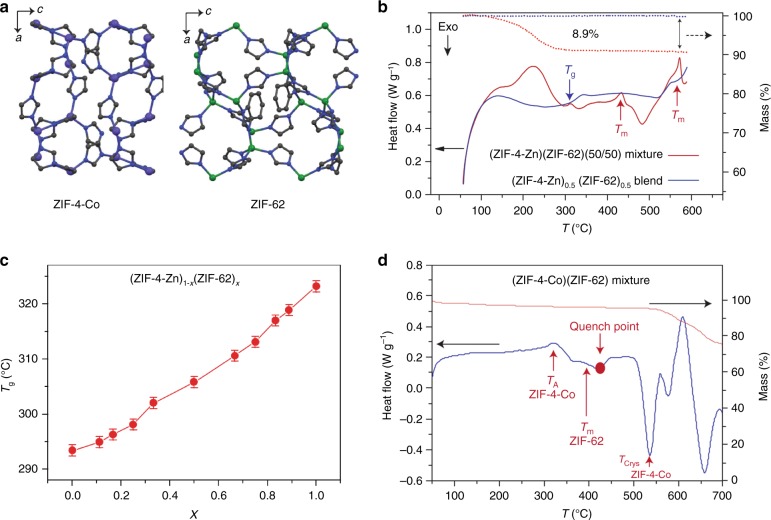
Fig. 1
MOF liquid dynamics and tailoring glass transition temperature. a View down the b axis of the unit cells of ZIF-4-Co and ZIF-62. Nu2014dark blue, Cu2014grey, Znu2014green, Cou2014purple, H atoms omitt...
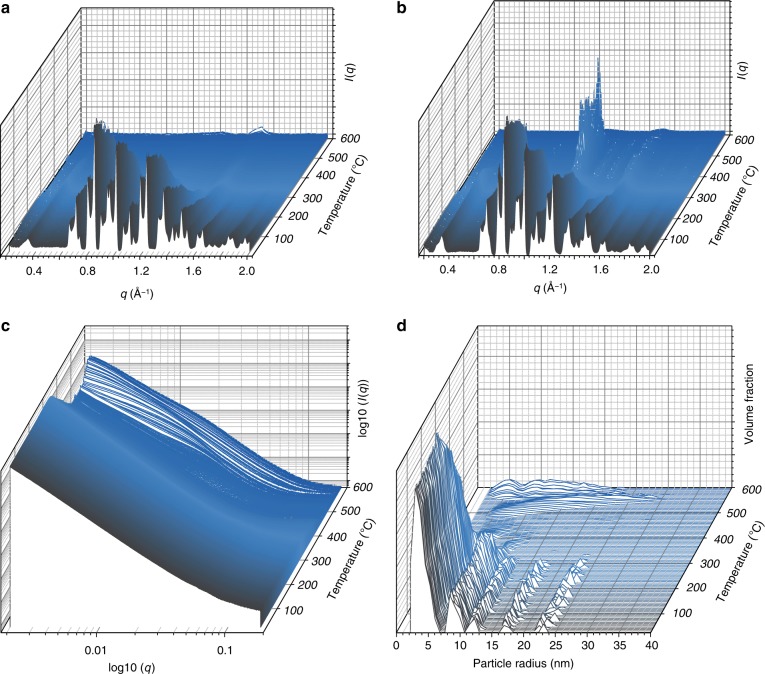
Fig. 2
Temperature-resolved diffraction. a Temperature-resolved WAXS profile of ZIF-62 upon heating from 25u2009u00b0C to 600u2009u00b0C. b The corresponding data for (ZIF-4-Co)(ZIF-62)(50/50). c Temperature...
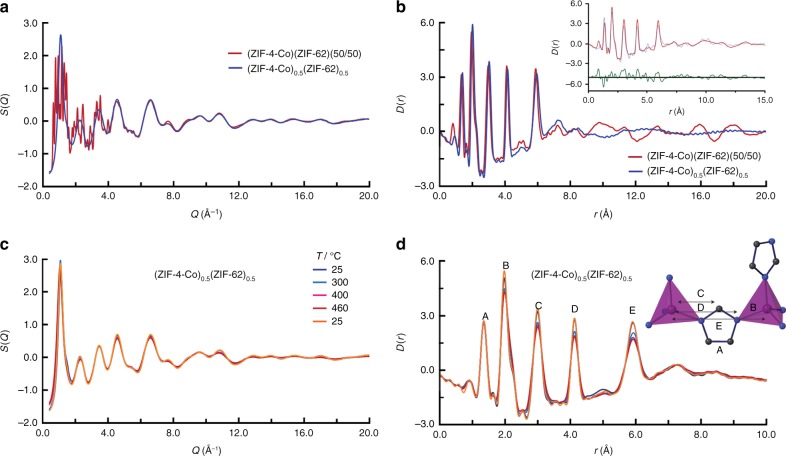
Fig. 3
Intra-domain structure. a X-ray structure factors S x ( Q ) of (ZIF-4-Co)(ZIF-62)(50/50) and (ZIF-4-Co) 0.5 (ZIF-62) 0.5 . b Corresponding X-ray pair distribution functions, D ( r ). Inset: refinement...
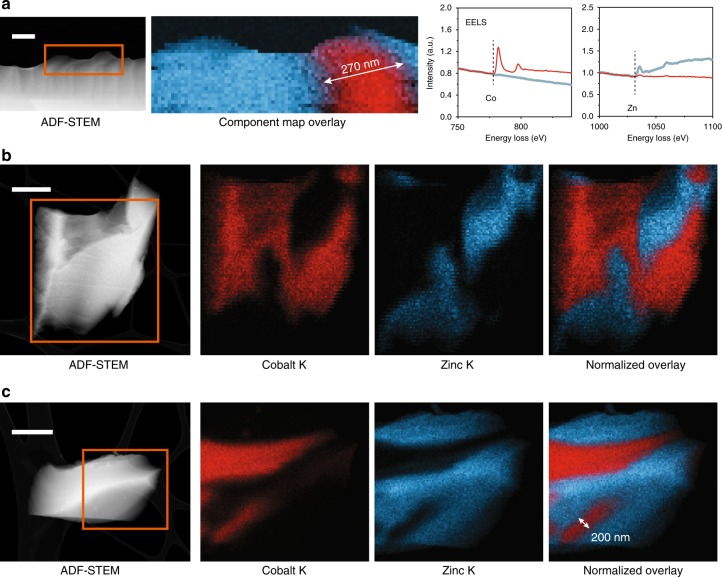
Fig. 4
Chemical mapping of domain structures in (ZIF-4-Co) 0.5 (ZIF-62) 0.5 . a ADF-STEM image and corresponding EELS analysis. Independent component analysis was carried out to separate Co and Zn signals an...
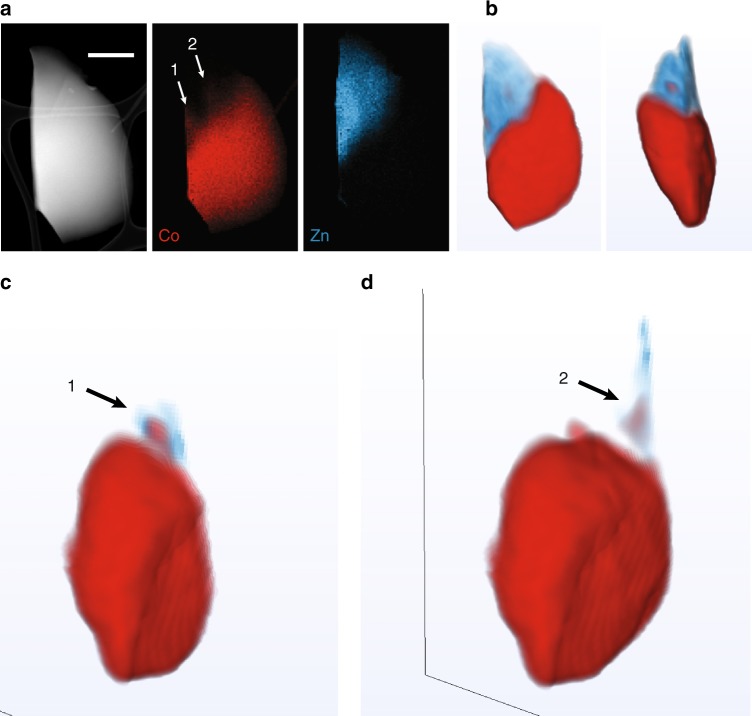
Fig. 5
EDS tomography of a (ZIF-4-Co) 0.5 (ZIF-62) 0.5 glass particle. a Two-dimensional analyses by ADF-STEM showing the particle morphology and EDS chemical maps of Co and Zn. Scale bar is 500u2009nm. b A ...
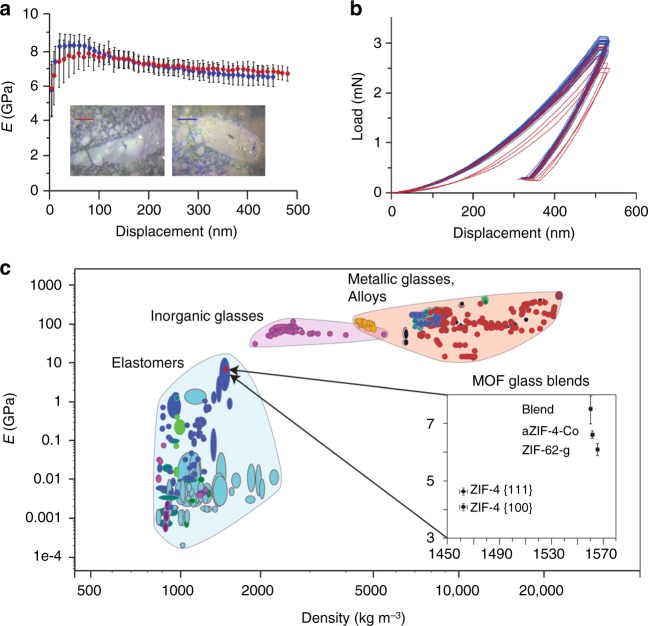
Fig. 6
Mechanical properties. a The Youngu2019s modulus, E , as a function of indentation depth for two samples of (ZIF-4-Co) 0.5 (ZIF-62) 0.5 . Error bars represent the standard deviation of 26 measurements...
Figure images are served from the NIH/NLM PubMed Central Open Access Subset or Europe PMC; copyright remains with the publishers and authors.
💬 Discussion
0 commentsNo comments yet. Be the first to start a discussion!
Leave a Comment