Abstract
Initiation and promoter-proximal pausing are key regulatory steps of RNA Polymerase II (Pol II) transcription. To study the in vivo dynamics of endogenous Pol II during these steps, we generated fully functional GFP-RPB1 knockin cells. GFP-RPB1 photobleaching combined with computational modeling revealed four kinetically distinct Pol II fractions and showed that on average 7% of Pol II are freely diffusing, while 10% are chromatin-bound for 2.4 seconds during initiation, and 23% are promoter-paused for only 42 seconds. This unexpectedly high turnover of Pol II at promoters is most likely caused by premature termination of initiating and promoter-paused Pol II and is in sharp contrast to the 23 minutes that elongating Pol II resides on chromatin. Our live-cell-imaging approach provides insights into Pol II dynamics and suggests that the continuous release and reinitiation of promoter-bound Pol II is an important component of transcriptional regulation.
🔬 Techniques
🔭 Microscopes
🧬 Organisms
💻 Software
✨ Fluorophores
🧪 Sample Preparation
🔬 Cell Lines
🏭 Microscope Brands
🧪 Reagent Suppliers
💻 Software Details
🏛️ Research Organizations (ROR)
Affiliated research institutions:
📋 Methods
Generation of GFP-RPB1 KI
Cells and Cell Culture. KI cells were generated from Sv40-immortalized MRC-5 fibroblasts, as described here ( 19 ). Detailed protocol can be found in SI Materials and Methods . Cells were cultured in a 1:1 mixture of Ham’s F-10 and DMEM (Gibco) supplemented with antibiotics and 10% FCS, at 37 °C; 20% O 2 , and 5% CO 2 in a humidified incubator. Immunofluorescence and EU Incorporation. Click it-based EU incorporation was performed as described previously ( 55 ). A detailed protocol is in SI Materials and Methods . Immunofluorescence was performed as described in SI Materials and Methods . Transcription inihibitors, antibodies, and respective concentrations are listed in Dataset S2 . Cellular Fractionation, Western Blot Analysis. The fractionation procedure was adapted from ref. 56 and is described in detail in SI Materials and Methods . Fractions were separated on a 6% SDS Page gel, blotted overnight at 40 V. Blots were blocked with 1.5% BSA in PBS and stained with primary antibodies listed in Dataset S2 . Secondary antibodies were coupled to IRDyes (LiCor) and imaged with an Odyssey CLx infrared scanner (LiCor). Live-Cell Confocal Microscopy and Quantification of Nuclear Pol II. Live-cell imaging was performed on a Leica SP5 confocal laser scanning microscope with a HCX PL APO CS 63×, 1.40-NA oil-immersion lens. Images were recorded with a 488-nm Argon laser and a 500- to 600-nm bandpass filter. For the detailed RPB1 FRAP procedure, please see SI Materials and Methods . For Pol II concentration measurements eGFP (Biovision) was dissolved in PBS, serially diluted in culture medium, and the fluorescence intensity was measured alongside nuclear GFP-RPB1 fluorescence. For a detailed procedure, see SI Materials and Methods . MC Modeling. Experimental FRAP curves were fit by least squares, to a large set of computer simulation-generated FRAP curves that were computed based on a model that simulates diffusion of molecules (here Pol II), and binding to and releasing from immobile elements, (here chromatin) in an ellipsoidal volume (here the nucleus). For details, see SI Materials and Methods . Detailed protocols for RNA-Seq data analysis, Chromatin immunoprecipitation, siRNA transfection, and RT-PCR can be found in SI Materials and Methods .
Show full methods section
Generation of GFP-RPB1 KI
Cells and Cell Culture. KI cells were generated from Sv40-immortalized MRC-5 fibroblasts, as described here ( 19 ). Detailed protocol can be found in SI Materials and Methods . Cells were cultured in a 1:1 mixture of Ham’s F-10 and DMEM (Gibco) supplemented with antibiotics and 10% FCS, at 37 °C; 20% O 2 , and 5% CO 2 in a humidified incubator. Immunofluorescence and EU Incorporation. Click it-based EU incorporation was performed as described previously ( 55 ). A detailed protocol is in SI Materials and Methods . Immunofluorescence was performed as described in SI Materials and Methods . Transcription inihibitors, antibodies, and respective concentrations are listed in Dataset S2 . Cellular Fractionation, Western Blot Analysis. The fractionation procedure was adapted from ref. 56 and is described in detail in SI Materials and Methods . Fractions were separated on a 6% SDS Page gel, blotted overnight at 40 V. Blots were blocked with 1.5% BSA in PBS and stained with primary antibodies listed in Dataset S2 . Secondary antibodies were coupled to IRDyes (LiCor) and imaged with an Odyssey CLx infrared scanner (LiCor). Live-Cell Confocal Microscopy and Quantification of Nuclear Pol II. Live-cell imaging was performed on a Leica SP5 confocal laser scanning microscope with a HCX PL APO CS 63×, 1.40-NA oil-immersion lens. Images were recorded with a 488-nm Argon laser and a 500- to 600-nm bandpass filter. For the detailed RPB1 FRAP procedure, please see SI Materials and Methods . For Pol II concentration measurements eGFP (Biovision) was dissolved in PBS, serially diluted in culture medium, and the fluorescence intensity was measured alongside nuclear GFP-RPB1 fluorescence. For a detailed procedure, see SI Materials and Methods . MC Modeling. Experimental FRAP curves were fit by least squares, to a large set of computer simulation-generated FRAP curves that were computed based on a model that simulates diffusion of molecules (here Pol II), and binding to and releasing from immobile elements, (here chromatin) in an ellipsoidal volume (here the nucleus). For details, see SI Materials and Methods . Detailed protocols for RNA-Seq data analysis, Chromatin immunoprecipitation, siRNA transfection, and RT-PCR can be found in SI Materials and Methods .
📊 Figures
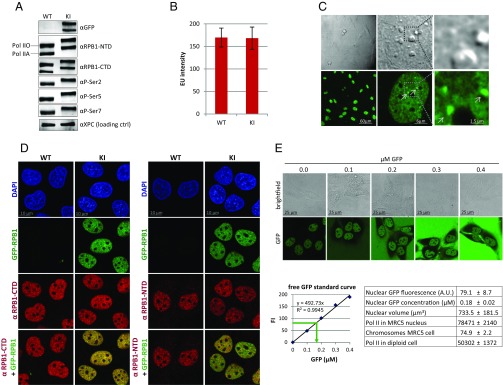
Fig. 1.
Characterization of GFP-RPB1 KI cells. ( A ) Western blot of MRC-5 WT and GFP-RPB1 KI cells. Pol IIA, hypophosphorylated Pol II; Pol IIO, hyperphosphorylated Pol II; P-Ser, phosphoserine. ( B ) EU inc...
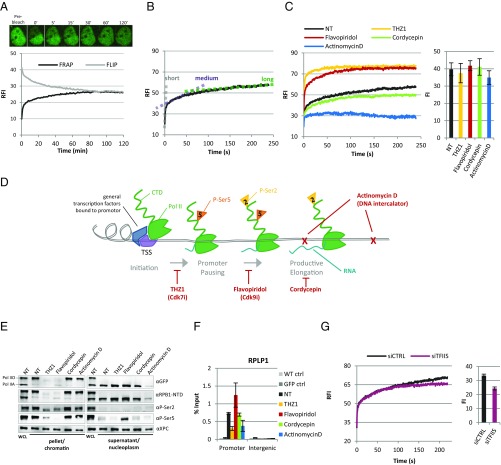
Fig. 2.
Real-time measurements of Pol II kinetics at different transcription cycle stages. ( A ) FRAP of the bleached and fluorescence loss in photobleaching (FLIP) of the nonbleached half of nuclei are plott...
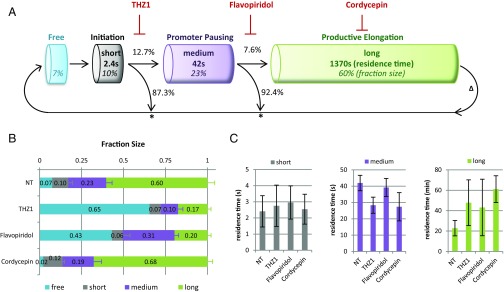
Fig. 3.
MC modeling of live cell Pol II kinetics. ( A ) Schematic representation of possible binding and release steps of Pol II to DNA. Modeled fraction sizes are depicted as percentages and written in itali...
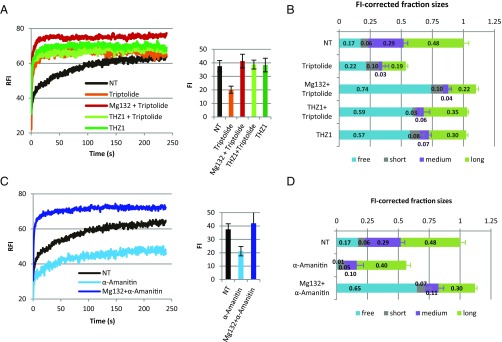
Fig. 4.
Live-cell Pol II kinetics after Triptolide and u03b1-Amanitin. FRAP of GFP-RPB1 in NT cells and cells treated with 0.5 u00b5M Triptolide for 1 h ( A ) or 100 u00b5g/mL u03b1-Amanitin for 2 h ( C ). Mg...
Figure images are served from the NIH/NLM PubMed Central Open Access Subset or Europe PMC; copyright remains with the publishers and authors.
💬 Discussion
0 commentsNo comments yet. Be the first to start a discussion!
Leave a Comment