Abstract
Abstract Mitochondria are highly dynamic organelles that exhibit a complex inner architecture. They exhibit a smooth outer membrane and a highly convoluted inner membrane that forms invaginations called cristae. Imaging cristae in living cells poses a formidable challenge for super-resolution light microscopy. Relying on a cell line stably expressing the mitochondrial protein COX8A fused to the SNAP-tag and using STED ( st imulated e mission d epletion) nanoscopy, we demonstrate the visualization of cristae dynamics in cultivated human cells. We show that in human HeLa cells lamellar cristae are often arranged in groups separated by voids that are generally occupied by mitochondrial nucleoids.
🔬 Techniques
💻 Software
✨ Fluorophores
🧪 Sample Preparation
🔬 Cell Lines
🏭 Microscope Brands
🧪 Reagent Suppliers
📷 Detectors
🔎 Objectives
💻 Software Details
💾 Data Repositories
🏷️ Research Resource Identifiers (RRIDs)
Verified research resources used in this paper:
🏛️ Research Organizations (ROR)
Affiliated research institutions:
📋 Methods
Cloning of plasmids
To generate the donor plasmid AAVS1-Blasticidin-CAG-COX8A-SNAP, the plasmid AAVS1-Basticidin-CAG-Flpe-ERT2 was first linearized by using the restriction endonucleases SalI and EcoRV. AAVS1-Blasticidin-CAG-Flpe-ERT2 was a gift from Su-Chun Zhang (Addgene plasmid #68461; http://n2t.net/addgene:68461 ; RRID:Addgene_68461). COX8A-SNAP was amplified by PCR from pSNAPf-COX8A (New England Biolabs, Ipswich, MA, USA) using the primers given below and subsequently integrated into the linearized plasmid by Gibson assembly. Primers for donor Plasmid: COX8A-fwd: TCTCATCATTTTGGCAAAGAATTCGTCGACGCCGCCACCATGTCCGTCCTGACGCCG COX8A-rev: GAGGTTGATTATCGATAAGCTTGATATCTTAATTAACCTCGAGTTTAAACGCGGATC The gRNA plasmid PX458-AAVS1 was derived from PX458. pSpCas9(BB)-2A-GFP (PX458) was a gift from Feng Zhang (Addgene plasmid #48138; http://n2t.net/addgene:48138 ; RRID:Addgene_48138). In brief, oligonucleotides were annealed by primer annealing and integrated into PX458 after linearization with the Bbs I restriction endonuclease. Oligonucleotides for gRNA plasmid: AAVS1-gRNA-fw: CACCGTGTCCCTAGTGGCCCCACTG AAVS1-gRNA-rev: AACCAGTGGGGCCACTAGGGACAC Cell culture HeLa cells were cultured in DMEM containing 4.5 g/L glucose and GlutaMAX™ additive (Thermo Fisher Scientific) supplemented with 100 U/mL penicillin and 100 µg/mL streptomycin (Merck Millipore, Burlington, MA, USA), 1 mM sodium pyruvate (Sigma Aldrich) and 10% (v/v) fetal bovine serum (Merck Millipore).
Generation of a stable cell line
To generate the stable cell line, HeLa cells were co-transfected with the plasmids AAVS1-Blasticidin-CAG-COX8A-SNAP and PX458-AAVS1 using the jetPRIME transfection reagent (Polyplus, Illkirch, France). Starting two days after transfection, the cells were selected using DMEM containing 10 µg/mL Blasticidin S (Invivogen, Toulouse, France) for 7 days. Two weeks after transfection, the cells were stained with DMEM containing 1 µM SNAP-Cell SiR (New England Biolabs, Ipswich, MA, USA) for about 10 minutes. After two washing steps with DMEM (15 min), the cells were detached.
Show full methods section
Cloning of plasmids
To generate the donor plasmid AAVS1-Blasticidin-CAG-COX8A-SNAP, the plasmid AAVS1-Basticidin-CAG-Flpe-ERT2 was first linearized by using the restriction endonucleases SalI and EcoRV. AAVS1-Blasticidin-CAG-Flpe-ERT2 was a gift from Su-Chun Zhang (Addgene plasmid #68461; http://n2t.net/addgene:68461 ; RRID:Addgene_68461). COX8A-SNAP was amplified by PCR from pSNAPf-COX8A (New England Biolabs, Ipswich, MA, USA) using the primers given below and subsequently integrated into the linearized plasmid by Gibson assembly. Primers for donor Plasmid: COX8A-fwd: TCTCATCATTTTGGCAAAGAATTCGTCGACGCCGCCACCATGTCCGTCCTGACGCCG COX8A-rev: GAGGTTGATTATCGATAAGCTTGATATCTTAATTAACCTCGAGTTTAAACGCGGATC The gRNA plasmid PX458-AAVS1 was derived from PX458. pSpCas9(BB)-2A-GFP (PX458) was a gift from Feng Zhang (Addgene plasmid #48138; http://n2t.net/addgene:48138 ; RRID:Addgene_48138). In brief, oligonucleotides were annealed by primer annealing and integrated into PX458 after linearization with the Bbs I restriction endonuclease. Oligonucleotides for gRNA plasmid: AAVS1-gRNA-fw: CACCGTGTCCCTAGTGGCCCCACTG AAVS1-gRNA-rev: AACCAGTGGGGCCACTAGGGACAC Cell culture HeLa cells were cultured in DMEM containing 4.5 g/L glucose and GlutaMAX™ additive (Thermo Fisher Scientific) supplemented with 100 U/mL penicillin and 100 µg/mL streptomycin (Merck Millipore, Burlington, MA, USA), 1 mM sodium pyruvate (Sigma Aldrich) and 10% (v/v) fetal bovine serum (Merck Millipore).
Generation of a stable cell line
To generate the stable cell line, HeLa cells were co-transfected with the plasmids AAVS1-Blasticidin-CAG-COX8A-SNAP and PX458-AAVS1 using the jetPRIME transfection reagent (Polyplus, Illkirch, France). Starting two days after transfection, the cells were selected using DMEM containing 10 µg/mL Blasticidin S (Invivogen, Toulouse, France) for 7 days. Two weeks after transfection, the cells were stained with DMEM containing 1 µM SNAP-Cell SiR (New England Biolabs, Ipswich, MA, USA) for about 10 minutes. After two washing steps with DMEM (15 min), the cells were detached.
Using fluorescence-activated cell sorting
(FACS), single fluorescent cells were transferred into 96 well plates. After about 3 weeks, single cell clones were again stained using the SNAP-cell SiR dye and clonal cell lines with labeled mitochondria were selected. Expression of the COX8A-SNAP fusion protein was verified by Western blotting. Staining of live cells for STED nanoscopy Cells were seeded in glass bottom dishes (ibidi GmbH, Martinsried, Germany) one day before the measurements. Cells were stained with DMEM containing 1 µM SNAP-Cell SiR (New England Biolabs) and optionally 0.1% (v/v) Quant-IT PicoGreen dsDNA reagent (Thermo Fisher Scientific, Waltham, MA, USA) (15 min, 37 °C). After removing the staining solution and two washing steps with DMEM, the cells were left in the incubator in DMEM for 15–30 minutes to remove unbound dye. Prior to imaging, DMEM was replaced with life cell imaging solution (Thermo Fisher Scientific). Staining of fixed cells for STED nanoscopy Cells were seeded on coverslips and fixed with pre-warmed (37 °C) 8% formaldehyde in phosphate buffered saline for 7 min (PBS, 137 mM NaCl, 2.68 mM KCl and 10 mM Na 2 HPO 4 , pH 7.4). The cells were afterwards permeabilized with 0.5% Triton X-100 in PBS (5 min) and blocked with a solution of 5% (w/v) bovine serum albumin (BSA) in PBS (10 min, RT). Cells were labeled for ATP5I and double-stranded DNA with specific antisera (Proteintech, Rosemont, IL, USA, Abcam, Cambridge, UK). Primary antibodies were diluted in 5% BSA (w/v) in PBS and added to the samples (1 h, RT). Samples were washed several times with PBS and blocked with BSA solution (5 min, RT). The primary antibodies were detected with secondary anti-mouse antibodies labeled with Alexa Fluor 594 (Thermo Fisher Scientific, Waltham, MA, USA) or anti-rabbit antibodies (Jackson Immuno Research Laboratories, West Grove, PA, USA) custom labeled with the dye Abberior STAR RED (Abberior, Göttingen, Germany) (1 h, RT). The samples were washed five times with PBS and mounted in Mowiol mounting medium containing 0.1% (w/v) DABCO (Sigma Aldrich, St. Louis, MO, USA). STED nanoscopy STED nanoscopy was performed using a quad scanning STED microscope (Abberior Instruments, Göttingen, Germany) equipped with a UPlanSApo 100x/1,40 Oil objective (Olympus, Tokyo, Japan). The pinhole was set to 0.7–1.0 Airy units. A pixel size of 20–25 nm was used. For live STED imaging, SNAP-Cell SiR was excited at 640 nm and STED was performed at 775 nm wavelength. PicoGreen was excited at 485 nm wavelength. The fluorescence signal was detected using avalanche photo diodes with bandpass filters. For STED imaging of SNAP-Cell SiR, a gating of 0.75–8 ns was applied. Dwell times of 7–10 µs were used. For STED images, each line was scanned 4 to 8 times and the signal was accumulated. For the confocal images, each line was scanned once. For dual color STED imaging of fixed cells, STAR RED was excited at 640 nm and STED was performed at 775 nm wavelength. AlexaFluor 594 was excited at 561 nm wavelength. The fluorescence signal was detected using avalanche photo diodes with bandpass filters and a gating of 0.75–8 ns was applied. Dwell times of 10 µs were used. Each line was scanned 3 times and the signal was accumulated.
Image processing
No deconvolution was used. All main still images (Figs 1a,b and 2b ) display unprocessed raw data without background subtraction. For time lapse recordings (Fig. 2c ; Supplementary Movies S1 – S4 ), photobleaching was compensated using the Bleach Correction function (histogram matching) in the Fiji software. For dual-color live-cell recordings, background subtraction was performed (5%-10% of the maximum signal).
Transmission EM of HeLa cells
HeLa cells were grown on aclar discs (Plano, Wetzlar, Germany) to a confluency of about 60% and fixed with pre-warmed 2.5% glutaraldehyde in 0.1 M cacodylate buffer (pH 7.4, 1 h, RT). Samples were stored in the fixative over night to complete fixation (4 °C). Cells were washed three times with 0.1 M cacodylate buffer and were stained in 1% (w/v) osmium tetroxide in 0.1 M cacodylate buffer (pH 7.4, 1 h, RT). The samples were washed with distilled water (three times, each for 5 min) and stained en-bloc for 30 min in aqueous 1% (w/v) uranyl acetate (RT, in the dark). Dehydration was performed using an ethanol series of 30, 50, 70 and 100% (three times, each for 5 min) with a final dehydration step in propylene oxide (5 min). Cells were embedded in Agar 100 epoxy resin. Sections of 70 nm thickness were recorded on a Philips CM120 transmission electron microscope with a TVIPS 2k × 2k slow-scan CCD camera.
Supplementary information Supplementary Movie S1 Supplementary Movie S2 Supplementary Movie S3 Supplementary Movie S4 Supplementary Information
📊 Figures
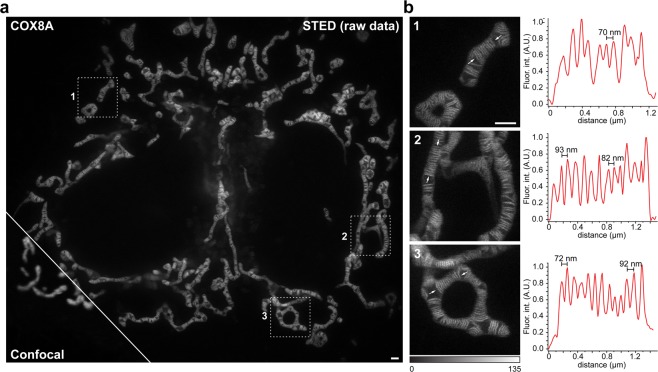
Figure 1
Live-cell Stimulated Emission Depletion (STED) nanoscopy of mitochondrial cristae in HeLa cells. HeLa cells stably expressing COX8A-SNAP fusion proteins were labeled using SNAP-Cell SiR and visualized...
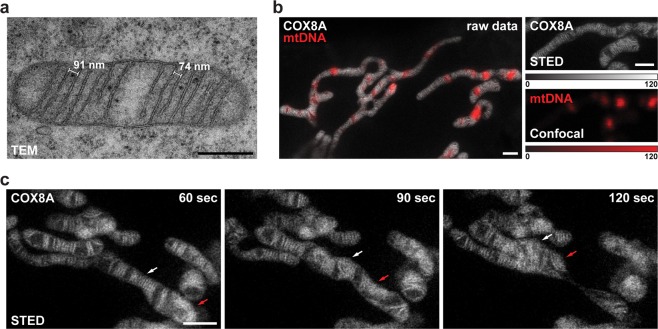
Figure 2
Dynamics of mitochondrial cristae. ( a ) Transmission electron microscopy (TEM) of mitochondria from HeLa cells. ( b ) Dual-color live-cell imaging of mitochondria. HeLa cells stably expressing COX8A-...
Figure images are served from the NIH/NLM PubMed Central Open Access Subset or Europe PMC; copyright remains with the publishers and authors.
💬 Discussion
0 commentsNo comments yet. Be the first to start a discussion!
Leave a Comment