Abstract
In metazoa, new nuclear pore complexes (NPCs) form at two different cell cycle stages: at the end of mitosis concomitant with the reformation of the nuclear envelope and during interphase. However, the mechanisms of these assembly processes may differ. In this study, we apply high resolution live cell microscopy to analyze the dynamics of single NPCs in living mammalian cells during interphase. We show that nuclear growth and NPC assembly are correlated and occur at a constant rate throughout interphase. By analyzing the kinetics of individual NPC assembly events, we demonstrate that they are initiated by slow accumulation of the membrane nucleoporin Pom121 followed by the more rapid association of the soluble NPC subcomplex Nup107-160. This inverse order of recruitment and the overall much slower kinetics compared with postmitotic NPC assembly support the conclusion that the two processes occur by distinct molecular mechanisms.
🔬 Techniques
🔭 Microscopes
🧬 Organisms
💻 Software
✨ Fluorophores
🧪 Sample Preparation
🔬 Cell Lines
🏭 Microscope Brands
🧪 Reagent Suppliers
💻 Software Details
🏛️ Research Organizations (ROR)
Affiliated research institutions:
📋 Methods
DNA constructs and cell culture pPom121-3mCherry and p3mCherry-Nup107 were created by replacing the three copies of EGFP in pPom121-3EGFP ( Daigle et al., 2001 ) and p3EGFP-Nup107 ( Belgareh et al., 2001 ) with three copies of mCherry. NRK cells were maintained in standard DME medium. An NRK cell line stably expressing Pom121-3EGFP ( Daigle et al., 2001 ) was generated by selection with 0.5 mg/ml Geneticin (Invitrogen) and maintained in the presence of the antibiotic. The NRK cell line stably expressing IBB-DiHcRed was described previously in Dultz et al. (2009 ). Both cell lines had mean cell cycle durations of 12.5 h, similar to wild-type NRK cells. All imaging of Pom121 alone was performed in the stable cell line. For experiments with other nucleoporins, the plasmids p3EGFP-Nup107, p3EGFP-Nup133 ( Belgareh et al., 2001 ), pNup93-3EGFP ( Rabut et al., 2004 ), p3mCherry-Nup107, pPom121-3EGFP, and pPom121-3mCherry were expressed transiently as indicated in the figure legends. 3EGFP-Nup107 and 3EGFP-Nup133 were always cotransfected for enhanced signal. Transfections with plasmid DNA were performed with FuGene (Roche) or jetPRIME (PEQLAB Biotechnologie GmbH) according to the instructions of the manufacturer 50–80 h before imaging. All used nucleoporin fusion proteins are stably bound at the NPC ( Rabut et al., 2004 ) and are therefore expected to correctly reflect the structure and assembly of the endogenous proteins. Nevertheless, we cannot exclude subtle changes in the transport properties of the assembled NPCs containing GFPs as has been suggested by single-molecule transport experiments ( Yang and Musser, 2006 ).
Show full methods section
DNA constructs and cell culture pPom121-3mCherry and p3mCherry-Nup107 were created by replacing the three copies of EGFP in pPom121-3EGFP ( Daigle et al., 2001 ) and p3EGFP-Nup107 ( Belgareh et al., 2001 ) with three copies of mCherry. NRK cells were maintained in standard DME medium. An NRK cell line stably expressing Pom121-3EGFP ( Daigle et al., 2001 ) was generated by selection with 0.5 mg/ml Geneticin (Invitrogen) and maintained in the presence of the antibiotic. The NRK cell line stably expressing IBB-DiHcRed was described previously in Dultz et al. (2009 ). Both cell lines had mean cell cycle durations of 12.5 h, similar to wild-type NRK cells. All imaging of Pom121 alone was performed in the stable cell line. For experiments with other nucleoporins, the plasmids p3EGFP-Nup107, p3EGFP-Nup133 ( Belgareh et al., 2001 ), pNup93-3EGFP ( Rabut et al., 2004 ), p3mCherry-Nup107, pPom121-3EGFP, and pPom121-3mCherry were expressed transiently as indicated in the figure legends. 3EGFP-Nup107 and 3EGFP-Nup133 were always cotransfected for enhanced signal. Transfections with plasmid DNA were performed with FuGene (Roche) or jetPRIME (PEQLAB Biotechnologie GmbH) according to the instructions of the manufacturer 50–80 h before imaging. All used nucleoporin fusion proteins are stably bound at the NPC ( Rabut et al., 2004 ) and are therefore expected to correctly reflect the structure and assembly of the endogenous proteins. Nevertheless, we cannot exclude subtle changes in the transport properties of the assembled NPCs containing GFPs as has been suggested by single-molecule transport experiments ( Yang and Musser, 2006 ).
Live cell microscopy
For live cell microscopy, cells were seeded into chambered coverglasses (LabTek; Thermo Fisher Scientific), and the culture medium was exchanged for prewarmed imaging medium (CO 2 -independent medium without phenol red [Invitrogen] supplemented with 20% FCS, 2 mM glutamine, 100 mg/ml penicillin, and streptomycin) at least 30 min before imaging. The chambers were sealed with silicon grease. Live cell microscopy was performed at 37°C on an LSM 510 Meta microscope using the LSM software or an LSM 710 microscope using the Zen software (all microscopes and objectives were obtained from Carl Zeiss, Inc.).
High resolution
NPC data for a single color were acquired on a microscope (LSM 510 Meta) with a 100× Plan-α Fluar objective, NA 1.45. Nuclear volume measurements were performed with a 63× Plan-Apochromat objective, NA 1.4. NPC data in two colors were acquired on the LSM 510 using a 100× Plan-Apochromat objective, NA 1.4 or on the LSM 710 with a 63× Plan-Apochromat objective, NA 1.4. The AutoTimeSeries Macro ( Rabut and Ellenberg, 2004 ) was used to automatically track cells during time-lapse experiments whenever possible on the LSM software–run microscopes.
Imaging for single
NPC assembly events was performed with a time resolution of 3–15 min. Three optical sections at a distance of 0.4–0.5 µm were acquired to cover the entire nuclear envelope and thus exclude that appearance or disappearance of individual NPCs might be caused by local folding or focus fluctuations. For all single-pore analysis, cells were chosen among the 10% highest expressing cells that exhibited no aberrant aggregates or NPC clusters in order to provide sufficient signal for this high resolution time-lapse assay.
Image analysis
Image processing was performed in ImageJ (National Institutes of Health). Calculations and fitting were performed in Excel (Microsoft) unless otherwise stated.
Pore density measurements
The density of pores was measured using the ITCN plugin for ImageJ to find the peak fluorescence of individual pores in a manually selected in-focus region of the nuclear surface. Images were first filtered with a Gaussian blur filter in ImageJ with kernel size 2.5 and then were analyzed with the ITCN plugin using the following parameters: a width of 7 pixels, distance of 6 pixels, and threshold of 0.3–0.5. Errors in this peak detection method were estimated to be
📊 Figures
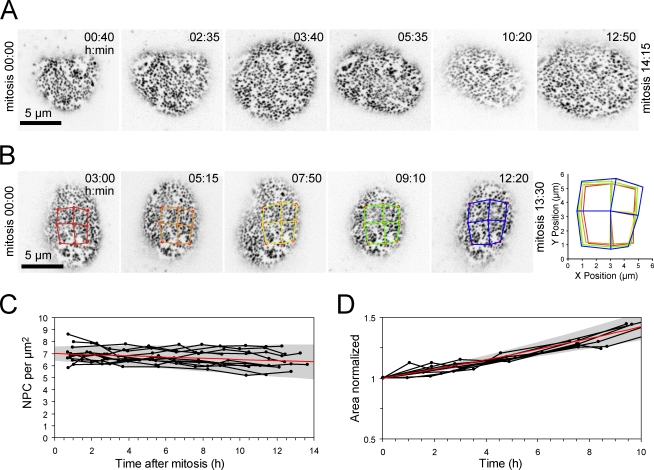
Figure 1.
NPC density and nuclear growth during interphase. (A) An NRK cell stably expressing Pom121-3EGFP was tracked throughout the entire cell cycle. The signal from NPCs on the bottom surface of the nucleus...
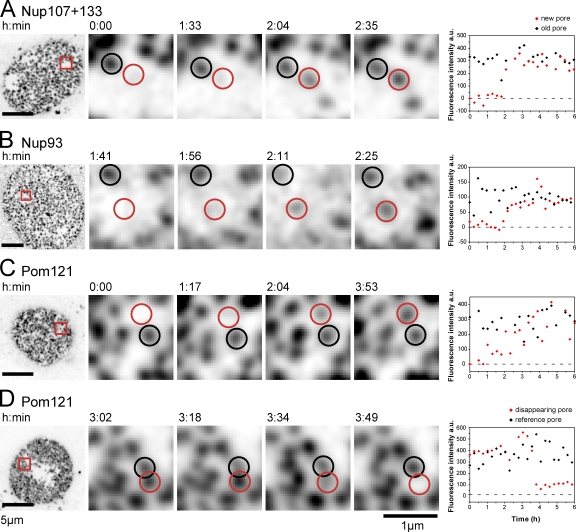
Figure 2.
Assembly of individual new NPCs in interphase. (Au2013C) Time series showing the assembly of individual NPCs labeled by members of different NPC subcomplexes: (A) Nup107u2013160 complex labeled by 3EG...
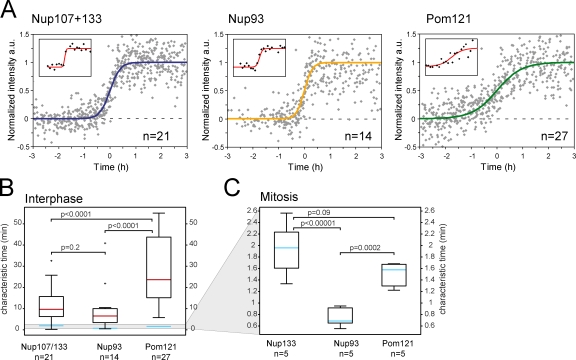
Figure 3.
Kinetics of NPC assembly in interphase. (A) Plots of NPC assembly kinetics. Curves were aligned after fitting with the sigmoid function along the half-maximal intensity. All measured data points are d...
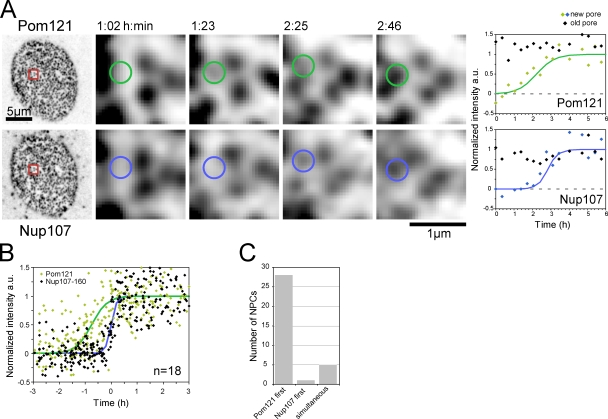
Figure 4.
Order of NPC assembly. (A) A cell expressing Pom121-3EGFP and 3mCherry-Nup107 was imaged at a time resolution of 15 min. A newly appearing NPC is circled. Black data points represent the mean of 10 pr...
Figure images are served from the NIH/NLM PubMed Central Open Access Subset or Europe PMC; copyright remains with the publishers and authors.
💬 Discussion
0 commentsNo comments yet. Be the first to start a discussion!
Leave a Comment