Abstract
During gastrulation in the mouse embryo, dynamic cell movements including epiblast invagination and mesodermal layer expansion lead to the establishment of the three-layered body plan. The precise details of these movements, however, are sometimes elusive, because of the limitations in live imaging. To overcome this problem, we developed techniques to enable observation of living mouse embryos with digital scanned light sheet microscope (DSLM). The achieved deep and high time-resolution images of GFP-expressing nuclei and following 3D tracking analysis revealed the following findings: (i) Interkinetic nuclear migration (INM) occurs in the epiblast at embryonic day (E)6 and 6.5. (ii) INM-like migration occurs in the E5.5 embryo, when the epiblast is a monolayer and not yet pseudostratified. (iii) Primary driving force for INM at E6.5 is not pressure from neighboring nuclei. (iv) Mesodermal cells migrate not as a sheet but as individual cells without coordination.
🔬 Techniques
✨ Fluorophores
🧪 Sample Preparation
🏭 Microscope Brands
🧪 Reagent Suppliers
📷 Detectors
🔎 Objectives
💻 Software Details
🏛️ Research Organizations (ROR)
Affiliated research institutions:
📋 Methods
Mice Histone H2B-GFP and -mCherry transgenic mice were obtained from T. Fujimori (National Institute for Basic Biology) [41] , [42] . Heterozygous embryos from intercrosses between wild-type ICR and Histone H2B-GFP ( Figure 2 , 3 , 4 , S2 ) or H2B-mCherry ( Figure 5 ) were used. All animal experiments were carried out along the guidelines and the approval of The Institutional Animal Care and Use Committee of National Institutes of Natural Sciences (Permit Number: 10A087, 10A90).
Embryo culture and imaging conditions
Mouse embryos were dissected into phenol red–free Dulbecco's modified Eagle's medium (DMEM, Invitrogen) supplemented with 10% fetal bovine serum (Invitrogen), preserving a portion of Reichert's membrane at the ectoplacental cone. Embryos were moved to the pocket space of the specially designed embryo holder which has been filled with medium culture from window of the cylinder ( Figure 1C ). Embryos were set into the hole of the holder and then the holder was pushed until the end of the cylinder. The embryos stayed at the position without window in order to prevent exposure of the embryo to air. The cylinder and holder was set at the stage and inserted into the culture medium in the chamber. The cylinder is elongated due to the length of cylinder holder. Embryos were cultured at 37°C with 5% CO 2 and 5% O 2 , in medium containing 40% phenol red–free DMEM, 10% FCS (Invitrogen), 50% rat serum, 100 µM Trolox (Cayman), 100 U/ml penicillin, and 100 µg/ml streptomycin (Invitrogen). Gas was mixed by a GM-6000 from TOKAIHIT and blown into the air gap of the chamber. The sample holder was attached to the sample positioning system, which comprises three linear translation stages (M-111.2DG, Physik Instrumente) and one micro-rotation stage (M-116DG, Physik Instrumente). Three-dimensional image stacks were acquired every 1.5 or 3 min with a 300 ms exposure time per image and a z-spacing of 2.58 µm.
Show full methods section
Mice Histone H2B-GFP and -mCherry transgenic mice were obtained from T. Fujimori (National Institute for Basic Biology) [41] , [42] . Heterozygous embryos from intercrosses between wild-type ICR and Histone H2B-GFP ( Figure 2 , 3 , 4 , S2 ) or H2B-mCherry ( Figure 5 ) were used. All animal experiments were carried out along the guidelines and the approval of The Institutional Animal Care and Use Committee of National Institutes of Natural Sciences (Permit Number: 10A087, 10A90).
Embryo culture and imaging conditions
Mouse embryos were dissected into phenol red–free Dulbecco's modified Eagle's medium (DMEM, Invitrogen) supplemented with 10% fetal bovine serum (Invitrogen), preserving a portion of Reichert's membrane at the ectoplacental cone. Embryos were moved to the pocket space of the specially designed embryo holder which has been filled with medium culture from window of the cylinder ( Figure 1C ). Embryos were set into the hole of the holder and then the holder was pushed until the end of the cylinder. The embryos stayed at the position without window in order to prevent exposure of the embryo to air. The cylinder and holder was set at the stage and inserted into the culture medium in the chamber. The cylinder is elongated due to the length of cylinder holder. Embryos were cultured at 37°C with 5% CO 2 and 5% O 2 , in medium containing 40% phenol red–free DMEM, 10% FCS (Invitrogen), 50% rat serum, 100 µM Trolox (Cayman), 100 U/ml penicillin, and 100 µg/ml streptomycin (Invitrogen). Gas was mixed by a GM-6000 from TOKAIHIT and blown into the air gap of the chamber. The sample holder was attached to the sample positioning system, which comprises three linear translation stages (M-111.2DG, Physik Instrumente) and one micro-rotation stage (M-116DG, Physik Instrumente). Three-dimensional image stacks were acquired every 1.5 or 3 min with a 300 ms exposure time per image and a z-spacing of 2.58 µm.
Microscopy
We used a Digital Scanned Laser Light Sheet Fluorescence Microscope (DSLM) that was modified from our previously reported implementation [8] . An argon-krypton laser (35 LTL 835–200, Melles Griot) was used as the light source. The wavelength of the laser beam (488 or 568 nm) was selected using an acousto-optical tunable filter (AA.AOTF.nC-400–650 nm-PV-TN, AA Opto-Electronic) and scanned through the sample using a two-axis high-speed scan head (VM500+, GSI Lumonics). The scanned light sheet was created with an f-theta lens (S4LFT0061/065, Sill Optics) and a low-NA objective lens (Plan-Apochromat 5×/0.16, Carl Zeiss). Fluorescence emitted from probes was detected using a water immersion lens (Achroplan 20×/0.5, Carl Zeiss) and recorded with a CCD camera (Orca AG, Hamamatsu) through a long pass filter (RazorEdge RU 488 or 568, Semrock). The image data were recorded using our custom DSLM control software, which was developed in the Microsoft. NET framework. Illumination intensity was measured at the focal point of the illumination objective lens.
Fixation and labeling
Dissected embryos were fixed and permeabilized overnight at 4°C in 4% paraformaldehyde in phosphate-buffered saline (PBS, Sigma) with 0.1% Triton X-100 (Sigma). After thorough washing, embryos were stained with Alexa Fluor 546 phalloidin (1∶100, Invitrogen) and 1 µM DRAQ5 (1∶1000, Biostatus) for one hour at room temperature. Pre-processing of image data and analysis of tracked epiblast and mesodermal cells The acquired data were cropped and aligned in time and space with custom macros in ImageJ (National Institutes of Health). For tracking nuclei in epiblast, we used a custom-made assistant program for manual tracking, which records positions indicated by the user. For mesodermal cell tracking, we used another custom-made program that automatically track nuclei after the user points the position at first time point. The tracking results were confirmed by human eye, and wrong ones were deleted. Both tools were written in C++ (code available upon request). The automated tracking is based on an image recognition algorithm pointing the center of the nuclei. To reconstruct nuclear positions as 3D computer graphics shown in Figure 5 and Movie S4 to 8, we used POV-Ray ( http://www.povray.org ). Statistical analysis was performed in Microsoft Excel. Nuclear density in Figure 4B was calculated as the number of nuclei per 100 µm curve along the apical or basal surface of epiblast. The curve was drawn 8 µm from the apical or basal tips of the nuclei. The meddle was drawn at the center of the epiblast along its apical–basal axis. A nucleus was counted when the curve crossed the apical-basal axis at a point more than 20% of the axis length from the nearest end. The distance of the nearest-neighbor nuclei shown in Figure 4C was calculated as a distance between a nucleus and nearest nucleus in a cone having bottom of same spherical radius as the nucleus and height of twice radius at the nuclear center toward apical or basal side. Nuclear radius is set as 11 µm at apical side and 16.6 µm at basal side and it increases linearly along apical–basal axis. These values were measured with ImageJ (apical n = 30, basal n = 42). Classified regions of mesoderm in Figure 5 were defined according to the following criteria: where = angle between right–left axis and proximal–distal axis, ‘lateral’ was defined as 0°≤
📊 Figures
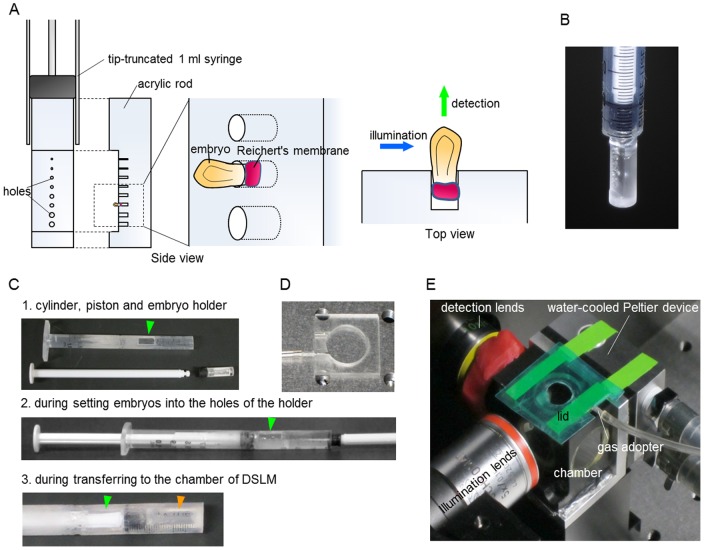
Figure 1
Mouse embryo culture system for DSLM.
(A) Side and top views of the embryo holder. The embryos are placed into the holes of an acrylic rod attached to the piston of a tip-truncated 1-ml syringe. The embryo is held stably in the hole via t...
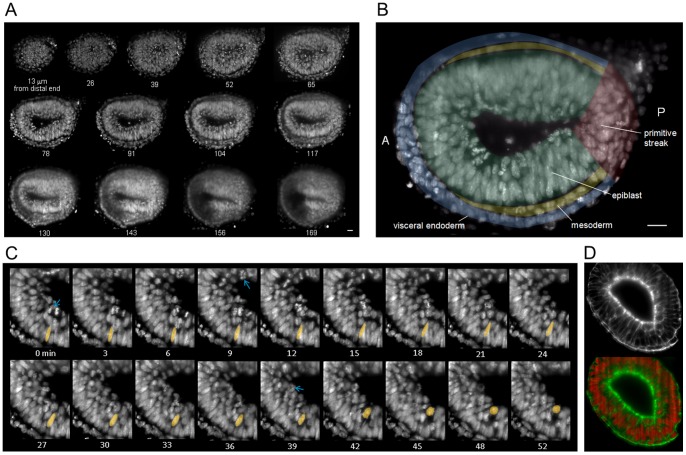
Figure 2
Live imaging of the whole mouse embryo at E6.5 using DSLM.
(A) Optical sections of a Histone H2B-GFP mouse embryo along the axis perpendicular to the proximalu2013distal axis. Each image represents the maximum-intensity projection of a 13-u00b5m thick stack. ...
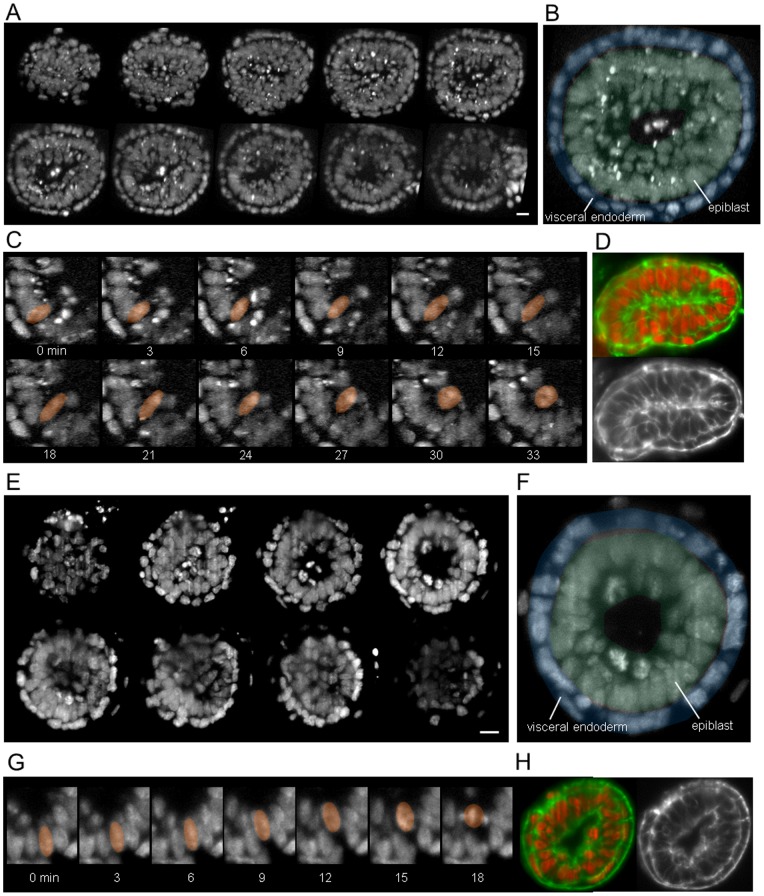
Figure 3
Live imaging of the whole mouse embryo at E6 (A to D) and E5.5. (E to H).
(A and E) Each image represents the maximum intensity projection of a 13-u00b5m thick section. Scale bar u200a=u200a20 u00b5m. (B and F) Annotated sections are 65 (B) and 40 (E) u00b5m from the distal...
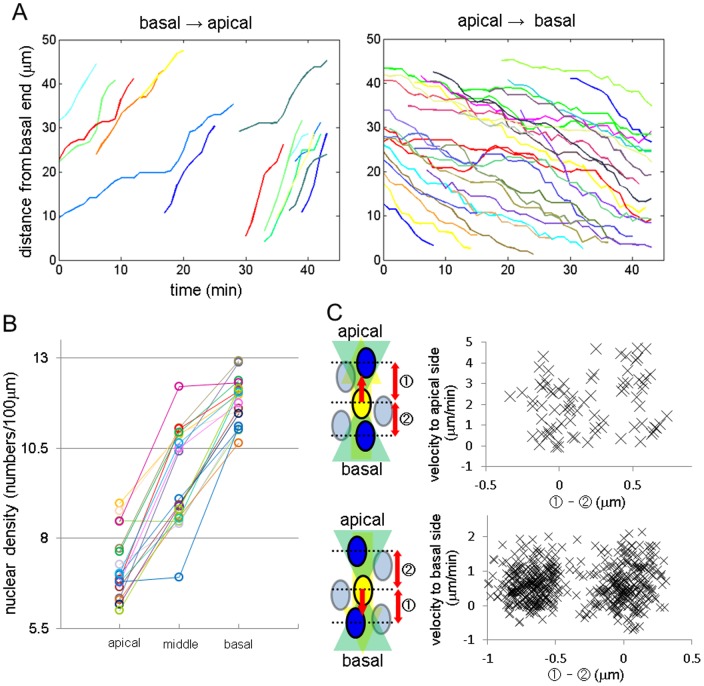
Figure 4
Three-dimensional tracking of all epiblast nuclei in a region of the epiblast.
(A) Kymographs of apical and basal migrations. The positions of each nucleus were reconstructed in Movies S4 (distal view) and S5 (lateral view). (B) Nuclear density compared among three sections alon...
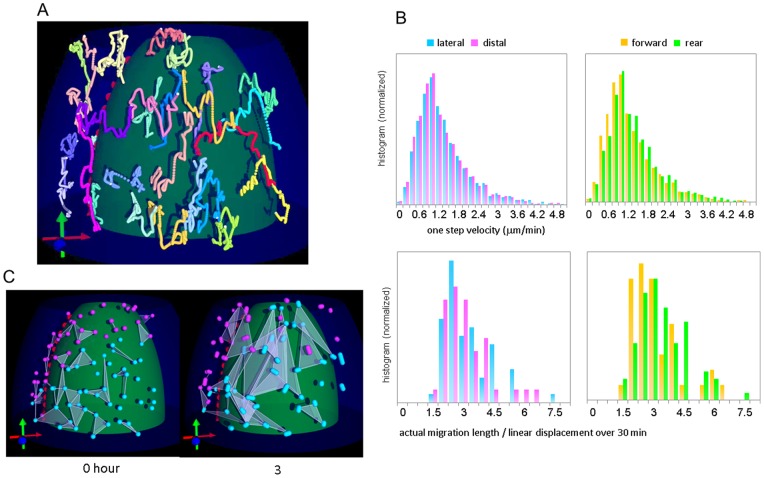
Figure 5
Three-dimensional tracking of mesodermal nuclei.
(A) Computationally reconstructed trajectories ( Movie S6 and S7 ). White mark at the end of trajectory indicates the latest point. Red, blue, and green arrows at the lower left indicate the anterioru...
Figure images are served from the NIH/NLM PubMed Central Open Access Subset or Europe PMC; copyright remains with the publishers and authors.
💬 Discussion
0 commentsNo comments yet. Be the first to start a discussion!
Leave a Comment