Abstract
Most animal cells contain a centrosome, which comprises a pair of centrioles surrounded by an ordered pericentriolar matrix (PCM). Although the role of this organelle in organizing the mitotic spindle poles is well established, its precise contribution to cell division and cell survival remains a subject of debate. By genetically ablating key components of centriole biogenesis in chicken DT40 B cells, we generated multiple cell lines that lack centrioles. PCM components accumulated in acentriolar microtubule (MT)-organizing centers but failed to adopt a higher-order structure, as shown by three-dimensional structured illumination microscopy. Cells without centrioles exhibited both a delay in bipolar spindle assembly and a high rate of chromosomal instability. Collectively, our results expose a vital role for centrosomes in establishing a mitotic spindle geometry that facilitates correct kinetochore-MT attachments. We propose that centrosomes are essential in organisms in which rapid segregation of a large number of chromosomes needs to be attained with fidelity.
🔬 Techniques
🧬 Organisms
💻 Software
✨ Fluorophores
🧪 Sample Preparation
🏭 Microscope Brands
🧪 Reagent Suppliers
📷 Detectors
💻 Software Details
📋 Protocols
💾 Data Repositories
🏛️ Research Organizations (ROR)
Affiliated research institutions:
📋 Methods
Cell culture, drug treatments, and colony formation assays DT40 cells were cultured in suspension in RPMI 1640 medium (Invitrogen), which was supplemented with 10% FBS, 1% chicken serum, 110 U/ml penicillin, 10 mg/ml streptomycin, and 50 µM β-mercaptoethanol at 40°C with 5% CO 2 . Nocodazole (Sigma-Aldrich) was used at 1 µg/ml. For metaphase spreads, DT40 cells were treated with 1 µg/ml colcemid. To assay centrosome amplification, DT40 cells were incubated with 5 µg/ml aphidicolin (Sigma-Aldrich). For colony formation assays, DT40 cells at 10 5 cells/ml were treated at 5, 10, 15, 20, and 25 µM clinical-grade cisplatin (gift from J. Brenton, Cancer Research UK Cambridge Institute, Cambridge, England, UK) for 1.5 h or subjected to ionizing radiation (IR) at 2, 4, 6, 8, and 10 Gy to generate DNA lesions. Cells were serially diluted by 10- and 100-fold. 100 µl of each concentration was plated in duplicates onto methylcellulose. Colony numbers were scored after 12 d. Percentage of cell survival was calculated at different concentrations of cisplatin and doses of IR by normalizing against untreated controls of the same genotype.
Homologous gene targeting in DT40 cells
For generating the targeting construct, left and right arm homology regions were PCR amplified from DT40 genomic DNA using DNA polymerase (Phusion High-Fidelity; Finnzymes) or left arm Taq DNA polymerase (Takara Bio Inc.). PCR reactions were performed according to the manufacturer’s instructions using MgCl 2 -supplemented PCR buffers. The primers used to amplify the left and right arm sequences are listed in Table S1 . Homology arms were cloned into pBluescript II SK− (pSK) ( Arakawa et al., 2001 ). A drug resistance cassette (neomycin, blasticidin, or puromycin) was cloned into pSK between BamHI sites. The two alleles of CEP152 and STIL were targeted sequentially: for both CEP152- and STIL-KO, the first allele was targeted with neomycin, and the second was targeted with puromycin. For C-terminal tandem affinity purification (TAP) tagging, CEP152 homology arms were cloned into a pBluescript II SK− vector carrying a GsTAP (protein G and streptavidin binding protein–containing TAP) sequence ( Bürckstümmer et al., 2006 ). The left arm contained the C-terminal part of CEP152 lacking the STOP codon and was inserted in frame upstream of the GsTAP tag. The blasticidin-resistance cassette was cloned into this construct. All final constructs were linearized and transfected as described in Sir et al. (2011) . Antibiotic-resistant clones were picked after 7–10 d. Targeted integration of the resistance cassettes was screened by PCR. Primers used for PCR reactions are listed in Table S1. WT-2 cells refer to a previously reported DT40 cell line (TAP-CEP63), which was generated by sequential gene targeting of WT cells to have an in-frame TAP tag into both alleles of CEP63 gene. TAP-CEP63 cells were shown to display normal mitotic spindle morphology ( Sir et al., 2011 ).
Show full methods section
Cell culture, drug treatments, and colony formation assays DT40 cells were cultured in suspension in RPMI 1640 medium (Invitrogen), which was supplemented with 10% FBS, 1% chicken serum, 110 U/ml penicillin, 10 mg/ml streptomycin, and 50 µM β-mercaptoethanol at 40°C with 5% CO 2 . Nocodazole (Sigma-Aldrich) was used at 1 µg/ml. For metaphase spreads, DT40 cells were treated with 1 µg/ml colcemid. To assay centrosome amplification, DT40 cells were incubated with 5 µg/ml aphidicolin (Sigma-Aldrich). For colony formation assays, DT40 cells at 10 5 cells/ml were treated at 5, 10, 15, 20, and 25 µM clinical-grade cisplatin (gift from J. Brenton, Cancer Research UK Cambridge Institute, Cambridge, England, UK) for 1.5 h or subjected to ionizing radiation (IR) at 2, 4, 6, 8, and 10 Gy to generate DNA lesions. Cells were serially diluted by 10- and 100-fold. 100 µl of each concentration was plated in duplicates onto methylcellulose. Colony numbers were scored after 12 d. Percentage of cell survival was calculated at different concentrations of cisplatin and doses of IR by normalizing against untreated controls of the same genotype.
Homologous gene targeting in DT40 cells
For generating the targeting construct, left and right arm homology regions were PCR amplified from DT40 genomic DNA using DNA polymerase (Phusion High-Fidelity; Finnzymes) or left arm Taq DNA polymerase (Takara Bio Inc.). PCR reactions were performed according to the manufacturer’s instructions using MgCl 2 -supplemented PCR buffers. The primers used to amplify the left and right arm sequences are listed in Table S1 . Homology arms were cloned into pBluescript II SK− (pSK) ( Arakawa et al., 2001 ). A drug resistance cassette (neomycin, blasticidin, or puromycin) was cloned into pSK between BamHI sites. The two alleles of CEP152 and STIL were targeted sequentially: for both CEP152- and STIL-KO, the first allele was targeted with neomycin, and the second was targeted with puromycin. For C-terminal tandem affinity purification (TAP) tagging, CEP152 homology arms were cloned into a pBluescript II SK− vector carrying a GsTAP (protein G and streptavidin binding protein–containing TAP) sequence ( Bürckstümmer et al., 2006 ). The left arm contained the C-terminal part of CEP152 lacking the STOP codon and was inserted in frame upstream of the GsTAP tag. The blasticidin-resistance cassette was cloned into this construct. All final constructs were linearized and transfected as described in Sir et al. (2011) . Antibiotic-resistant clones were picked after 7–10 d. Targeted integration of the resistance cassettes was screened by PCR. Primers used for PCR reactions are listed in Table S1. WT-2 cells refer to a previously reported DT40 cell line (TAP-CEP63), which was generated by sequential gene targeting of WT cells to have an in-frame TAP tag into both alleles of CEP63 gene. TAP-CEP63 cells were shown to display normal mitotic spindle morphology ( Sir et al., 2011 ).
Antibodies and immunostainings
Primary antibodies used in this study were CDK5RAP2 and chicken anti-TACC3 raised against aa 126–442 of Gallus gallus TACC3 ( Barr et al., 2010 ), centrin-3 (Abnova), protein G, protein G–HRP (Abcam), α-tubulin (Dm1α; Sigma-Aldrich), γ-tubulin (GTU88; Sigma-Aldrich), BrdU (B44; BD), chicken CENP-O (Medical and Biological Laboratories, Co.), and myosin IIA (Sigma-Aldrich). DNA was stained with Hoechst 33258 (Sigma-Aldrich). Before fixation, DT40 cells were settled onto poly- l -lysine–coated coverslips for 10 min at 40°C. For visualization of mitotic spindles and centrosomal proteins, cells were fixed in cold 100% methanol for 5 min at –20°C and washed with PBS/0.1% Tween 20. For 3D-SIM experiments, DT40 cells were treated with PBS/1% Triton X-100/0.5% NP-40 for 5 min at room temperature after methanol fixation. For visualization of kinetochores, cells were fixed in 3.7% formaldehyde containing 100 mM Pipes, 1 mM MgCl 2 , 0.5 mM CaCl 2 , and 0.4% Triton X-100, pH 6.8, and then postfixed in cold methanol for 5 min. All primary antibodies were diluted at 0.25–1 µg/ml in PBS/5% BSA and incubated with coverslips for 2 h at 37°C or overnight at 4°C. Secondary antibodies conjugated to Alexa Fluor 488, 555, and 594 (Invitrogen) were used at 1 µg/ml in PBS/5% BSA and incubated with coverslips for 1 h at 37°C. Coverslips were mounted in antifade medium (ProLong Gold; Invitrogen) containing 1.5 µg/ml Hoechst 33258 (Sigma-Aldrich).
Image acquisition and processing
Imaging of fixed cells was performed on a scanning confocal microscope (Eclipse 90i; Nikon) except for kinetochore stainings, which were acquired on an OMX DeltaVision microscope (Applied Precision) in conventional mode. Cells were mounted in antifade medium (ProLong Gold) and imaged with 100×, 1.4 NA objective (Nikon). Images presented here are 3D projections of z sections taken every 0.5 µm across the cell. Images of any individual figures were acquired using the same settings and were imported into Volocity (5.0; PerkinElmer) and Photoshop (CS6; Adobe) and were adjusted to use the full range of pixel intensities. Super-resolution microscopy was performed using a Structured Illumination Microscope by OMX DeltaVision. Cells were imaged with 60×, 1.4 NA objective (Olympus). Data were reconstructed using softWoRx software (Applied Precision) and then imported into Volocity (5.0) and Photoshop (CS6) and were adjusted to use the full range of pixel intensities. Fluorochromes used in this study are Alexa Fluor fluorophores (Molecular Probes) Alexa Fluor 488, Alexa Fluor 555, and Alexa Fluor 594. DNA was visualized by Hoechst staining. For time-lapse imaging of DT40 cells expressing GFP–α-tubulin and histone H2B–GFP ( Kanda et al., 1998 ), cells were settled onto 60-µm dishes (µ-Dish 35mm,low ; ibidi) and supplemented with Leibovitz’s L-15 medium (Invitrogen) containing 10% FBS. Cells were imaged at 40°C in a humidified incubation chamber (Tokai Hit) and were imaged using a spinning-disc confocal system (PerkinElmer) mounted on an inverted microscope (Eclipse TE2000-S; Nikon) and equipped with an electron-multiplying charge-coupled device digital camera (C9100-13; Hamamatsu Photonics). Imaging was performed with a frame rate of 3 min with z steps of 1.5 µm using Volocity 2D. Volume-rendered image sequences were exported as QuickTime files (Apple). Bright-field images were taken at the same interval or occasionally at a frame rate of 6 min. For still images, snapshots were taken in Volocity and processed in Photoshop. EM DT40 cells were pelleted and immediately fixed in prewarmed 1% glutaraldehyde in PHEM (60 mM Pipes, 25 mM Hepes, 2 mM MgCl 2 , and 1 mM EGTA, pH 6.9) or PBS buffer for 1 h at 37°C. Cell pellets were washed in 0.1 M Na cacodylate buffer, pH 7.2, at room temperature for 5 min each and postfixed in 1% osmium tetroxide in Na cacodylate buffer for 1 h at room temperature or 30 min at 4°C. Pellets were then washed in Na cacodylate buffer twice for 30 min. Pellets were gradually dehydrated by immersing them in a graded ethanol solution from 50, 70, to 90% and three times in 100% ethanol. Dehydrated cell pellets were embedded in Epoxy medium using Epoxy Embedding kit (Fluka) or Araldite, and serial sections were cut. MT regrowth For MT regrowth experiments, cells were treated with 1 µg/ml nocodazole for 1 h ( Fig. 4 E ) or 3 h (Fig. S3) at 40°C followed by 1 h on ice. Cells were washed three times for 5 min with cold PBS and then transferred to poly- l -lysine–coated coverslips for 30 min on ice. Cells on the coverslip were incubated for 3 min at 40°C to polymerize MTs.
Western blotting
DT40 cells were lysed in hypotonic buffer containing 10 mM Tris-HCl, pH 7.4, 10 mM KCl, 1.5 mM MgCl 2 , 10 µM β-mercaptoethanol, and protease inhibitor cocktail (Sigma-Aldrich) by passing them through a 23-gauge needle. Cleared cytoplasmic extracts were obtained by centrifuging cell lysates at 16,000 g for 20 min at 4°C. Lysates were separated on 3–8% Tris-acetate or 4–12% Bis-Tris SDS-PAGE gels (Invitrogen) and transferred onto nitrocellulose for Western blot analysis.
Apoptosis assay and flow cytometry
For cell cycle analysis, DT40 cells were pulsed with 20 µM BrdU for 10 min. Cells were then fixed in 70% ice-cold ethanol and incubated with 2 M HCl/0.5% Triton X-100 in PBS at 37°C. Cells were then incubated with anti-BrdU antibody at 1:35 for 1 h at 37°C with shaking. Cells were washed and incubated with FITC-conjugated anti–mouse antibody (Jackson ImmunoResearch Laboratories, Inc.). Cells were then treated with 40 µg/ml propidium iodide and 100 µg/ml RNase A for 15 min. Apoptosis assays were performed using the MitoProbe JC-1 Assay kit (Invitrogen) according to the manufacturer’s instruction. The fluorescence emission shift from green to red was measured on the cytometer (FACSCalibur; Cytek) and analyzed with the software FlowJo v10 (Tree Star, Inc.).
Statistical analysis
Statistical analysis and graphs were performed using Excel (Microsoft) or Prism (GraphPad Software). The number of experimental repeats ( n values) are reported for each dataset in the figures and figure legends. Data are presented as means ± SEM unless stated otherwise. One-way analysis of variance for multiple comparisons was performed on all data followed by Tukey’s test using Prism 6. When normal distribution could not be confirmed, the nonparametric Kruskal–Wallis was used followed by Dunn’s multiple comparison posttest. Online supplemental material Fig. S1 summarizes gene targeting. Fig. S2 and Fig. S3 show analyses of aMTOCs and chromosome missegregation phenotypes, respectively.
Table
S1 shows primer sequences. Videos 1, 2, and 3 show mitosis in GFP–α-tubulin–expressing WT (Video 1), CEP152-KO (Video 2), and STIL-KO (Video 3) cells. Videos 4, 5, and 6 show mitosis in H2B-GFP–expressing WT (Video 4), CEP152-KO (Video 5), and STIL-KO (Video 6) cells. Online supplemental material is available at http://www.jcb.org/cgi/content/full/jcb.201309038/DC1 . Additional data are available in the JCB DataViewer at http://dx.doi.org/10.1083/jcb.201309038.dv .
Online supplemental material Fig. S1 summarizes gene targeting. Fig. S2 and Fig. S3 show analyses of aMTOCs and chromosome missegregation phenotypes, respectively.
Table
S1 shows primer sequences. Videos 1, 2, and 3 show mitosis in GFP–α-tubulin–expressing WT (Video 1), CEP152-KO (Video 2), and STIL-KO (Video 3) cells. Videos 4, 5, and 6 show mitosis in H2B-GFP–expressing WT (Video 4), CEP152-KO (Video 5), and STIL-KO (Video 6) cells. Online supplemental material is available at http://www.jcb.org/cgi/content/full/jcb.201309038/DC1 . Additional data are available in the JCB DataViewer at http://dx.doi.org/10.1083/jcb.201309038.dv .
📊 Figures
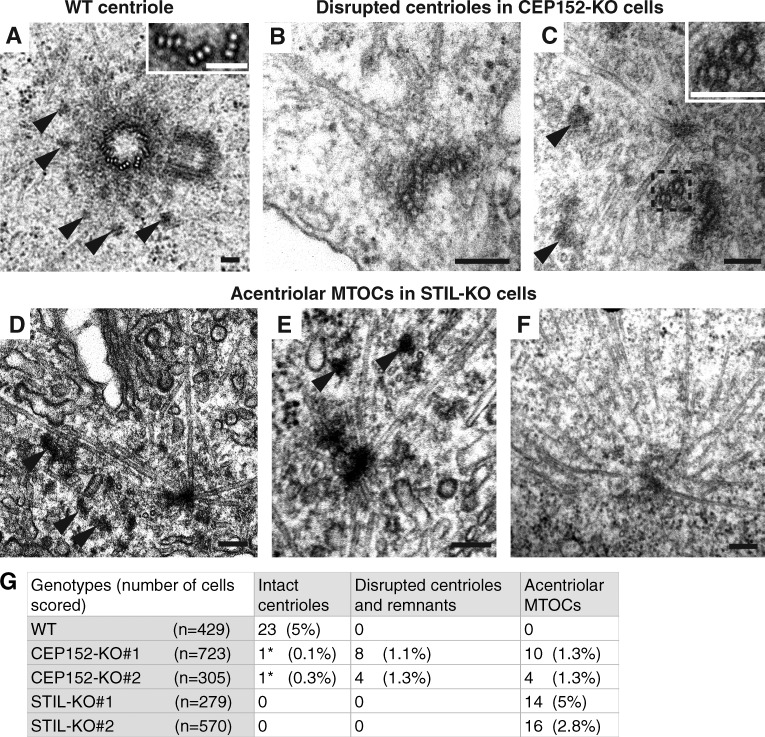
Figure 1.
CEP152-KO and STIL-KO DT40 cells lack intact centrioles. (Au2013G) TEM of WT, CEP152-KO, and STIL-KO cells. Arrowheads indicate centriolar satellites. Bars, 100 nm. (A) A centriole pair is illustrated...
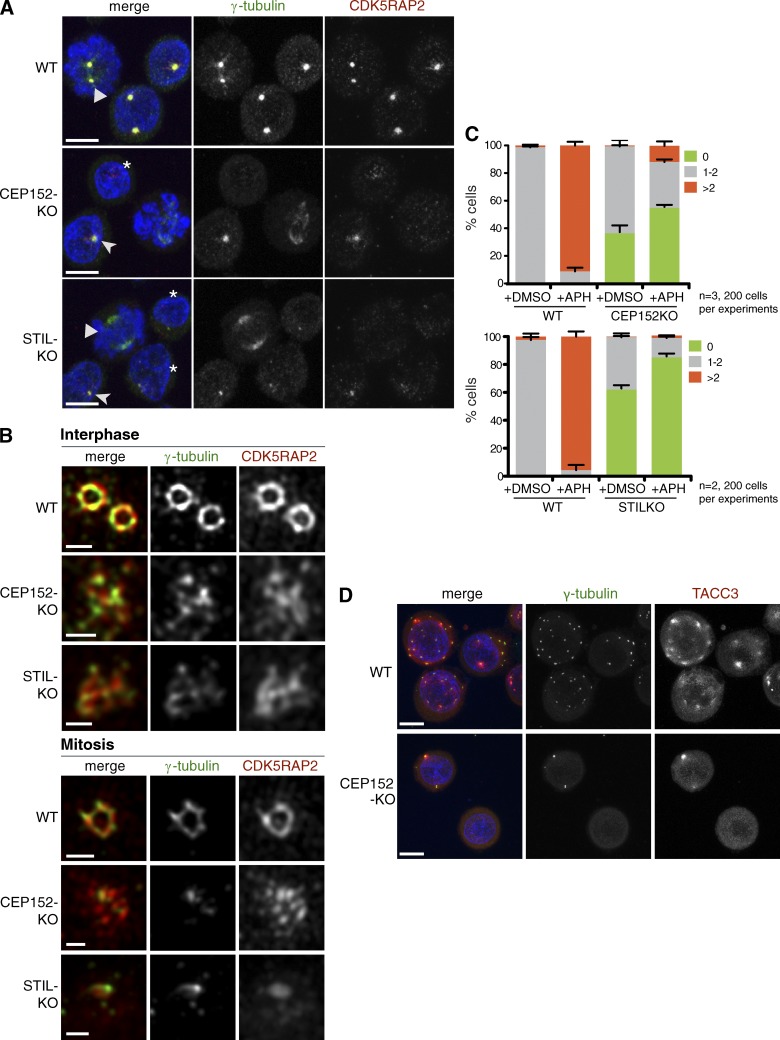
Figure 2.
aMTOCs in KO cells are disordered and unable to overduplicate. (A) CEP152-KO and STIL-KO cells contain cytoplasmic foci enriched in u03b3-tubulin and CDK5RAP2. Triangles indicate mitotic cells. Asteri...
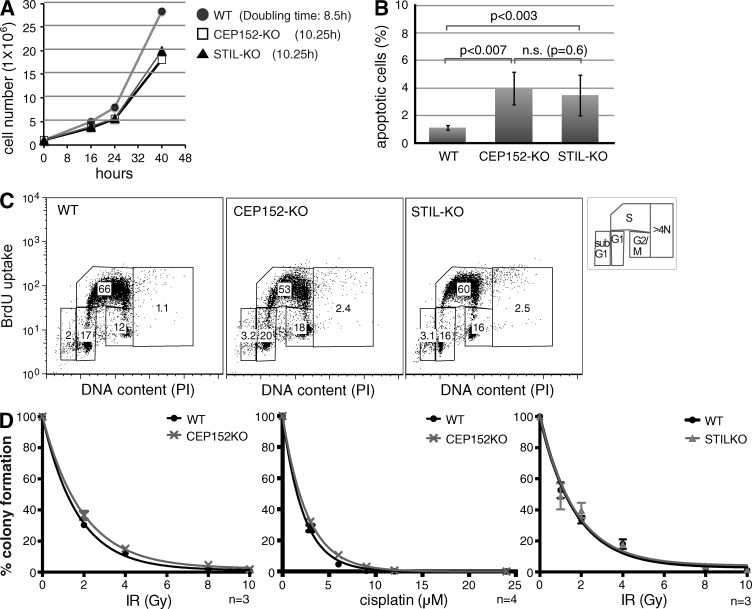
Figure 3.
Cells lacking intact centrioles proliferate slowly but are proficient in DNA repair. (A) CEP152-KO and STIL-KO cells display growth impairment. (B) KO cells show increased apoptosis compared with WT. ...
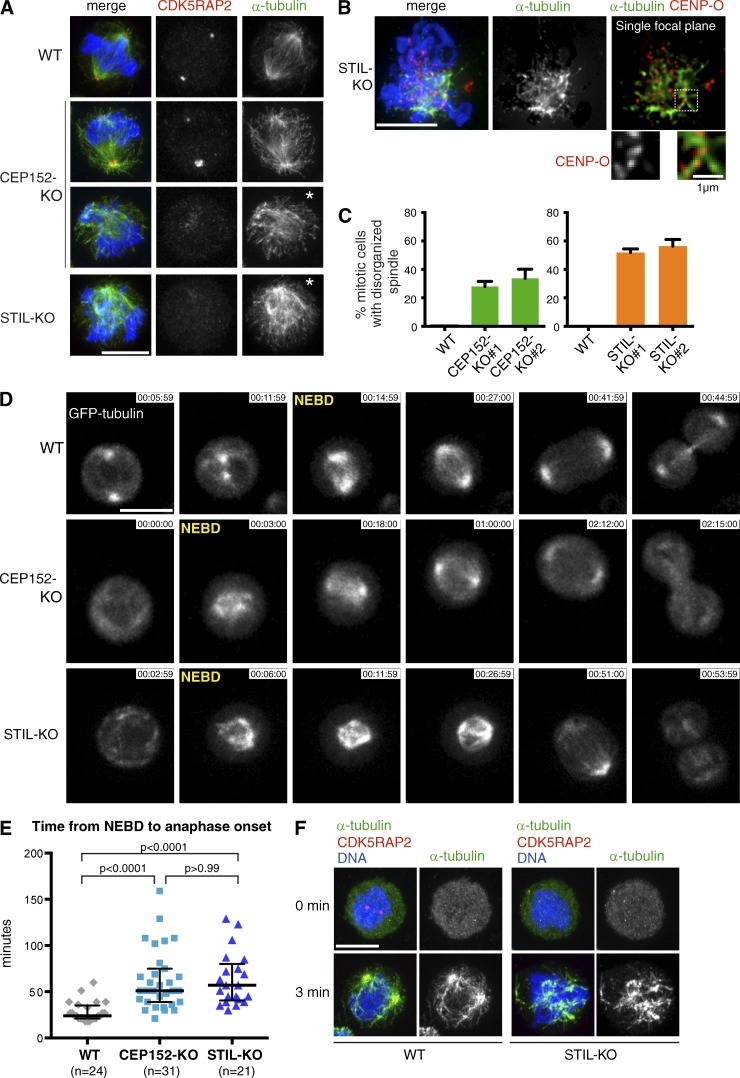
Figure 4.
Bipolar spindle formation and anaphase onset are delayed in cells lacking intact centrioles. (A) CEP152-KO and STIL-KO cells contain disorganized mitotic spindles. Cells were stained with antibodies a...
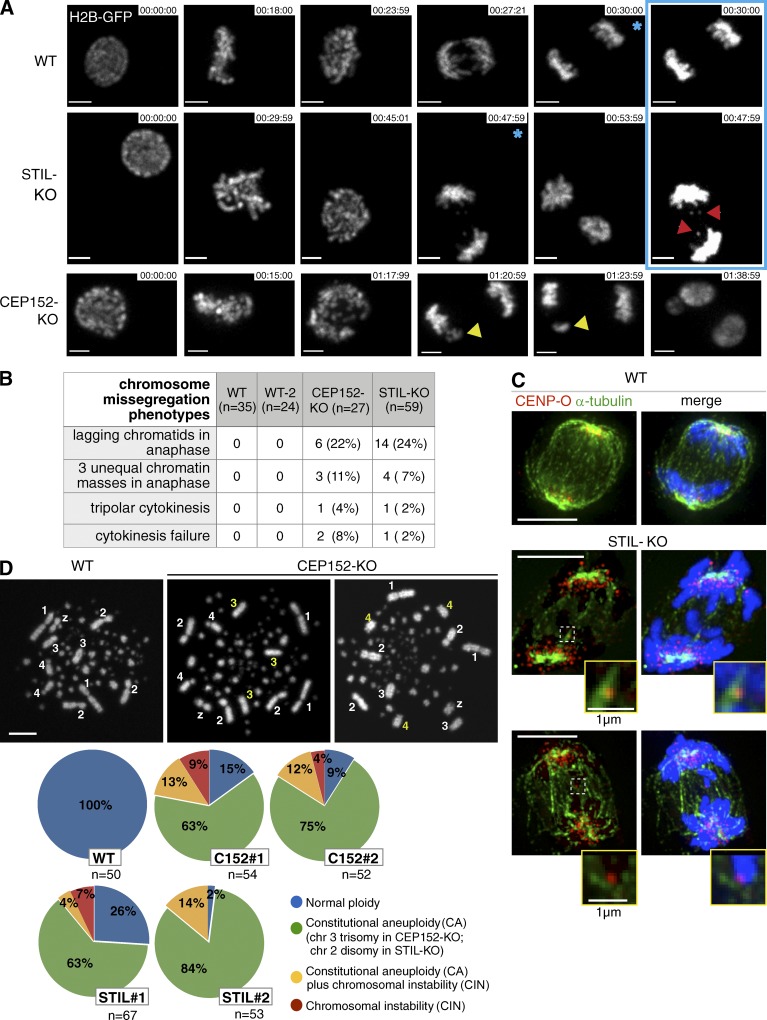
Figure 5.
CEP152-KO and STIL-KO cells exhibit chromosome instability and aneuploidy. (A) Still frames from time-lapse experiments show H2B-GFPu2013expressing WT, CEP152-KO, and STIL-KO cells ( Videos 4 , 5 , an...
Figure images are served from the NIH/NLM PubMed Central Open Access Subset or Europe PMC; copyright remains with the publishers and authors.
💬 Discussion
0 commentsNo comments yet. Be the first to start a discussion!
Leave a Comment