Abstract
Abstract Therapeutic antibodies are an important and rapidly growing drug modality. However, the design and discovery of early-stage antibody therapeutics remain a time and cost-intensive endeavor. Here we present an end-to-end Bayesian, language model-based method for designing large and diverse libraries of high-affinity single-chain variable fragments (scFvs) that are then empirically measured. In a head-to-head comparison with a directed evolution approach, we show that the best scFv generated from our method represents a 28.7-fold improvement in binding over the best scFv from the directed evolution. Additionally, 99% of designed scFvs in our most successful library are improvements over the initial candidate scFv. By comparing a library’s predicted success to actual measurements, we demonstrate our method’s ability to explore tradeoffs between library success and diversity. Results of our work highlight the significant impact machine learning models can have on scFv development. We expect our method to be broadly applicable and provide value to other protein engineering tasks.
✨ Fluorophores
🧪 Sample Preparation
🏭 Microscope Brands
🧪 Reagent Suppliers
💻 Software Details
💾 Data Repositories
🏛️ Research Organizations (ROR)
Affiliated research institutions:
📋 Methods
Bayesian-based approach provides insights prior to experimental testing
We defined an in silico performance metric that quantifies the binding performance of a library prior to experimental testing. With the Bayesian approach, the fitness score is the posterior probability of a sequence in the library having a stronger binding affinity than the candidate scFv Ab-14. We average the individual fitness scores of the full library to come up with our metric - an estimate of the probability of success (i.e., the estimated percent of sequences having a better binding performance than the threshold value). We first evaluated the utility of the metric on the hold-out test data from the training scFv library as we vary the threshold value that defines strong binders and show the estimated percent of success matches well to the actual percent of success (Supplementary Fig. 7 ). We applied the metric (estimated percent of success) to the designed libraries and ranked them. We compared the library ranking based on the estimated and measured percent of success (Supplementary Table 8 ). For PSSM and ensemble-based libraries, the predicted rankings match well to the actual rankings with a rank correlation of 0.8. For ranking PSSM and GP-based libraries, the metric predicts all rankings correctly for Ab-14-H variant libraries and a rank correlation of 0.8 for Ab-14-L variant libraries. Moreover, we observed that the estimated percent of success captures well the relative performance of designed libraries for both heavy- and light-chain designs (Supplementary Figs. 8 and 9 ). We then sought to extend the application of the in silico metric to comparing the choice of optimizing one CDR to optimizing all three simultaneously. For this comparison, designs were generated using the genetic algorithm sampling over the ensemble-extrapolated fitness landscape. We observed that designing all heavy-chain CDRs leads to sequences with higher estimated percent of success than when designing individual CDRs (Supplementary Fig. 10 ). Based on these findings, we demonstrate that the performance metric can be used to understand design choices and explore tradeoffs between performance and diversity, and in the future to inform library selection and parameter tuning prior to experimental testing.
Show full methods section
Bayesian-based approach provides insights prior to experimental testing
We defined an in silico performance metric that quantifies the binding performance of a library prior to experimental testing. With the Bayesian approach, the fitness score is the posterior probability of a sequence in the library having a stronger binding affinity than the candidate scFv Ab-14. We average the individual fitness scores of the full library to come up with our metric - an estimate of the probability of success (i.e., the estimated percent of sequences having a better binding performance than the threshold value). We first evaluated the utility of the metric on the hold-out test data from the training scFv library as we vary the threshold value that defines strong binders and show the estimated percent of success matches well to the actual percent of success (Supplementary Fig. 7 ). We applied the metric (estimated percent of success) to the designed libraries and ranked them. We compared the library ranking based on the estimated and measured percent of success (Supplementary Table 8 ). For PSSM and ensemble-based libraries, the predicted rankings match well to the actual rankings with a rank correlation of 0.8. For ranking PSSM and GP-based libraries, the metric predicts all rankings correctly for Ab-14-H variant libraries and a rank correlation of 0.8 for Ab-14-L variant libraries. Moreover, we observed that the estimated percent of success captures well the relative performance of designed libraries for both heavy- and light-chain designs (Supplementary Figs. 8 and 9 ). We then sought to extend the application of the in silico metric to comparing the choice of optimizing one CDR to optimizing all three simultaneously. For this comparison, designs were generated using the genetic algorithm sampling over the ensemble-extrapolated fitness landscape. We observed that designing all heavy-chain CDRs leads to sequences with higher estimated percent of success than when designing individual CDRs (Supplementary Fig. 10 ). Based on these findings, we demonstrate that the performance metric can be used to understand design choices and explore tradeoffs between performance and diversity, and in the future to inform library selection and parameter tuning prior to experimental testing.
Methods Training data for language models
We used sequences from Pfam 27 and Observed Antibody Space (OAS) 28 databases to train four separate language models (i.e., a protein language model, an antibody heavy chain model, an antibody light chain model and a paired heavy-light chain model). The Pfam is a database of curated protein families containing raw sequences of amino acids for individual protein domains. We use the same data splits as provided in TAPE 8 . The train, validation and test splits contain 32,593,668, 1,715,454 and 44,311 sequences, respectively. The full OAS database contains immune repertoires from over 75 studies containing a diverse set of immune states. We curated only studies with naïve human subjects and removed redundant sequences across the studies. This results in 37 studies containing 270,171,931 heavy chain sequences, 9 studies containing 70,838,791 light chain sequences, and 3 studies containing 33,881 heavy-light sequence pairs. The train, validation and test sequences are split based on studies. Given that there are limited heavy-light sequence pairs in the OAS data, to train the paired heavy-light chain model, we used all the data from OAS heavy chains, OAS light chains and OAS heavy-light sequence pairs. For sequence pairs with missing heavy or light chain, we left the missing chain as an empty sequence. Supplementary Table 3 summarizes the number of sequences in train, validation and test data for the four language model training datasets.
Training BERT language models
We used the BERT masked language model 23 to encode protein/antibody sequences (Supplementary Fig. 12 ). The BERT model estimates the probability of an amino acid sequence documentclass[12pt]{minimal} usepackage{amsmath} usepackage{wasysym} usepackage{amsfonts} usepackage{amssymb} usepackage{amsbsy} usepackage{mathrsfs} usepackage{upgreek} setlength{oddsidemargin}{-69pt} begin{document}$${{{{{rm{p}}}}}}({{{{{bf{x}}}}}})$$end{document} p ( x ) by considering the probability distribution over each amino acid at each position conditioned on all other amino acids in the sequence, that is, 1 documentclass[12pt]{minimal} usepackage{amsmath} usepackage{wasysym} usepackage{amsfonts} usepackage{amssymb} usepackage{amsbsy} usepackage{mathrsfs} usepackage{upgreek} setlength{oddsidemargin}{-69pt} begin{document}$${{{{{rm{p}}}}}}({{{{{bf{x}}}}}}),=,{prod }_{{{{{{rm{i}}}}}}=1}^{{{{{{rm{i}}}}}}={{{{{rm{L}}}}}}},{{{{{rm{p}}}}}}({x}_{i}{{{{{rm{|}}}}}}{x}_{1}...,{x}_{i-1},,{x}_{i+1}...,{x}_{L})$$end{document} p ( x ) = ∏ i = 1 i = L p ( x i ∣ x 1 . . . x i − 1 , x i + 1 . . . x L ) where documentclass[12pt]{minimal} usepackage{amsmath} usepackage{wasysym} usepackage{amsfonts} usepackage{amssymb} usepackage{amsbsy} usepackage{mathrsfs} usepackage{upgreek} setlength{oddsidemargin}{-69pt} begin{document}$${x}_{i}$$end{document} x i represents the documentclass[12pt]{minimal} usepackage{amsmath} usepackage{wasysym} usepackage{amsfonts} usepackage{amssymb} usepackage{amsbsy} usepackage{mathrsfs} usepackage{upgreek} setlength{oddsidemargin}{-69pt} begin{document}$${{{{{{rm{i}}}}}}}^{{{{{{rm{th}}}}}}}$$end{document} i th amino acid in the sequence of length L. We pretrained four separate BERT language models, i.e., a protein language model, an antibody heavy chain model, an antibody light chain model and a paired heavy-light chain model, using the Pfam data and OAS data. Specifically, BERT masked language models were trained with 768 input embedding size, 24 hidden layers, 1024 hidden size, 4096 intermediate feed-forward size and 16 attention heads. All the other architecture details are fixed to their default values used in BERT 8 , 23 with Adam optimization 32 . We trained the language model to predict randomly masked amino acids in a single sequence or a sequence pair (Supplementary Fig. 12 ). For training the protein language model, antibody heavy chain model and antibody light chain model, the input is a single sequence of amino acids. For training the paired heavy-light chain model, the input is a concatenation of heavy and light sequences separated by a special token. Token type IDs are set to 0 for the ‘CLS’ token, 1 for the heavy chain amino acids and 2 for the light chain amino acids to identify two types of chains. Position IDs are set to be the integer position of the amino acid within its respective chain. The Pfam language model was initialized randomly. All other language models were initialized with the pre-trained Pfam model. For all models, the learning rate is set to 10 −5 , batch size is 1024 and the warm-up step is 10,000. One training epoch is defined as one full iteration over all the sequences in the training data. All models were trained until convergence of the cross-entropy loss value (which is evaluated on the validation data after every epoch), or until the maximum number of epochs, 10, was reached. All models were implemented in PyTorch 33 and trained on NVIDIA Volta V100 GPUs using a distributed compute architecture. The standard average perplexity score is used to evaluate the language model performance on the hold-out test data. The perplexity measures how well the trained language models are at predicting the masked tokens. Lower values indicate better performance. The average perplexities of the 4 language models on the respective test data are 13.15 for the Pfam model, 1.56 for the heavy-chain model, 1.43 for the light-chain model and 1.16 for the paired model. When evaluated on the OAS light-chain test data, the average perplexities of the 4 language models are 7.47, 16.40, 1.43 and 1.42, respectively. When evaluated on the OAS heavy-chain test data, the average perplexities of the 4 language models are 12.20, 15.30, 1.56 and 1.56, respectively.
Training sequence-to-affinity models via transfer learning
To prepare the training data 25 , we randomly split the sequences in the initial Ab-14-H variant library and Ab-14-L variant library into train/validation/test sets with 0.8/0.1/0.1 split. Since the experimental assay on the initial random scFv library was conducted in triplicate 25 (each scFv sequence has 3 measurements), the average value of all measurements corresponding to the same scFv is used. An assay with an empty measured binding affinity indicates that it is beyond the limit of detection and is deemed a poor binder. We considered two options for how missing values are treated: dropping the assay with missing value or imputing it with the median value of all assays of the same candidate chain. We trained separate target-specific sequence-to-affinity models for Ab-14-H variants and Ab-14-L variants. We used model fine-tuning as a way to transfer knowledge learned from pre-trained language models to predicting sequence affinities. We investigated two approaches, which in addition to affinity prediction, provide estimates of prediction uncertainties: an ensemble method and Gaussian Process (GP). Both approaches use learned knowledge from pretrained language models and provide meaningful sequence-to-affinity models from which one can design a diverse antibody library. The ensemble model consists of 16 different trained regression models that were fine-tuned from the 4 pretrained language models with two different regression loss functions and two different data preprocessing steps (Supplementary Table 9 ). The two loss functions used were the mean squared error (MSE) and the mean absolute error (MAE) between the predicted affinities and measured affinities. For the data preprocessing step, we used two options for treating missing values: dropping the assay with missing value or imputing it with the median value. To train a regression model, we fine-tuned the pre-trained BERT language model (initially trained on massive sequence data without affinity measurements) by adding a linear regression decision head to the BERT model and continuing to train it on a smaller set of scFv sequences with experimental binding measurements. The outputs of the ensemble model are the mean and the standard deviation of the outputs of the 16 regression models. While the ensemble method is known to enhance predictive performance, GP is another powerful technique used for quantifying uncertainties. For the GP model, we used the pretrained heavy-chain language model to train the GP model for the heavy chain sequence-to-affinity model and the pretrained light-chain language model for the light chain sequence-to-affinity GP model. Sequences were represented by first concatenating the learned vector representations of each amino acid from the pretrained language model, and then performing principal component analysis (PCA) to reduce the vector dimension to 1024. The GP model was trained on these reduced vector representations. Assays with missing values were imputed with the median value in the data preprocessing step. The trained GP model outputs a mean and a standard deviation of the binding affinity prediction. ML-extrapolated fitness functions To generate a high affinity scFv library in silico, we used a Bayesian-based acquisition function extrapolated from the sequence-to-affinity model to construct the scFv fitness landscape. In contrast to non-Bayesian settings where the sequence is mapped directly to estimated affinity, the fitness function is defined to be a mapping from the entire scFv sequence to a posterior probability, 2 documentclass[12pt]{minimal} usepackage{amsmath} usepackage{wasysym} usepackage{amsfonts} usepackage{amssymb} usepackage{amsbsy} usepackage{mathrsfs} usepackage{upgreek} setlength{oddsidemargin}{-69pt} begin{document}$${{{{{rm{f}}}}}}({{{{{bf{x}}}}}})={{{{{rm{p}}}}}}({{{{{rm{aff}}}}}}({{{{{bf{x}}}}}}) < sigma {{{{{rm{|}}}}}}{{{{{bf{x}}}}}}),$$end{document} f ( x ) = p ( aff ( x ) < σ ∣ x ) , that the estimated binding affinity aff( x ) of the sequence x is better than the threshold σ . The threshold was set to the averaged assayed value of Ab-14 in the training data. Assuming a Gaussian distribution, f( x ) can be computed using the mean and standard deviation of the prediction from the trained sequence-to-affinity model. For each scFv chain (Ab-14-H and Ab-14-L), we computed two fitness functions, extrapolated from the ensemble model and GP model, respectively. The proposed fitness function captures the model uncertainty during the optimization and enables us to estimate the performance of our antibody designs prior to experimental testing. Optimization strategies via sampling The goal is to sample scFv sequences with the highest extrapolated fitness value f( x ). The optimization was performed using 3 different sampling algorithms: a greedy algorithm called hill climb (HC) 34 , an evolutionary algorithm called genetic algorithm (GA) 35 and Gibbs sampling 36 . We initialized the HC and GA sampling processes using the 10 strongest binders (seed sequences) from the supervised training data and the Gibbs sampling using the strongest binders from the training data. For the hill climb algorithm, we initialized the optimization by randomly mutating a seed sequence with an expected number of k = 2 mutations. At each step, the algorithm performs a local search around the current sequence and samples the next sequence that has the highest fitness value. The search continues until it can no longer find a sequence that has a better fitness value than the current sequence. We defined the local search space to be the 1000 mutants of the current sequence, consisting of all the k = 1 mutations and random k = 2 mutations. The greedy-based hill climb was run 100 times with random restart around a random seed sequence. The genetic algorithm (GA) is an evolution-based search heuristic, where the fittest individuals are selected to produce offspring of the next generation. We initialized the population with a random seed sequence from the top 10 binders. Parents were chosen from the current population based on the Wright-Fisher model of evolution 37 where members of the current population become parents with a probability exponential to their fitness values, that is, p( x )~exp(f( x )/ β ). Sequences with high fitness have more chances to pass their genes to the next generation. A single-point crossover was performed on two parent sequences randomly selected from the parent population, and followed by randomly mutating individual child sequences with an expected k = 1 mutation. The algorithm was terminated when it no longer produced new sequences (the population converged). The algorithm was run 100 times; each was initialized from a random seed sequence. The parameter documentclass[12pt]{minimal} usepackage{amsmath} usepackage{wasysym} usepackage{amsfonts} usepackage{amssymb} usepackage{amsbsy} usepackage{mathrsfs} usepackage{upgreek} setlength{oddsidemargin}{-69pt} begin{document}$$beta$$end{document} β was set to be 0.2 for the ensemble-based fitness function and 0.5 for the GP-based fitness function. Note that the selection of parameter value documentclass[12pt]{minimal} usepackage{amsmath} usepackage{wasysym} usepackage{amsfonts} usepackage{amssymb} usepackage{amsbsy} usepackage{mathrsfs} usepackage{upgreek} setlength{oddsidemargin}{-69pt} begin{document}$$beta$$end{document} β directly affects the diversity of generated sequence designs. Depending on the design needs, one can tune this parameter to adjust the overall library diversity. Due to limited understanding of the extrapolation power of ML models at the time of sequence design, the documentclass[12pt]{minimal} usepackage{amsmath} usepackage{wasysym} usepackage{amsfonts} usepackage{amssymb} usepackage{amsbsy} usepackage{mathrsfs} usepackage{upgreek} setlength{oddsidemargin}{-69pt} begin{document}$$beta$$end{document} β parameter was manually selected around its default value used in FLEXS 38 . Future work in applying the proposed in silico performance metric (see the Result section) to explore the tradeoffs between library diversity and percent of success would facilitate the selection of the documentclass[12pt]{minimal} usepackage{amsmath} usepackage{wasysym} usepackage{amsfonts} usepackage{amssymb} usepackage{amsbsy} usepackage{mathrsfs} usepackage{upgreek} setlength{oddsidemargin}{-69pt} begin{document}$${{{{{rm{beta }}}}}}$$end{document} β parameter. Gibbs sampling is a Markov Chain Monte Carlo (MCMC) algorithm that samples a sequence according to some joint distribution by generating random variates from each of the full conditional distributions. We initialized the algorithm from the top seed sequence (the sequence with the strongest binding affinity in the training data). At each step, we randomly selected a position documentclass[12pt]{minimal} usepackage{amsmath} usepackage{wasysym} usepackage{amsfonts} usepackage{amssymb} usepackage{amsbsy} usepackage{mathrsfs} usepackage{upgreek} setlength{oddsidemargin}{-69pt} begin{document}$${{{{{rm{i}}}}}}$$end{document} i in the sequence, sampled a mutant documentclass[12pt]{minimal} usepackage{amsmath} usepackage{wasysym} usepackage{amsfonts} usepackage{amssymb} usepackage{amsbsy} usepackage{mathrsfs} usepackage{upgreek} setlength{oddsidemargin}{-69pt} begin{document}$$hat{{x}_{i}}$$end{document} x i ^ at the selected position with a conditional probability, 3 documentclass[12pt]{minimal} usepackage{amsmath} usepackage{wasysym} usepackage{amsfonts} usepackage{amssymb} usepackage{amsbsy} usepackage{mathrsfs} usepackage{upgreek} setlength{oddsidemargin}{-69pt} begin{document}$${{{{{rm{p}}}}}}({x}_{i}{{{{{rm{|}}}}}}{x}_{1},,ldots ,{x}_{i-1},,{x}_{i+1},,ldots ,{x}_{L}),$$end{document} p ( x i ∣ x 1 , … x i − 1 , x i + 1 , … x L ) , and updated the sequence by replacing the documentclass[12pt]{minimal} usepackage{amsmath} usepackage{wasysym} usepackage{amsfonts} usepackage{amssymb} usepackage{amsbsy} usepackage{mathrsfs} usepackage{upgreek} setlength{oddsidemargin}{-69pt} begin{document}$${{{{{{rm{i}}}}}}}^{{{{{{rm{th}}}}}}}$$end{document} i th token with the sampled token documentclass[12pt]{minimal} usepackage{amsmath} usepackage{wasysym} usepackage{amsfonts} usepackage{amssymb} usepackage{amsbsy} usepackage{mathrsfs} usepackage{upgreek} setlength{oddsidemargin}{-69pt} begin{document}$$hat{{x}_{i}}$$end{document} x i ^ . The conditional probability was defined to be exponential to the fitness values, that is, 4 documentclass[12pt]{minimal} usepackage{amsmath} usepackage{wasysym} usepackage{amsfonts} usepackage{amssymb} usepackage{amsbsy} usepackage{mathrsfs} usepackage{upgreek} setlength{oddsidemargin}{-69pt} begin{document}$${{{{{rm{p}}}}}}({x}_{i}{{{{{rm{|}}}}}}{x}_{1},,...,,{x}_{i-1},,{x}_{i+1},,...,,{x}_{L})sim {{exp }}(gamma*{{{{{rm{f}}}}}}({{{{{bf{x}}}}}})).$$end{document} p ( x i ∣ x 1 , . . . , x i − 1 , x i + 1 , . . . , x L ) ~ exp ( γ * f ( x ) ) . The Gibbs sampling was run once with 30,000 iterations. The value γ was set to be 18 for the Ab-14-H ensemble-based fitness function, and 20 for both the Ab-14-L ensemble- and GP-based fitness function. Multiple γ values were used to sample the Ab-14-H GP-based fitness function. This is due to the limited number of sequences that can be sampled at any specific γ value for the given fitness function. To ensure that enough sequences can be sampled, we used γ = 10, 3, 2, and ran the Gibbs algorithm three times to sample a sufficient number of sequences. ML-optimized ScFv libraries For each scFv chain (Ab-14-H variants and Ab-14-L variants), we constructed two fitness functions extrapolated from the ensemble and GP model, respectively. For each fitness function, we performed optimization using three sampling strategies. This resulted in 6 libraries per chain: 3 libraries from optimizing the ensemble-based fitness function (namely, En-HC, En-GA and En-Gibbs), and 3 libraries from optimizing the GP-based fitness function (namely, GP-HC, GP-GA, GP-Gibbs). We then rank-ordered the generated sequences based on their fitness score per library and selected the top 6000 sequences per library for experimental validation. Supplementary Figs. 3 and 4 show the distribution of the designed sequences with respect to various mutational distances to demonstrate the library diversity: (1) mutational distance to the candidate scFv Ab-14, and (2) pairwise mutational distance in a library. The first distance metric measures the number of mutations the designed antibodies are from Ab-14. The second distance metric measures the intra-library diversity. Evolution directed libraries We built two baseline libraries based on conventional directed evolution strategies: random mutations and the PSSM-based method. The random mutation library was constructed by randomly mutating amino acid tokens from the seed sequences in the training data with a k = 2 average number of mutations. Using this method, 2097 Ab-14-H heavy-chain variants and 477 Ab-14-L light-chain variants were generated for experimental testing. For the PSSM-based library, we used sequences in the training data with measured affinities that are as good or better than the candidate scFv Ab-14. We fitted the PSSM by counting the occurrence of each amino acid at each position in the CDRs with a small pseudocount. The fitted PSSM is a matrix of probability scores for each amino acid at each position, representing the statistical patterns of the training sequences that are better than Ab-14. We then drew samples to generate designs based on the fitted PSSM. Contrary to the random mutation approach, the PSSM-based approach is not restricted to a pre-defined mutational distance and could generate sequences that are potentially far from the candidate antibody if the computed PSSM allows. The PSSM method resulted in 7748 Ab-14-H heavy-chain variant designs and 8257 Ab-14-L light-chain variant designs that were sent for experimental testing. Supplementary Fig. 5c, f shows the distribution of the generated sequences with respect to the mutational distances.
Experimental validation of designed sequences
We used an engineered yeast mating assay to empirically measure the relative binding strength of our ML-designed sequences.
Yeast peptone dextrose
(YPD), yeast peptone galactose (YPG), and synthetic drop out (SDO) media supplemented with 80 mg/mL adenine were made according to standard protocols. Suppliers used for our yeast media are as follows: Bacto Yeast Extract (Life Technologies), Bacto Tryptone (Fisher BioReagents), Dextrose (Fisher Chemical), Galactose (Sigma-Aldrich), Adenine (ACROS Organics), Yeast Nitrogen Base w/o Amino Acids (Thermo Scientific), SC-His-Leu-Lys-Trp-Ura Powder (Sunrise Science Products), Yeast Synthetic Drop-out Medium Supplements (Sigma-Aldrich), L-Histidine (Fisher BioReagents), L-Tryptophan (Fisher BioReagents), L-Leucine (Fisher BioReagents), Uracil (ACROS Organics), and Bacto Agar (Fisher BioReagents). AlphaSeq compatible plasmids encoding yeast surface display cassettes were constructed by Twist Bioscience and resuspended at 100 ng/µL in molecular grade water (Corning). 100 ng of plasmid was digested with PmeI enzyme (NEB) for 1 hr at 37 °C to linearize, leaving chromosomal homology for integration into the ARS314 locus at both the 5’ and 3’ ends 39 . Yeast transformations were performed with Frozen-EZ Yeast Transformation Kit II (Zymo Research) according to manufactures instructions. Yeast were plated on SDO-Trp plates and grown at 30 °C for 2-3 days. Successful transformants were struck out onto YPAD plates and grown overnight at 30 °C. To validate protein expression, yeast were inoculated in YPAD and grown overnight at 30 °C. Yeast were labelled with FITC-anti-C-myc antibody (Immunology Consultants Laboratory, Inc.) in PBS (Gibco) + 0.2% BSA (Thermo Fisher Scientific) for 30 minutes at RT. Yeast were pelleted and resuspended in PBS + 0.2% BSA and read on a LSRII cytometer. To construct the DNA library, a 300 bp oligonucleotide pool synthesized by Twist Bioscience was resuspended at 20 ng/µL in molecular grade water (Corning). Libraries were PCR amplified from the oligonucleotide pool using KAPA DNA polymerase (Roche). The oligonucleotide amplification fragment was inserted into the seed scFv backbone using Gibson isothermal assembly (NEB), as well as a second DNA fragment containing a randomized DNA barcode. The assembled barcoded antibody DNA library was PCR amplified. Fragments were run on a 0.8% agarose gel and extracted using Monarch Gel Purification kit (NEB). For the yeast library transformation, MATa AlphaSeq yeast were grown for 16 hours in YPAG media to induce SceI expression 39 . All spin steps were performed at 3000 RPM for 5 minutes. Yeast were spun down and washed once in 50 mL 1 M Sorbitol (Teknova) + 1 mM CaCl 2 (Sigma-Aldrich) solution. Washed yeast were resuspended in a solution of 0.1 M LiOAc (ACROS Organics)/1 mM DTT (Roche) and incubated shaking at 30 °C for 30 minutes. After 30 minutes, yeast were spun down and washed once in 50 mL 1 M Sorbitol + 1 mM CaCl 2 solution. Yeast were resuspended to a final volume of 400 µL in 1 M Sorbitol + 1 mM CaCl 2 solution and incubated with DNA for at least 5 minutes on ice. Yeast were electroporated at 2.5 kV and 25 uF (BioRad). Immediately following electroporation, yeast were resuspended in 5 mL of 1:1 solution of 1 M Sorbitol:YPAD and incubated shaking at 30 °C for 30 minutes. Recovered yeast cells were spun down and resuspended in 50 mL of SDO-Trp media and transferred to a 250 mL baffled flask. 20 µL of resuspended cells were plated on SDO-Trp to determine transformation efficiency. Both the flask and plate were incubated at 30 °C for 2-3 days. After 2-3 days, transformation efficiency was determined by counting colonies on the SDO-Trp plate. For nanopore barcode mapping, genomic DNA from yeast libraries was extracted using Yeast DNA Extraction Kit (Thermo Fisher Scientific) following the manufacturer’s instructions. A single round of qPCR was performed to amplify a fragment pool from the genomic DNA containing the gene through the associated DNA barcode. qPCR was terminated before saturation to minimize PCR bias, generally between 15-20 cycles. The final amplified fragment was concentrated with KAPA beads (Roche), quantified with a Quantus (Promega), prepped with an SQK-LSK-110 ligation kit (Oxford Nanopore) and sequenced with a Minion R10 flow cell (Oxford Nanopore) following the manufacturer’s instructions. Each sequencing read was aligned to the set of expected antibody sequences from the in silico antibody library using minimap2 40 to determine the mapping between DNA barcodes and antibody sequence; only DNA barcodes with at least 2 reads observed were considered, and each DNA barcode was matched to the most common minimap2 antibody match among its constituent reads. Library-on-library AlphaSeq assays were performed. Two mL of saturated MATa and MATalpha library were combined in 800 mL of YPAD media and incubated at 30 °C in a shaking incubator. Six technical replicates were performed. After 16 hr, 100 mL of yeast culture was washed once in 50 mL of sterile molecular grade water (Corning) and transferred to 600 mL of SDO-lys-leu with 100 nM ß-estradiol (Sigma-Aldrich) for 24 hr. After 24 hr, 100 mL of yeast was transferred to fresh SDO-lys-leu with 100 nM ß-estradiol for an additional 24 hr. In addition to the antibody libraries described above, control yeast strains comprising a small network of BCL2-family proteins 39 were included in each experiment to act as a set of standards for which BLI-derived interaction affinities were known a priori. To prepare the library for next-generation sequencing, genomic DNA was extracted using Yeast DNA Extraction Kit (Thermo Fisher Scientific) following manufacturer’s instructions. qPCR was performed to amplify a fragment pool from the genomic DNA and to add standard Illumina sequencing adaptors and assay specific index barcodes. qPCR was terminated before saturation to minimize PCR bias, generally between 23-27 cycles. The final amplified fragment was concentrated with KAPA beads (Roche), quantified with a Quantus (Promega), and sequenced with a NextSeq 500 sequencer (Illumina). Sequencing data were analyzed to identify the MATa and MATalpha barcode pairs present among diploid yeast. The observed number of sequencing reads for each MATa/MATalpha combination were normalized according to frequency among haploid yeast to account for uneven distribution of the input populations. Each aα pair was then assigned a score representing the ratio of observed sequencing reads to expected sequencing reads assuming random mating. A linear regression was performed comparing these normalized sequencing scores to known affinities for the control yeast strains and this regression was utilized to assign estimated affinities to all other aα pairs for each mating replicate. Supplementary Tables 4 and 5 summarize the number and percentage of sequences present in the experimental data for Ab-14-H and Ab-14-L designs, respectively. All generated data with experimental affinity measurements are made publicly available for research use 26 . To use the experimentally collected affinity data for evaluating the performance of designed scFv sequences, we only consider designs that are present in the experimental data. For sequences that are present in the affinity data and have at least three out of six empirical affinity values, the values are averaged and used as ground-truth measured affinities. Sequences with two or fewer empirical measurements are considered poor binders, and are included in the performance evaluation as un-successful designs. T-SNE Embedding T-Distributed Stochastic Neighbor Embedding (t-SNE) 41 is used to visualize high-dimensional scFv sequences while approximately preserving the edit distance between sequences. Specifically, we first encode all scFv sequences using a one-hot encoder; for any pair of one-hot encoded scFv sequences, the L1-norm between them equals the edit distance. Then we apply the t-SNE dimensionality reduction to project one-hot encoded sequences into a 2-D space as shown in Fig. 3 . Python scikit-learn package 42 was used to perform t-SNE with the L1-norm and PCA initialization 43 . For Ab-14-H variants, the perplexity and learning rate are set to be 500 and 200, respectively. For Ab-14-L variants, the perplexity and learning rate are set to be 500 and 500, respectively. Biophysical property calculation, statistical analysis of libraries For the biophysical property analysis of designed libraries, we computed isoelectric points and hydrophobicity, which are physicochemical descriptors known to influence the solution behavior of antibodies. These properties were calculated based on the sequences of the heavy and light chain variants in each library using BioPython 30 . Specifically, for the heavy chain, we concatenated each heavy-chain design with the fixed light-chain sequence; for the light chain, we concatenated the fixed heavy-chain sequence with each light-chain design. Isoelectric points were calculated using pK values 44 – 46 . Hydrophobicity was calculated using the Kyte & Doolittle index 47 . The hydrophobicity score of each amino acid was averaged over the sequence of each variant to give an overall hydrophobicity score for each sequence. Supplementary Fig. 11 shows the distribution of isoelectric and hydrophobicity.
Statistics and reproducibility
All statistical calculations were performed within the computation environment Python (v3.8). No statistical method was used to determine the training data size and the size of designed sequences for each library. The training data size was chosen as the maximum number of sequences our budget for experimental measurements allowed for, while being statistically sufficient for analysis and machine learning models. The number of designed sequences for each library was chosen to be 6000, which is statistically sufficient for analysis and method comparison. All designed sequences and controls were tested. Sequences that were unsuccessfully mapped in the haploid step (thus no binding measurement is available) were excluded from the analysis. The random library generation was randomized at k = 1,2 or 3. The PSSM-based sequences were randomly sampled based on the PSSM statistics. The empirical validation was conducted blindly by individuals lacking knowledge of which method generated a given design. Language model-based scFv feature representations, sequence-to-affinity models and fitness landscapes were reproducible. Reporting summary Further information on research design is available in the Nature Portfolio Reporting Summary linked to this article.
Experimental validation of designed sequences
We used an engineered yeast mating assay to empirically measure the relative binding strength of our ML-designed sequences.
Yeast peptone dextrose
(YPD), yeast peptone galactose (YPG), and synthetic drop out (SDO) media supplemented with 80 mg/mL adenine were made according to standard protocols. Suppliers used for our yeast media are as follows: Bacto Yeast Extract (Life Technologies), Bacto Tryptone (Fisher BioReagents), Dextrose (Fisher Chemical), Galactose (Sigma-Aldrich), Adenine (ACROS Organics), Yeast Nitrogen Base w/o Amino Acids (Thermo Scientific), SC-His-Leu-Lys-Trp-Ura Powder (Sunrise Science Products), Yeast Synthetic Drop-out Medium Supplements (Sigma-Aldrich), L-Histidine (Fisher BioReagents), L-Tryptophan (Fisher BioReagents), L-Leucine (Fisher BioReagents), Uracil (ACROS Organics), and Bacto Agar (Fisher BioReagents). AlphaSeq compatible plasmids encoding yeast surface display cassettes were constructed by Twist Bioscience and resuspended at 100 ng/µL in molecular grade water (Corning). 100 ng of plasmid was digested with PmeI enzyme (NEB) for 1 hr at 37 °C to linearize, leaving chromosomal homology for integration into the ARS314 locus at both the 5’ and 3’ ends 39 . Yeast transformations were performed with Frozen-EZ Yeast Transformation Kit II (Zymo Research) according to manufactures instructions. Yeast were plated on SDO-Trp plates and grown at 30 °C for 2-3 days. Successful transformants were struck out onto YPAD plates and grown overnight at 30 °C. To validate protein expression, yeast were inoculated in YPAD and grown overnight at 30 °C. Yeast were labelled with FITC-anti-C-myc antibody (Immunology Consultants Laboratory, Inc.) in PBS (Gibco) + 0.2% BSA (Thermo Fisher Scientific) for 30 minutes at RT. Yeast were pelleted and resuspended in PBS + 0.2% BSA and read on a LSRII cytometer. To construct the DNA library, a 300 bp oligonucleotide pool synthesized by Twist Bioscience was resuspended at 20 ng/µL in molecular grade water (Corning). Libraries were PCR amplified from the oligonucleotide pool using KAPA DNA polymerase (Roche). The oligonucleotide amplification fragment was inserted into the seed scFv backbone using Gibson isothermal assembly (NEB), as well as a second DNA fragment containing a randomized DNA barcode. The assembled barcoded antibody DNA library was PCR amplified. Fragments were run on a 0.8% agarose gel and extracted using Monarch Gel Purification kit (NEB). For the yeast library transformation, MATa AlphaSeq yeast were grown for 16 hours in YPAG media to induce SceI expression 39 . All spin steps were performed at 3000 RPM for 5 minutes. Yeast were spun down and washed once in 50 mL 1 M Sorbitol (Teknova) + 1 mM CaCl 2 (Sigma-Aldrich) solution. Washed yeast were resuspended in a solution of 0.1 M LiOAc (ACROS Organics)/1 mM DTT (Roche) and incubated shaking at 30 °C for 30 minutes. After 30 minutes, yeast were spun down and washed once in 50 mL 1 M Sorbitol + 1 mM CaCl 2 solution. Yeast were resuspended to a final volume of 400 µL in 1 M Sorbitol + 1 mM CaCl 2 solution and incubated with DNA for at least 5 minutes on ice. Yeast were electroporated at 2.5 kV and 25 uF (BioRad). Immediately following electroporation, yeast were resuspended in 5 mL of 1:1 solution of 1 M Sorbitol:YPAD and incubated shaking at 30 °C for 30 minutes. Recovered yeast cells were spun down and resuspended in 50 mL of SDO-Trp media and transferred to a 250 mL baffled flask. 20 µL of resuspended cells were plated on SDO-Trp to determine transformation efficiency. Both the flask and plate were incubated at 30 °C for 2-3 days. After 2-3 days, transformation efficiency was determined by counting colonies on the SDO-Trp plate. For nanopore barcode mapping, genomic DNA from yeast libraries was extracted using Yeast DNA Extraction Kit (Thermo Fisher Scientific) following the manufacturer’s instructions. A single round of qPCR was performed to amplify a fragment pool from the genomic DNA containing the gene through the associated DNA barcode. qPCR was terminated before saturation to minimize PCR bias, generally between 15-20 cycles. The final amplified fragment was concentrated with KAPA beads (Roche), quantified with a Quantus (Promega), prepped with an SQK-LSK-110 ligation kit (Oxford Nanopore) and sequenced with a Minion R10 flow cell (Oxford Nanopore) following the manufacturer’s instructions. Each sequencing read was aligned to the set of expected antibody sequences from the in silico antibody library using minimap2 40 to determine the mapping between DNA barcodes and antibody sequence; only DNA barcodes with at least 2 reads observed were considered, and each DNA barcode was matched to the most common minimap2 antibody match among its constituent reads. Library-on-library AlphaSeq assays were performed. Two mL of saturated MATa and MATalpha library were combined in 800 mL of YPAD media and incubated at 30 °C in a shaking incubator. Six technical replicates were performed. After 16 hr, 100 mL of yeast culture was washed once in 50 mL of sterile molecular grade water (Corning) and transferred to 600 mL of SDO-lys-leu with 100 nM ß-estradiol (Sigma-Aldrich) for 24 hr. After 24 hr, 100 mL of yeast was transferred to fresh SDO-lys-leu with 100 nM ß-estradiol for an additional 24 hr. In addition to the antibody libraries described above, control yeast strains comprising a small network of BCL2-family proteins 39 were included in each experiment to act as a set of standards for which BLI-derived interaction affinities were known a priori. To prepare the library for next-generation sequencing, genomic DNA was extracted using Yeast DNA Extraction Kit (Thermo Fisher Scientific) following manufacturer’s instructions. qPCR was performed to amplify a fragment pool from the genomic DNA and to add standard Illumina sequencing adaptors and assay specific index barcodes. qPCR was terminated before saturation to minimize PCR bias, generally between 23-27 cycles. The final amplified fragment was concentrated with KAPA beads (Roche), quantified with a Quantus (Promega), and sequenced with a NextSeq 500 sequencer (Illumina). Sequencing data were analyzed to identify the MATa and MATalpha barcode pairs present among diploid yeast. The observed number of sequencing reads for each MATa/MATalpha combination were normalized according to frequency among haploid yeast to account for uneven distribution of the input populations. Each aα pair was then assigned a score representing the ratio of observed sequencing reads to expected sequencing reads assuming random mating. A linear regression was performed comparing these normalized sequencing scores to known affinities for the control yeast strains and this regression was utilized to assign estimated affinities to all other aα pairs for each mating replicate. Supplementary Tables 4 and 5 summarize the number and percentage of sequences present in the experimental data for Ab-14-H and Ab-14-L designs, respectively. All generated data with experimental affinity measurements are made publicly available for research use 26 . To use the experimentally collected affinity data for evaluating the performance of designed scFv sequences, we only consider designs that are present in the experimental data. For sequences that are present in the affinity data and have at least three out of six empirical affinity values, the values are averaged and used as ground-truth measured affinities. Sequences with two or fewer empirical measurements are considered poor binders, and are included in the performance evaluation as un-successful designs.
Supplementary information Supplementary Information Peer Review File Reporting Summary
📊 Figures
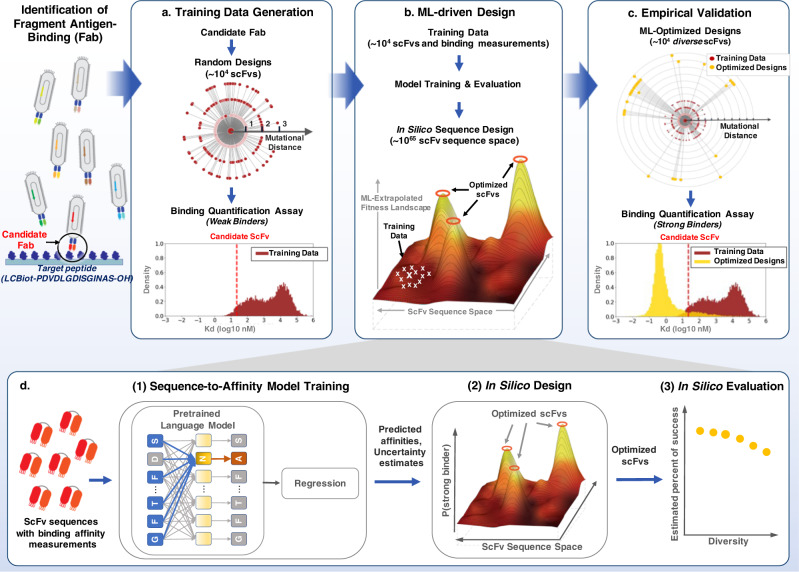
Fig. 1
Illustration of the end-to-end ML-driven scFv design process.
The end-to-end process consists of three components: training data generation, ML-driven design to generate scFv libraries and empirical validation of designed libraries, providing a pool of potential...
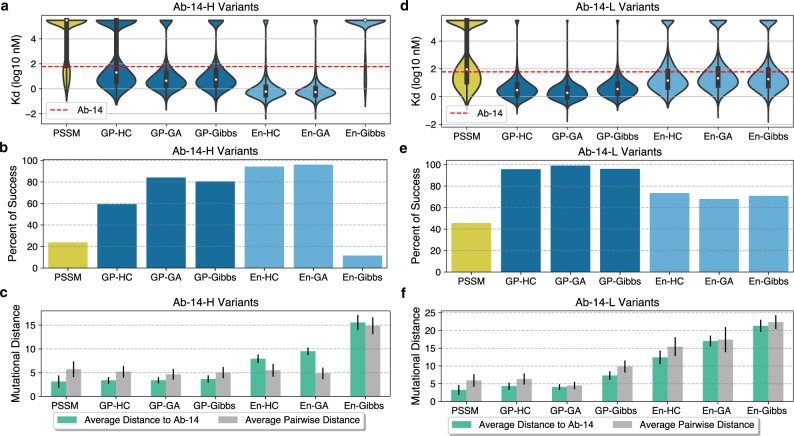
Fig. 2
ML-optimized scFv libraries outperform the PSSM directed evolution approach with high percentage of success and high diversity.
For sequences with at least 3 (out of 6) empirical binding affinities, averaged values are used as the ground-truth. The rest of the sequences (with less than 3 empirical measurements) are considered ...
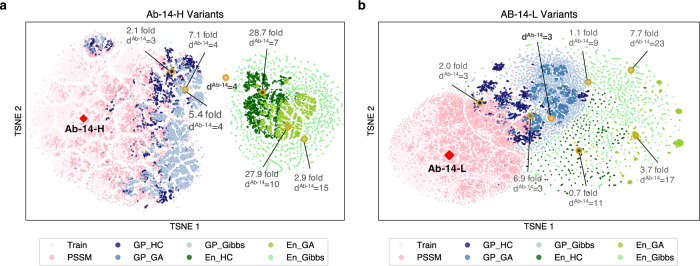
Fig. 3
T-SNE sequence embedding of ML-libraries, PSSM library and the training data reveals distinct sampled sequence subspaces.
The t-SNE embeddings allow visualization of the sequence space by embedding sequences onto 2-D space, while approximately preserving the edit distance between sequences. GP and En denote Gaussian Proc...
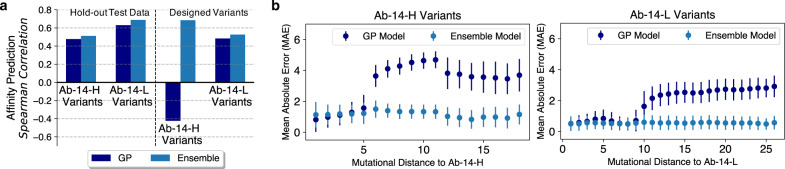
Fig. 4
Sequence-to-affinity model evaluation.
All evaluations were performed on sequences with at least 3 (out of 6) empirical binding affinities and the averaged values are used as the ground-truth. GP denotes Gaussian Process. a Regression perf...
Figure images are served from the NIH/NLM PubMed Central Open Access Subset or Europe PMC; copyright remains with the publishers and authors.
💬 Discussion
0 commentsNo comments yet. Be the first to start a discussion!
Leave a Comment