Abstract
The temperature-sensitive luminescence of nanoparticles enables their application as remote thermometers. The size of these nanothermometers makes them ideal to map temperatures with a high spatial resolution. However, high spatial resolution mapping of temperatures >373 K has remained challenging. Here, we realize nanothermometry with high spatial resolutions at elevated temperatures using chemically stable upconversion nanoparticles and confocal microscopy. We test this method on a microelectromechanical heater and study the temperature homogeneity. Our experiments reveal distortions in the luminescence spectra that are intrinsic to high-resolution measurements of samples with nanoscale photonic inhomogeneities. In particular, the spectra are affected by the high-power excitation as well as by scattering and reflection of the emitted light. The latter effect has an increasing impact at elevated temperatures. We present a procedure to correct these distortions. As a result, we extend the range of high-resolution nanothermometry beyond 500 K with a precision of 1-4 K. This work will improve the accuracy of nanothermometry not only in micro- and nanoelectronics but also in other fields with photonically inhomogeneous substrates.
🔬 Techniques
🏭 Microscope Brands
📷 Detectors
🏛️ Research Organizations (ROR)
Affiliated research institutions:
📋 Methods
Sample Preparation
The synthesis procedure reported in the work of Geitenbeek et al. was used to obtain multiple batches of NaYF 4 :Er 3+ (2%),Yb 3+ (18%) nanoparticles dispersed in cyclohexane. 17 Deposition of the nanoparticles was achieved by drop casting on a microheater (Wildfire Nano-Chips, commercially available from DENSsolutions). The thickness of the dried nanoparticle layer (a few μm) was estimated using the concentration of the nanoparticle dispersion. Microcrystalline NaYF 4 :Er 3+ (2%),Yb 3+ (18%) samples were obtained following the procedure of Krämer et al. 22 Characterization The particle size and morphology were investigated using an FEI Tecnai 12 transmission electron microscope operating at 120 keV. Samples were prepared by drying the diluted nanoparticle dispersion onto carbon-coated copper grids. The luminescence of the dried nanoparticle layer was mapped using a Nikon TE2000-S inverted microscope fitted with a C1si confocal scanner. 23 A 980 nm laser diode was connected to the confocal scanner head using a single-mode fiber. The laser light was reflected using a 680 nm shortpass dichroic mirror and focused on the nanoparticle layer using a 10× CFI Plan Fluor (NA = 0.3) air objective or a 40× CFI S Plan Fluor ELWD (NA = 0.6) air objective. The luminescence was directed back to the confocal scanner head by the same objective, passed through the dichroic mirror, coupled into a 50 μm multimode fiber, passed through a 680 nm shortpass filter, dispersed by an equilateral SF10 glass prism (Linos), and finally detected using a back-illuminated CCD (Princeton Instruments, NTE/CCD-1340). All maps were obtained with a pixel dwell time of 100 ms. For the calibration of the luminescence, powders of dried nanoparticles were heated with a Linkam THMS600 microscope stage. Selective excitation of the microcrystalline NaYF 4 :Er 3+ (2%),Yb 3+ (18%) sample with 404 and 448 nm light was carried out using an Edinburgh Instruments FLS920 spectrofluorometer equipped with TMS300 monochromators, a R928 photomultiplier tube, and a Xe lamp (450 W). The reflection measurements were performed on a Nikon Ti-U inverted microscope. The microheater was illuminated in wide field with a broad-spectrum LED (Lumencor Sola) by a 40× Nikon CFI Plan Fluor (NA = 0.75) air objective. The reflected light was collected by the same objective and collimated outside of the microscope using a relay lens system. The light was focused on a mechanical slit at the entrance of an Andor Kymera 193i spectrometer and dispersed with a 150 lines/mm grating on an Andor iXon EMCCD.
Show full methods section
Sample Preparation
The synthesis procedure reported in the work of Geitenbeek et al. was used to obtain multiple batches of NaYF 4 :Er 3+ (2%),Yb 3+ (18%) nanoparticles dispersed in cyclohexane. 17 Deposition of the nanoparticles was achieved by drop casting on a microheater (Wildfire Nano-Chips, commercially available from DENSsolutions). The thickness of the dried nanoparticle layer (a few μm) was estimated using the concentration of the nanoparticle dispersion. Microcrystalline NaYF 4 :Er 3+ (2%),Yb 3+ (18%) samples were obtained following the procedure of Krämer et al. 22 Characterization The particle size and morphology were investigated using an FEI Tecnai 12 transmission electron microscope operating at 120 keV. Samples were prepared by drying the diluted nanoparticle dispersion onto carbon-coated copper grids. The luminescence of the dried nanoparticle layer was mapped using a Nikon TE2000-S inverted microscope fitted with a C1si confocal scanner. 23 A 980 nm laser diode was connected to the confocal scanner head using a single-mode fiber. The laser light was reflected using a 680 nm shortpass dichroic mirror and focused on the nanoparticle layer using a 10× CFI Plan Fluor (NA = 0.3) air objective or a 40× CFI S Plan Fluor ELWD (NA = 0.6) air objective. The luminescence was directed back to the confocal scanner head by the same objective, passed through the dichroic mirror, coupled into a 50 μm multimode fiber, passed through a 680 nm shortpass filter, dispersed by an equilateral SF10 glass prism (Linos), and finally detected using a back-illuminated CCD (Princeton Instruments, NTE/CCD-1340). All maps were obtained with a pixel dwell time of 100 ms. For the calibration of the luminescence, powders of dried nanoparticles were heated with a Linkam THMS600 microscope stage. Selective excitation of the microcrystalline NaYF 4 :Er 3+ (2%),Yb 3+ (18%) sample with 404 and 448 nm light was carried out using an Edinburgh Instruments FLS920 spectrofluorometer equipped with TMS300 monochromators, a R928 photomultiplier tube, and a Xe lamp (450 W). The reflection measurements were performed on a Nikon Ti-U inverted microscope. The microheater was illuminated in wide field with a broad-spectrum LED (Lumencor Sola) by a 40× Nikon CFI Plan Fluor (NA = 0.75) air objective. The reflected light was collected by the same objective and collimated outside of the microscope using a relay lens system. The light was focused on a mechanical slit at the entrance of an Andor Kymera 193i spectrometer and dispersed with a 150 lines/mm grating on an Andor iXon EMCCD.
Simulation
Finite element simulations were carried out using COMSOL Multiphysics. The electric currents and heat transfer modules were two-way coupled to include the temperature-dependent resistivity. The model assumes a vacuum environment. Convective heat transfer through air is not taken into account, but radiation is included. The validity of the model was shown in our previous work. 24
Supplementary Material an1c00657_si_001.pdf
📊 Figures
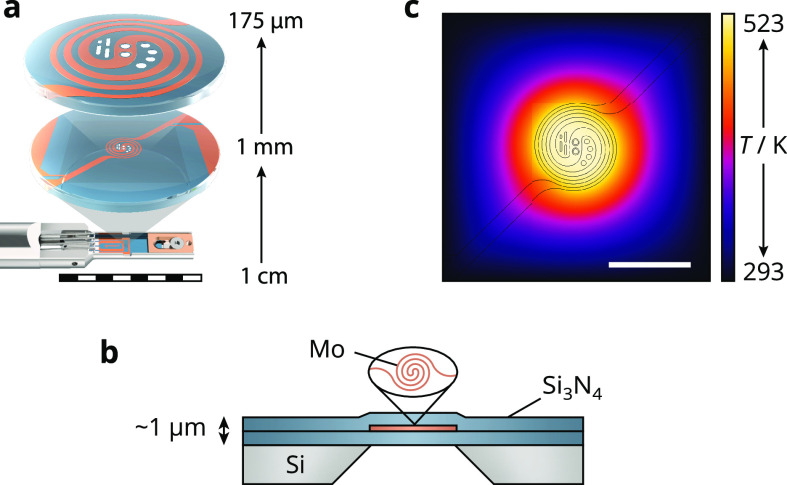
Figure 1
A microheater for an in situ TEM experiment.n(a) Magnificationnof the microheater design. The metal heating spiral (orange) is embeddednin a silicon nitride membrane (blue). Electron microscopy users ...
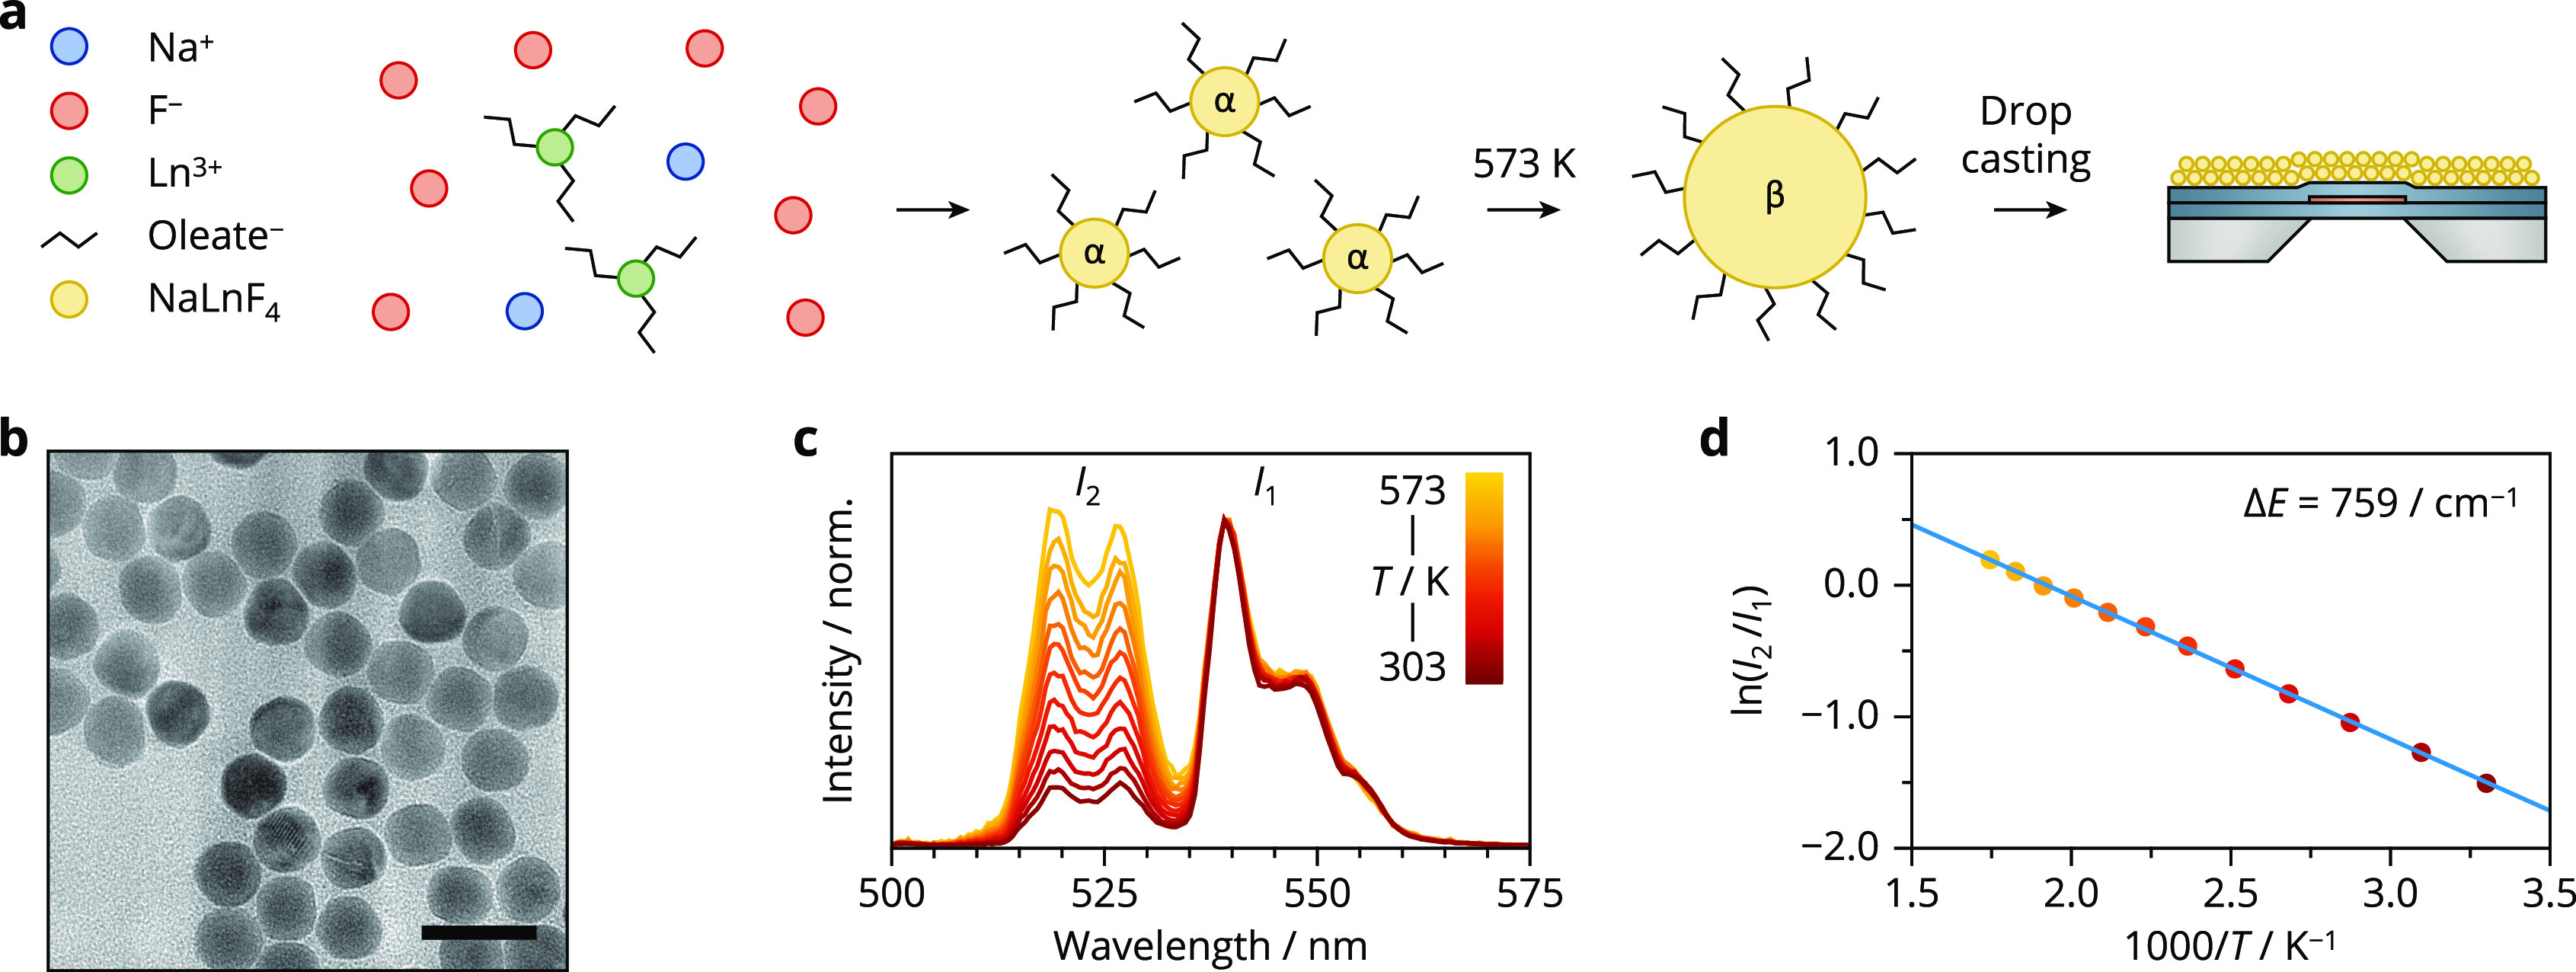
Figure 2
Upconversion nanoparticles: their fabricationnand luminescence.n(a) Schematic of the two-step synthesis of the nanoparticlesu2014smallncubic u03b1-NaLnF 4 (Ln 3+ = Y 3+ ,nEr 3+ , or Yb 3+ ) particles ...
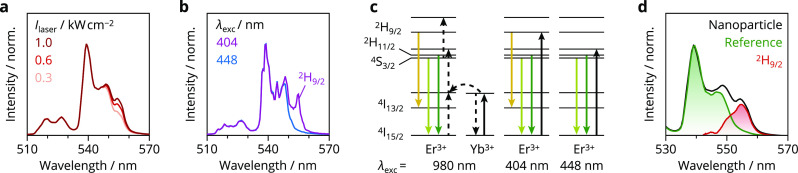
Figure 3
Multiphoton upconversion. (a) Green upconversion luminescence ofnthe nanoparticles at different excitation intensities of the 980 nmnlaser. (b) Emission spectra of a microcrystalline NaYF 4 :Er 3+ (2%...
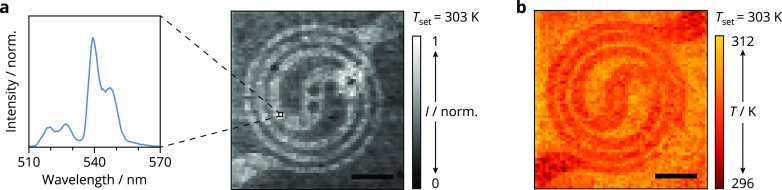
Figure 4
Temperature mapping.n(a) Map of the integrated green luminescencenfrom a microheater coated with upconversion nanoparticles at a setntemperature of 303 K measured in an ambient atmosphere. The intensi...
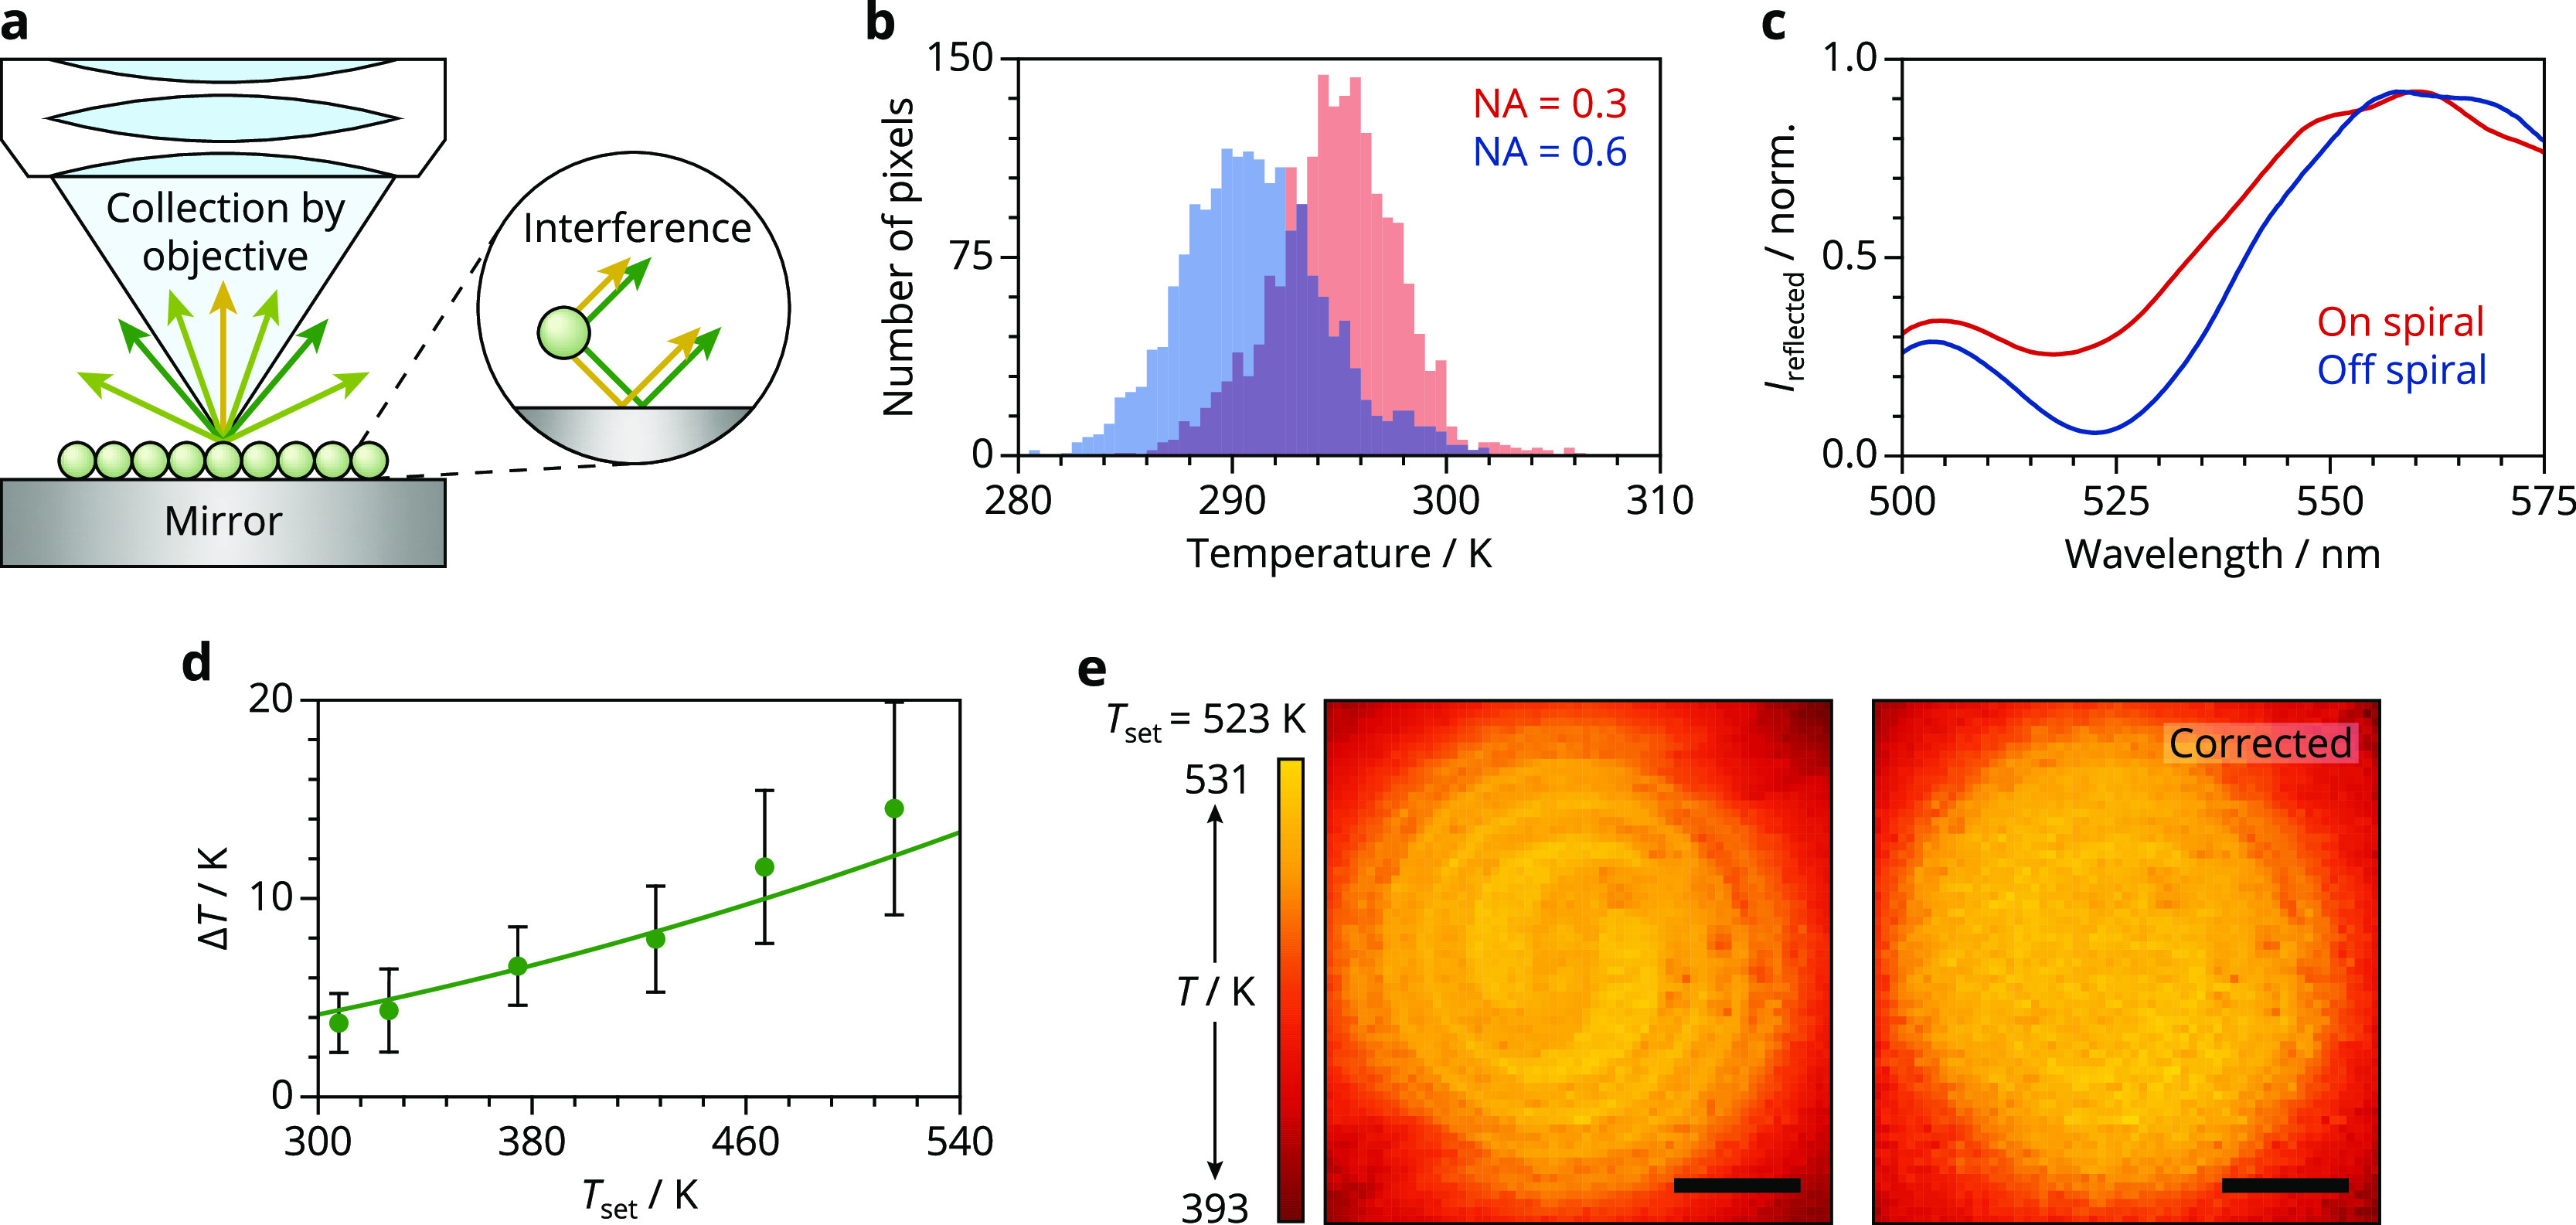
Figure 5
Artifactsnin luminescence thermometry on the microscopic scale.n(a) Schematic of Er 3 + -doped nanoparticlesnon a mirror. Interference of the direct and the reflected 2 H 11/2 (green) and 4 S 3/2 (yel...
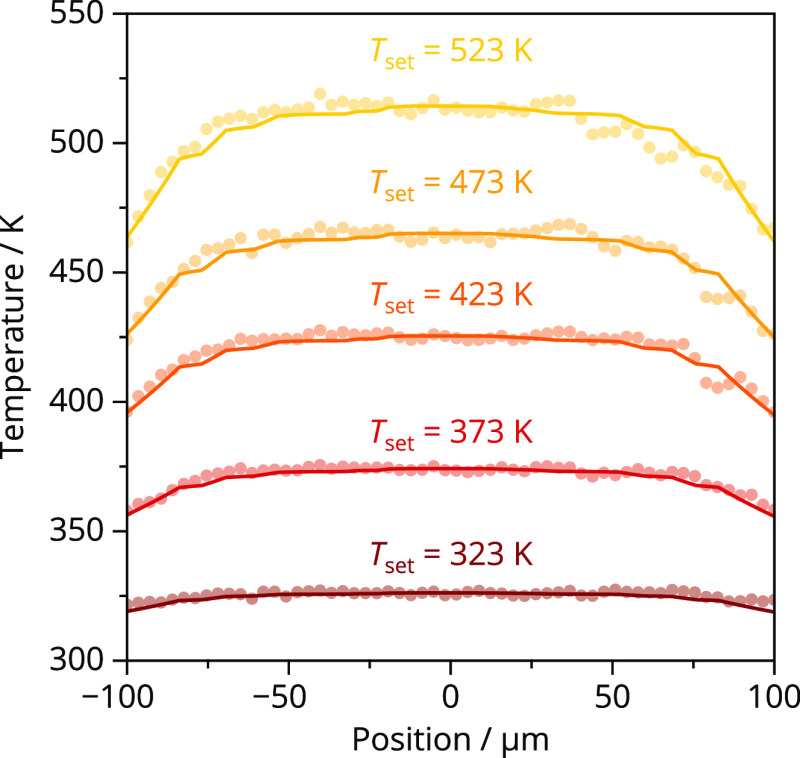
Figure 6
Mapping elevated temperatures. The dots show the average of sevennhorizontal line traces through the center of the temperature mapsnat elevated temperatures. The lines represent the temperature profil...
Figure images are served from the NIH/NLM PubMed Central Open Access Subset or Europe PMC; copyright remains with the publishers and authors.
💬 Discussion
0 commentsNo comments yet. Be the first to start a discussion!
Leave a Comment