Abstract
Abstract Bacterial cells are surrounded by a polymer known as peptidoglycan (PG), which protects the cell from changes in osmotic pressure and small molecule insults. A component of this material, N -acetyl-muramic acid (NAM), serves as a core structural element for innate immune recognition of PG fragments. We report the synthesis of modifiable NAM carbohydrate derivatives and the installation of these building blocks into the backbone of Gram-positive and Gram-negative bacterial PG utilizing metabolic cell wall recycling and biosynthetic machineries. Whole cells are labelled via click chemistry and visualized using super-resolution microscopy, revealing higher resolution PG structural details and allowing the cell wall biosynthesis, as well as its destruction in immune cells, to be tracked. This study will assist in the future identification of mechanisms that the immune system uses to recognize bacteria, glean information about fundamental cell wall architecture and aid in the design of novel antibiotics.
🔬 Techniques
🔭 Microscopes
🧬 Organisms
💻 Software
✨ Fluorophores
🧪 Sample Preparation
🔬 Cell Lines
🏭 Microscope Brands
🧪 Reagent Suppliers
💻 Software Details
💾 Data Repositories
🏛️ Research Organizations (ROR)
Affiliated research institutions:
📋 Methods
Note For synthetic procedures, please see Supplementary Methods .
Bacteria strains and plasmids
E. coli DH5α and BL21 (DE3) strains were from the laboratory stock. E. coli murQ knockout stain was obtained from the Coli Genetic Stock Center, CGSC (number 9928). MurQ gene was replaced with the kanamycin resistant gene 61 . E. coli strains were grown in liquid or solid Luria broth (LB) medium, supplemented with appropriate antibiotics: carbenicillin (100 μg ml −1 ), kanamycin (50 μg ml −1 ) or chloramphenicol (34 μg ml −1 ). P. putida strain KT2440 was purchased from ATCC (ATCC number 47054). P. putida was grown in LB medium or M9 minimal medium with NAM (0.2% w/v) as the carbon source. B. subtilis 3A38, a single point mutant of wild type B. subtilis strain 168, which has increased competence 62 , was obtained from Bacillus Genetic Stock Center. This cell strain was cultured in liquid or solid LB medium. Plasmid pGEX-6P-1, which contains a glutathione S -transferase (GST) affinity tag gene, was used in protein expression and purification. Plasmid pBBR1MCS was used for exogenous genes expression in E. coli strains. Plasmid pDG1662 was used to integrate the cloned gene cluster into B. subtilis 3A38 chromosome at the amyE locus, by a double-crossover recombination. Supplementary Information Table 2 shows a complete list of bacterial strains and plasmids used in this study. J774 macrophage cells were purchased from ATCC (catalogue number TIB-67), grown in DMEM supplemented with 10% heat-inactivated fetal bovine serum (Atlantic Biological) and 0.1% penicillin–streptomycin (Sigma-Aldrich) (unless otherwise noted) and routinely tested for mycoplasma (MycoAlert PLUS Mycoplasma Detection Kit, Lonza).
Show full methods section
Note For synthetic procedures, please see Supplementary Methods .
Bacteria strains and plasmids
E. coli DH5α and BL21 (DE3) strains were from the laboratory stock. E. coli murQ knockout stain was obtained from the Coli Genetic Stock Center, CGSC (number 9928). MurQ gene was replaced with the kanamycin resistant gene 61 . E. coli strains were grown in liquid or solid Luria broth (LB) medium, supplemented with appropriate antibiotics: carbenicillin (100 μg ml −1 ), kanamycin (50 μg ml −1 ) or chloramphenicol (34 μg ml −1 ). P. putida strain KT2440 was purchased from ATCC (ATCC number 47054). P. putida was grown in LB medium or M9 minimal medium with NAM (0.2% w/v) as the carbon source. B. subtilis 3A38, a single point mutant of wild type B. subtilis strain 168, which has increased competence 62 , was obtained from Bacillus Genetic Stock Center. This cell strain was cultured in liquid or solid LB medium. Plasmid pGEX-6P-1, which contains a glutathione S -transferase (GST) affinity tag gene, was used in protein expression and purification. Plasmid pBBR1MCS was used for exogenous genes expression in E. coli strains. Plasmid pDG1662 was used to integrate the cloned gene cluster into B. subtilis 3A38 chromosome at the amyE locus, by a double-crossover recombination. Supplementary Information Table 2 shows a complete list of bacterial strains and plasmids used in this study. J774 macrophage cells were purchased from ATCC (catalogue number TIB-67), grown in DMEM supplemented with 10% heat-inactivated fetal bovine serum (Atlantic Biological) and 0.1% penicillin–streptomycin (Sigma-Aldrich) (unless otherwise noted) and routinely tested for mycoplasma (MycoAlert PLUS Mycoplasma Detection Kit, Lonza).
Construction of expression plasmids and bacterial strains Full-length
P. putida amgK and murU were PCR amplified from P. putida genome DNA with 5′-BamHI and 3′-XhoI restriction sites (primer sets are PpAmgK-For/PpAmgK-Rev and PpMurU-For/PpMurU-Rev, respectively). PCR products of amgK and murU were subsequently ligated into pGEX-6P-1 vector to generate pGEX-PpAmgK plasmids and pGEX-PpMurU plasmids. E. coli murC , murD , murE and murF were PCR amplified from E. coli genome DNA. E. coli murC was inserted into pGEX-6P-1 vector with 5′-SalI and 3′-NotI restriction sites to generate pGEX-EcMurC plasmid (primer set is EcMurC-For/EcMurC-Rev). M urD and murE were inserted into pGEX-6P-1 with 5′-EcoRI and 3′-XhoI sites to get pGEX-EcMurD and pGEX-EcMurE plasmids (primer sets are EcMurD-For/EcMurD-Rev, EcMurE-For/EcMurE-Rev, respectively). MurF was inserted into the same vector using 5′-BamHI and 3′-XhoI sites to get pGEX-EcMurF vector (primers are EcMurF-For/EcMurF-Rev). Exogenous AmgK and MurU expression plasmid pBBR-KU was constructed from pBBR1MCS vector, using the PCR product of amgK and murU cluster, and the 5′-KpnI and 3′-HindIII restriction sites (primer set: pBBRKU-For/pBBRKU-Rev). The forward primer contained about 40 bp of the upstream region of amgK and murU cluster of P. putida genome DNA 41 . All inserted genes were confirmed by sequencing with plasmid sequencing primers (for pGEX-6 P-1 vector, using primer set 5GEX/3GEX, for pBBR1MCS vector, using primer set M13F (-21)/M13R). A complete list of primer sequences used in this study is shown in Supplementary Table 3 . E. coli ΔMurQ-KU and E. coli KU cell lines were constructed by transforming pBBR-KU vector into E. coli ΔMurQ and E. coli DH5α competent cells, respectively. Expression and function of AmgK and MurU enzymes were proved by a fosfomycin-susceptible agar diffusion assay. DNA of amgK and murU gene cluster with 5′-BamHI and 3′-HindIII restriction sites was cloned into pDG1662 plasmid to yield pDG-KU vector (primer set: pDGKU-For/pDGKU-Rev). pDG-KU vector was transformed into B. subtilis 3A38-competent cells as described 63 . Transformants after genomic recombination were selected on LB plate with chloramphenicol (5 μg ml −1 ) and marked as B. subtilis 3A38-KU strain. A complete list of primer sequences used in this study is shown in Supplementary Table 3 .
Protein expression and purification
Reconstructed pGEX expression plasmids were transformed into BL21(DE3) competent cells. After transformation, a 10 ml overnight BL21 cell culture was inoculated into 1 L fresh LB medium supplemented with 100 μg ml −1 carbenicillin antibiotics and incubated until OD 600nm reached 0.6. The expression of GST-tagged proteins was induced with 1 mM isopropyl-1-thio-β- D -galactoside at 18 °C for 20 h. Induced cells were harvested by centrifugation (4,000 g , 30 min) and resuspended in 20 ml GST lysis buffer (150 mM NaCl, 50 mM Tris, 2 mM dithiothreitol (DTT) pH 7.0, containing one protease inhibitor cocktail tablet from Roche). Cells were disrupted by two passes through a French Press at 10,000 psi and centrifuged at 27,000 g for 2 × 15 min to remove the cell debris. The supernatant was loaded onto a protein purification column with Glutathione Sepharose 4 Fastflow beads (GE Healthcare) and incubated at 4 °C for 1 h. The flow through was released and column was washed five times with 20 ml GST wash buffer (500 mM NaCl, 50 mM Tris, 1 mM DTT, 1 mM EDTA pH 7.0). After the washes, 10 ml GST elution buffer (150 mM NaCl, 50 mM Tris, 1 mM DTT and 1 mM EDTA pH 7.0) was added with an appropriate amount of PreScission Protease. The column was incubated at 4 °C overnight and purified protein was collected. For long-term storage at −20 °C, glycerol (20% final concentration) was added into the protein solution.
Enzymatic reaction conditions
Activity and promiscuity of purified enzymes were studied in the enzymatic reactions. Products were analysed by HRLC/MS ( Supplementary Information ). Conditions for each enzymatic reaction are as follows: AmgK: to 100 mM Tris buffer pH 7.9, 2.0 mM of one NAM derivative ( 1 (Sigma-Aldrich) or 2 and 3 ), 4.0 mM ATP and 1.0 mM MgCl 2 was added 1.0 μg purified AmgK enzyme per 100 μl reaction sample. The reaction was incubated at room temperature for 2 h (ref. 41 ). MurU: to 100 mM Tris buffer pH 7.9, 2.0 mM, 1a to 3a MurNAc-1P substrates, 4.0 mM UTP (Sigma-Aldrich) and 0.5 U of baker's yeast inorganic pyrophosphatase (Sigma-Aldrich) was added 1.0 μg purified MurU enzyme per 100 μl reaction sample. The reaction was incubated at 37 °C for 3 h (ref. 41 ). MurC: to 100 mM Tris buffer pH 7.9, 2.0 mM of one UDP-MurNAc derivative ( 1b – 3b ), 15 mM (NH 4 ) 2 SO 4 , 15 mM MgCl 2 , 2.5 mM 2-mercaptoethanol, 4.0 mM L -Ala, 4.0 mM ATP and 1.0 mM DTT was added 1.0 μg purified MurC enzyme per 100 μl reaction sample. The reaction was incubated at room temperature for 3 h (ref. 64 ). MurD: to 100 mM Tris buffer pH 7.9, 2.0 mM of one UDP-MurNAc-L-Ala derivative ( 1c – 3c , Supplementary Information ), 4.0 mM D-Glu, 4.0 mM ATP and 2.0 mM MgCl 2 was added 1.0 μg purified MurD enzyme per 100 μl reaction sample. The reaction was incubated at room temperature for 3 h (ref. 65 ). MurE reaction: to 100 mM Tris buffer pH 7.9, 2.0 mM of one UDP-MurNAc- L -Ala- D -Glu derivative ( 1d – 3d , Supplementary Information ), 4.0 mM meso-DAP (Sigma-Aldrich), 4.0 mM ATP, 2.0 mM MgCl 2 and 1.0 mM DTT was added 1.0 μg purified MurE enzyme per 100 μl reaction sample. The reaction was incubated at room temperature for 3 h (ref. 66 ). MurF reaction: to 100 mM Tris buffer pH 7.9, 2.0 mM of one UDP-MurNAc- L -Ala- D -Glu-m-DAP derivative ( 1e – 3e , Supplementary Information ), 4.0 mM D -Ala- D -Ala (Sigma-Aldrich), 4.0 mM ATP and 2.0 mM MgCl 2 was added 1.0 μg purified MurF enzyme per 100 μl reaction sample. The reaction was incubated at room temperature for 3 h (ref. 67 ).
Bacterial cell growth curve study Exponentially growing E. coli
ΔMurQ-KU cells were diluted to OD 600nm 0.04. 1 ml of cell culture was incubated in 5 ml sterilized tubes. 0.2% (w/v) sugar substrates 1 – 3 and 200 μg ml −1 fosfomycin were added into experimental samples, and water was used as control. Three replicates samples were used for each study. Cells were incubated at 37 °C and OD 600nm was measured (Eppendorf 6136) and recorded every 20 min for 140 min in total. When additional dosage of NAM substrates 1 – 3 was added, they were added at 0.2% (w/v). Cell growth curves were formulated with GraphPad Prism 6 software.
Bacterial cell wall remodelling and labelling Overnight pre-cultured E. coli
ΔMurQ-KU cells, P. putida cells or B. subtilis 3A38-KU cells were inoculated into fresh LB medium and were incubated until the OD 600nm was about 0.600. 1 ml of cells were collected by centrifugation at 6,000 g for 5 min. E. coli ΔMurQ-KU and B. subtilis 3A38-KU cells were resuspended in 200 μl LB medium and P. putida cells were resuspended in same amount of M9 minimal medium with 0.2% (w/v) Glucose. One of the NAM sugars 1 - 3 [0.2% (w/v)], and 200 μg ml −1 fosfomycin were added into both cell samples, whereas 1 mM isopropyl-1-thio-β- D -galactoside was only added to the E. coli cell samples. All cells were incubated at 37 °C for time ranging from 15 to 60 min, depending on the desired experiments. Cells were then collected (6,000 g , 5 min) and washed with 500 μl 1 × PBS buffer twice. Cells were resuspended in 200 μl 1:2 tert-butanol:water to prepare for the click reaction. To the bioorthogonally tagged bacterial cells was sequentially added 1 mM CuSO 4 solution, 128 μM Tris[(1-benzyl-1H-1,2,3-triazol-4-yl)methyl]amine, 1.2 mM freshly prepared (+)− sodium ( L ) ascorbate (Sigma-Aldrich) and either 20 μM of Az488 or Alk488, or 2 μM AzCy5 or AlkCy5 (Sigma Aldrich, Supplementary Note ). Cells were incubated at room temperature for 30 min (ref. 30 ). Cells were washed four times with 1 × PBS. The cells were resuspended in 100 μl 1 × PBS and prepared for imaging. All other E. coli strains were remodelled and labelled as E. coli ΔMurQ-KU cells.
Structured illumination microscopy
Cover glasses (Zeiss; 22 mm × 22 mm) were treated with 0.1 mg ml −1 poly- L -lysine (Sigma-Aldrich) for 3 h at room temperature. Cover glasses were washed three times with deionized (DI) water and were air-dried at room temperature. Ten to twenty microlitres of labelled cells were loaded onto the centre of cover glass and incubated at room temperature for 30 min, to allow cell adherence. Cells were rinsed three times with 1 × PBS and fixed with 500 μl of 4% paraformaldehyde (stored under N 2 ) at 4 °C for 30 min. Cover glasses with fixed cells were washed with 1 × PBS for three times and laid onto glass slides (Fisher Scientific) with 5 μl of ProLong Diamond Antifade Mountants (ThermoFisher) to cover the whole cover glass. SIM images were taken on a Zeiss Elyra PS.1 microscope with Plan-Apochromat × 63/1.4 Oil differential interference contrast (DIC) M27 objective. Excitation of Az488/Alk488 and AzCy5/AlkCy5 were achieved with 488 and 642 nm laser excitations, respectively. Camera exposure time was set to 100.0 ms and the raw data contained 5 rotations and 0.110 μm z -stack interval. SIM images were reconstructed from raw data with Carl Zeiss ZEN 2012. Processing and filtering settings were kept constant and image intensity was preserved with the raw image scale option in Zen 2012. Zen 2012 or Zen 2 software was used to generate two-dimensional (2D) and 3D images, respectively. Measurements were made in Zen 2012 using the line measurement tool from individual XY slices or YZ cross-sectional views.
Three-dimensional STORM imaging
Cells were pulsed with 3 for 15 min and then labelled as described above with AzCy5 and fixed to poly- L -lysine-coated cover glass-bottom dishes (Matek, Inc). An oxygen scavenging buffer (10% glucose (w/v; Sigma-Aldrich 49163-100 ml), 62.5 μg ml −1 Catalase (Sigma-Aldrich C3115-50MG), 600 μg ml −1 Glucose Oxidase (Sigma-Aldrich G0543-50KU)) and imaging buffer containing 10 mM Cysteamine hydrochloride (MEA; Sigma-Aldrich M6500-25G) and 1 × PBS (pH 8.0) 68 69 70 was added immediately before image acquisition. Three-dimensional STORM images were taken on the Zeiss Elyra PS.1 microscope with a Plan-Apochromat × 63/1.4 Oil DIC M27 objective using 642 nm laser excitation and a 655 nm long-pass filter. Camera exposure time was set to 18 ms with an electron-multiplying charge-coupled device gain of 300. Raw data were processed with Carl Zeiss ZEN 2 and molecules were filtered to 10 nm × 10 nm × 60 nm (XYZ) localization precision. Zen 2012 or Amira 6 software was used to generate 2D and 3D images.
Flow cytometry
Bacteria labelled with either 488 or Cy5 were washed and resuspended in 100 μl 1 × PBS. Flow cytometry was performed on an Accuri C6 instrument, with DI water back flushing before and after each sample. Samples were vortexed for 10 s before each run. Cells (100,000) were analysed for each sample in triplicate and fluorescence intensities for R1-gated samples were measured. Histograms of fluorescence intensities (height) were generated and overlaid.
Statistical data for mean FL-4H and mean
FL-1H supplied in Supplementary Table 4 based on equal population number. The s.d. generated from technical triplicates. PG digestions and HPLC/MS analysis Two 100 ml samples of E. coli Δ MurQ-KU cells were remodelled with 3 and then fluorescently labelled with Az-488 via click chemistry as described above. The same amount of cells was treated with 1 as control. All the samples were washed four times with 12 ml of 1 × PBS and finally stored as a dry pellet at −80 °C. Labelled and control cells were confirmed by microscopy as above. To digest the PG, the cell pellets were resuspended in 5 ml of digestion buffer (25 mM NaCl, 50 mM Tris, 2 mM EDTA pH 7.9), then freshly prepared lysozyme was added into each sample (1 mg ml −1 of the final concentration). Samples were incubated with agitation at 37 °C for 3 days, with the addition of 1 mg ml −1 freshly prepared lysozyme every ∼24 h. Digested samples were centrifuged for 5 s and the supernatant was filtered through Amicon Ultra 3K Filter Devices and lyophilized into a green/blue gel-like material, which was then dissolved in a minimal amount of DI water (20 μl). The samples were resolved on an Acquity UPLC BEH C18 column 2.1 × 50 mm (Waters) using a Dionex UHPLC coupled to a Q-Exactive Orbitrap (Thermo Fisher Scientific). The LC method was a 0.5 ml min −1 linear gradient starting from 0% A to 50% B in 4 min. Eluent A was 0.1% formic acid in water and Eluent B was 0.1% formic acid in acetonitrile. The absorbance of the eluting peaks was measured at 505 nm and further subjected high-resolution mass analysis on the Q-Exactive. All data were processed and analysed on a Thermo Xcalibur Qual Browser. All species not only showed the expected mass within ±5 p.p.m., but also the correct isotopic pattern. Macrophage invasion and immunostaining The day before seeding the cells, sterile cover glasses (Fischer Scientific, catalogue number 12-545-80) were coated with 500 μl of 0.1 mg ml −1 poly- L -ornithine (Sigma-Aldrich) in 24-well plates overnight. One day before bacterial invasion, the poly- L -ornithine was removed and the cover glasses were washed with DMEM medium without antibiotics twice. J774 macrophages (provided by M. Parent, purchased ATCC catalogue number TIB-67) were seeded on these cover glasses in 24-well plates with DMEM medium (Methods) without antibiotics (penicillin–streptomycin) at a density of 1 × 10 5 cells per well. For invasion with remodelled E. coli ΔMurQ-KU cells, bacteria were grown and remolded with modified NAM derivative 3 as described above. The bacteria (5 × 10 5 cells) were added to the macrophage for different time lengths 20, 40, 60 and 80 min. After incubation, the medium was removed and fresh medium with gentamicin (1:1,000) was added to kill extracellular bacteria for 30 min at 37 °C. After 30 min, the medium was removed and cells were rinsed twice with 1 × PBS at room temperature. Cells were fixed with 4% formaldehyde in 1 × PBS for 10 min at room temperature. Cells were rinsed with 1 × PBS and then permeabilized with 1% Triton X-100 for 10 min at room temperature. Fixed cells were then rinsed in 1 × PBS containing 3% BSA and 0.1% Triton X-100 for 3 × 5 min. After rinsing cells in 1 × PBS, the click reaction was performed as described above in 1 × PBS with 0.01% BSA and 0.1% Triton X-100 for 30 min. After 30 min, the cells were rinsed in 1 × PBS and then washed in 1 × PBS containing 3% BSA and 0.1% Triton X-100 for 5 × 8 min. The cells were mounted on glass slides with 4,6-diamidino-2-phenylindole (Invitrogen) and ready for imaging.
Data availability
The data that support the findings of this study are available from the corresponding author upon request.
Supplementary Material Supplementary Information Supplementary Figures, Supplementary Tables, Supplementary Note, Supplementary Methods and Supplementary References Supplementary Movie 1 Z-stack of SIM images show the labeling of bacterial peptidoglycan. 2-D z-stack SIM images (seen in Fig. 3b) are generated from Carl Zeiss ZEN 2012 (Methods). E. coli ΔMurQ-KU cells were treated with 2 and labeled with AlkCy5 (red) via click chemistry. Supplementary Movie 2 Video generated from 3-D SIM showing the rotation of 488-labeled bacterial cells. 3-D renderings are generated from SIM z-stacks with Carl Zeiss ZEN 2012 (seen in Supplementary Fig. 3a, Methods). E. coli ΔMurQ-KU cells were treated with 2 and labeled with Alk488 (green) via click chemistry Supplementary Movie 3 Z-stack of STORM images show the labeling of bacterial peptidoglycan. 2-D z-stack STORM images (seen in Fig. 4b and Supplementary Fig. 9a) are generated from Carl Zeiss ZEN 2012 (Methods). E. coli ΔMurQ-KU cells were treated with 3 for 15 min and labeled with AzCy5 via click chemistry. Supplementary Movie 4 Video generated from 3-D STORM showing the rotation of labelled bacterial cells. 3-D renderings are generated from STORM z-stacks with Carl Zeiss ZEN 2 (seen in Fig. 4b and Supplementary Fig. 9a, Methods). E. coli ΔMurQ-KU cells were treated with 3 for 15 min and labelled with AzCy5 via click chemistry. Renderings are rotated 360 degrees around the y-axis. Supplementary Movie 5 Video generated from 3-D STORM showing ring-like structures of peptidoglycan. 3-D renderings are generated from STORM z-stacks with Carl Zeiss ZEN 2 and video is made with Amira 6 software. E. coli ΔMurQ-KU cells were treated with 3 for 15 min and labeled with AzCy5 via click chemistry. Ring-like structures are highlighted with red circles. Supplementary Movie 6 3-D projections showing J774 cells with fluorescent labeled bacterial cells inside. 3-D renderings are generated from SIM z-stacks with Carl Zeiss ZEN 2012 (seen in Fig. 5a, Methods). J774 cells are invaded for 1 h with E. coli ΔMurQ-KU cells that were pre-treated with 3 for 45 min. Cells were fixed and remodeled bacterial peptidoglycan was labeled with Az488 via click chemistry (green). Cellular DNA was stained with DAPI (blue). Whole bacterial cells were visualized inside the J774 cells. Renderings are rotated 360 degrees around the y-axis. Supplementary Movie 7 3-D projections showing the engulfment of remodeled bacterial cell into J774 cell. 3-D renderings are generated from SIM z-stacks with Carl Zeiss ZEN 2012 (seen in Supplementary Fig. 10b, Methods). Cells were treated as described in Supplementary Movie 6 . One dividing bacterial cell was visualized in the process of engulfment into the J774 cells. Renderings are rotated 360 degrees around the y-axis. Supplementary Movie 8 3-D projections showing J774 cells with deformed bacterial cells and fluorescent fragments inside. 3-D renderings are generated from SIM z-stacks with Carl Zeiss ZEN 2012 (seen in Fig. 5b, Methods). Cells were treated as described in Supplementary Movie 6 . Deformed bacterial cells with released fluorescent fragments were visualized inside the J774 cells. Renderings are rotated 360 degrees around the y-axis.
📊 Figures
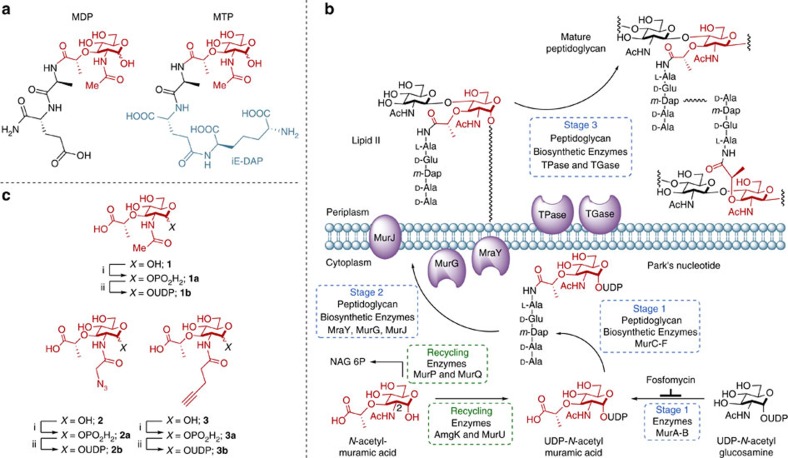
Figure 1
Immunostimulatory PG fragments and use of bioorthogonal NAM derivatives in PG Biosynthesis.
( a ) Synthetic fragments MDP ( N -acetylmuramic acid linked by its lactic acid moiety to the N terminus of an L -alanine D -isoglutamine dipeptide) and MTP (MTP with the D -iso-glutamine-diaminopimel...
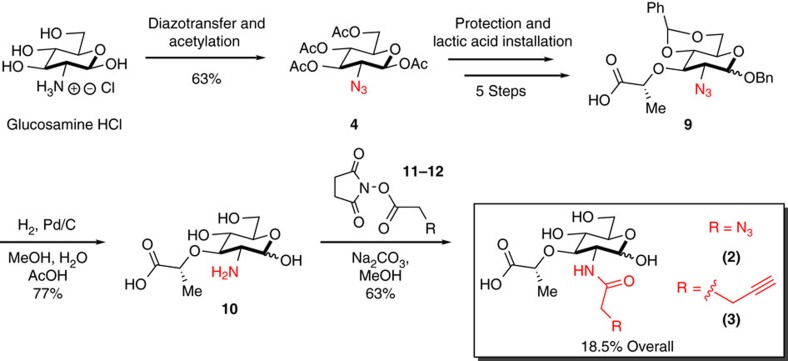
Figure 2
Modular synthesis of bioorthogonal NAM derivatives.
The azide was installed onto glucosamine HCl using a diazotransfer followed by acetylation to yield 4 . Intermediate 4 was protected and modified over 5 steps: (i) hydrazine acetate; (ii) COCl 2 follo...
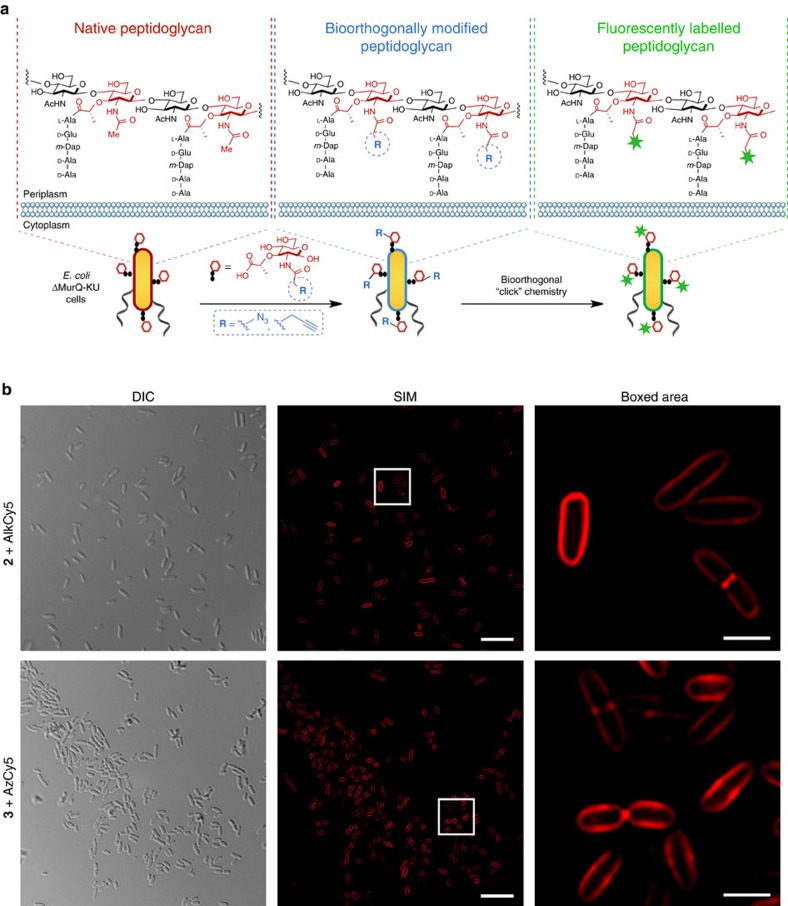
Figure 3
Fluorescent labelling of E. coli DMurQ-KU cells.
( a ) Overall PG remodelling strategy. To survive fosfomycin inhibition, cells utilize the promiscuity of the recycling and biosynthetic enzymes for incorporation of bioorthogonal NAM building blocks ...
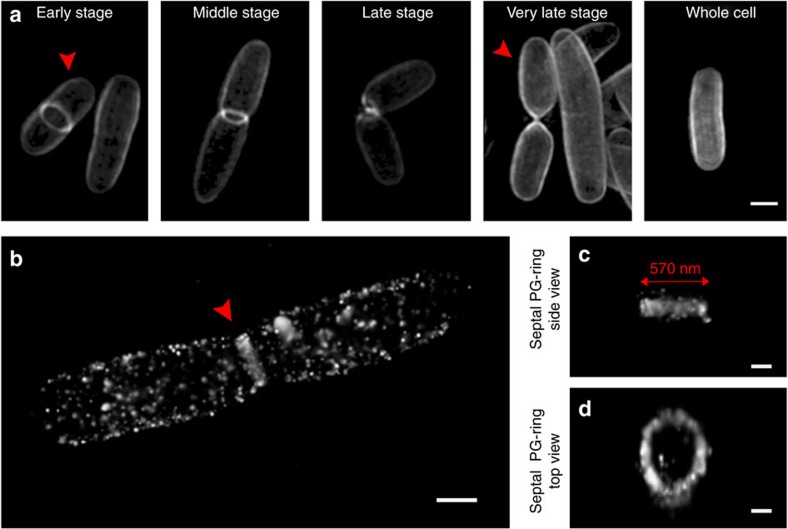
Figure 4
Visualization studies of the carbohydrate probes' incorporation into PG.
( a ) SIM images of 488 labelled E. coli u0394MurQ-KU cells at different cell division stages compiled from separate cell sample populations (scale bar, 1u2009u03bcm). Images are representative of a m...
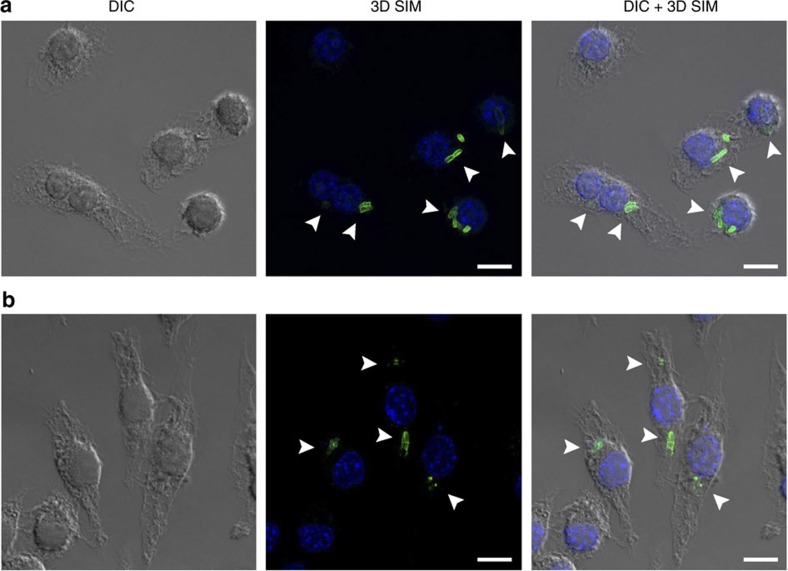
Figure 5
J774 mouse macrophage cells invaded by remodeled E. coli u0394MurQ-KU coli DMurQ-KU cells.
( a ) E. coli u0394MurQ-KU cells pre-treated with 3 for 45u2009min were then used to invade J774 cells for 1u2009h. Cells were fixed and Az488 was clicked into remodelled bacterial PG (green). Whole b...
Figure images are served from the NIH/NLM PubMed Central Open Access Subset or Europe PMC; copyright remains with the publishers and authors.
💬 Discussion
0 commentsNo comments yet. Be the first to start a discussion!
Leave a Comment