Abstract
Disruptions in metal ion homeostasis have been described in association with amyotrophic lateral sclerosis (ALS) for a number of years but the precise mechanism of involvement is poorly understood. Metal ions are especially important to familial ALS cases caused by mutations in the metalloenzyme copper-zinc superoxide dismutase (SOD1). To investigate the role of metals in aggregation of mutant SOD1, we have examined the localization of metal ions in a cell culture model of overexpression. Chinese hamster ovary cells (CHO-K1) were transfected to overexpress SOD1 fused to yellow fluorescent protein (YFP) to readily identify the transfected cells and the intracellular aggregates that develop in the cells expressing mutant or wild-type (WT) SOD1. The concentration and distribution of iron, copper, and zinc were determined for four SOD1 mutants (A4V, G37R, H80R, and D125H) as well as a WT SOD1 using X-ray fluorescence microscopy (XFM). Results demonstrated that the SOD1 aggregates were metal-deficient within the cells, which is consistent with recent in vitro studies. In addition, all SOD1 mutants showed significantly decreased copper content compared to the WT SOD1 cells, regardless of the mutant's ability to bind copper. These results suggest that SOD1 overexpression creates an unmet demand on the cell for copper. This is particularly true for the SOD1 mutants where copper delivery may also be impaired. Hence, the SOD1 mutants are less stable than WT SOD1 and if copper is limited, aggregate formation of the metal-deficient, mutant SOD1 protein occurs.
🔬 Techniques
✨ Fluorophores
🧪 Sample Preparation
💻 Software Details
🏛️ Research Organizations (ROR)
Affiliated research institutions:
📋 Methods
Chinese hamster ovary cells (CHO-K1) (ATCC, Manassas, VA) were maintained in F12-K media with 10% fetal bovine serum, 1% penicillin/streptomycin, and 1% amphotericin- β. The cells were stored in an incubator at 37°C and 5% CO 2 . Cells were seeded onto 2.5 × 2.5 mm silicon nitride windows (Silson, UK), an IR and X-ray transparent material, with a 500 nm membrane thickness. After 20 h, when the cells were approximately 80% confluent, they were transfected with plasmid cDNA (Karch et al., 2009 ) using lipoD293 transfection reagent (SignaGen, Rockville, MD) according to the protocol provided by SignaGen. CHO-K1 cells were transfected to express a WT or mutant (A4V, G37R, H80R, or D125H) form of SOD1 fused to a YFP tag to visualize the transfected cells and aggregates without staining. The transfections were stopped between 19–26 h, which was when YFP fluorescence was visible in most cells and punctate aggregates could be seen (Prudencio et al., 2009 ). The time to completion was varied so that the aggregate levels would be equivalent for each mutation used. Cells were fixed by rinsing the silicon nitride windows with PBS and then dipping in cold (~80°C) methanol three times for 1 s each time. The windows were allowed to dry at room temperature and were stored in a desiccator until imaged. Each transfection was carried out twice, and cells from both transfections were imaged. FTIR microspectroscopy was used to determine the protein density of the aggregates. Spectra were acquired using a Thermo Nicolet Continuum IR microscope coupled to beamline U2B at the National Synchrotron Light Source (NSLS) at Brookhaven National Laboratory (Upton, NY). A 32 × IR Schwarzchild objective produced a 7 × 7 μm beam. A 4 cm −1 spectral resolution and 128 scans per spectrum were used over the mid-infrared region (4000–800 cm −1 ). To normalize the additional protein density found in the protein aggregates, 40–45 spectra were collected both on the aggregates and off the aggregates of transfected cells. For each spectrum, the protein content was determined by integrating the Amide I band from 1610–1700 cm −1 with a linear baseline from 1480 to 1800 cm −1 . The relative protein intensity was determined by calculating the intensity ratio on the aggregates versus off the aggregates for each cell. The cells were then imaged with XFM at beamline 2-ID-E at the Advanced Photon Source at Argonne National Laboratory (Argonne, IL) to determine the distribution and concentration of metal ions. The incident beam was tuned to 10 keV using a Si(111) monochromator and the X-rays were focused to a 0.5 × 0.5 μm spot size using 20 cm zone plates (Xradia, Pleasanton, CA). The specimen was positioned at a 45° angle with respect to the incident beam and maintained in a helium-purged box. The X-ray fluorescence was detected with a four-element silicon drift detector oriented at 90° with respect to the incident beam and a differential phase contrast detector was used for the transmitted X-ray beam. Approximately 15 cells were imaged per mutation with a 0.5-s dwell time per point. A full energy dispersive spectrum was collected at each pixel. Metal concentrations were determined based on NIST thin film standards 1832 and 1833. To analyze the data, three regions of interest (ROI) were generated using the beamline’s MAPS program: (1) the nucleus; (2) the cytoplasm; and (3) the aggregates (if present). The cytoplasm ROI was separated from the nucleus to provide a more accurate measure of metal concentrations in the cytoplasm where the SOD1 is located. The aggregates were easily located using the phase contrast images collected with the XFM data. In addition, the aggregates were small (1–3 μm) so the 500 nm beam size allowed for several pixels (approximately 10) from each aggregate to be analyzed. After generating ROIs, the data points within each ROI were averaged and the aggregate values were normalized to the protein density as determined by FTIR. Using the average values, a ratio of the aggregate/cytoplasm was generated for copper and zinc to demonstrate any change in metal content within the aggregates. Statistics were performed on mean values from the ROIs of each cell type with SPSS software (version 14.0) using the Kruskal-Wallis non-parametric test. Significant groups were then tested with Mann-Whitney U post-hoc test. Significance was determined by p < 0.05.
Show full methods section
Chinese hamster ovary cells (CHO-K1) (ATCC, Manassas, VA) were maintained in F12-K media with 10% fetal bovine serum, 1% penicillin/streptomycin, and 1% amphotericin- β. The cells were stored in an incubator at 37°C and 5% CO 2 . Cells were seeded onto 2.5 × 2.5 mm silicon nitride windows (Silson, UK), an IR and X-ray transparent material, with a 500 nm membrane thickness. After 20 h, when the cells were approximately 80% confluent, they were transfected with plasmid cDNA (Karch et al., 2009 ) using lipoD293 transfection reagent (SignaGen, Rockville, MD) according to the protocol provided by SignaGen. CHO-K1 cells were transfected to express a WT or mutant (A4V, G37R, H80R, or D125H) form of SOD1 fused to a YFP tag to visualize the transfected cells and aggregates without staining. The transfections were stopped between 19–26 h, which was when YFP fluorescence was visible in most cells and punctate aggregates could be seen (Prudencio et al., 2009 ). The time to completion was varied so that the aggregate levels would be equivalent for each mutation used. Cells were fixed by rinsing the silicon nitride windows with PBS and then dipping in cold (~80°C) methanol three times for 1 s each time. The windows were allowed to dry at room temperature and were stored in a desiccator until imaged. Each transfection was carried out twice, and cells from both transfections were imaged. FTIR microspectroscopy was used to determine the protein density of the aggregates. Spectra were acquired using a Thermo Nicolet Continuum IR microscope coupled to beamline U2B at the National Synchrotron Light Source (NSLS) at Brookhaven National Laboratory (Upton, NY). A 32 × IR Schwarzchild objective produced a 7 × 7 μm beam. A 4 cm −1 spectral resolution and 128 scans per spectrum were used over the mid-infrared region (4000–800 cm −1 ). To normalize the additional protein density found in the protein aggregates, 40–45 spectra were collected both on the aggregates and off the aggregates of transfected cells. For each spectrum, the protein content was determined by integrating the Amide I band from 1610–1700 cm −1 with a linear baseline from 1480 to 1800 cm −1 . The relative protein intensity was determined by calculating the intensity ratio on the aggregates versus off the aggregates for each cell. The cells were then imaged with XFM at beamline 2-ID-E at the Advanced Photon Source at Argonne National Laboratory (Argonne, IL) to determine the distribution and concentration of metal ions. The incident beam was tuned to 10 keV using a Si(111) monochromator and the X-rays were focused to a 0.5 × 0.5 μm spot size using 20 cm zone plates (Xradia, Pleasanton, CA). The specimen was positioned at a 45° angle with respect to the incident beam and maintained in a helium-purged box. The X-ray fluorescence was detected with a four-element silicon drift detector oriented at 90° with respect to the incident beam and a differential phase contrast detector was used for the transmitted X-ray beam. Approximately 15 cells were imaged per mutation with a 0.5-s dwell time per point. A full energy dispersive spectrum was collected at each pixel. Metal concentrations were determined based on NIST thin film standards 1832 and 1833. To analyze the data, three regions of interest (ROI) were generated using the beamline’s MAPS program: (1) the nucleus; (2) the cytoplasm; and (3) the aggregates (if present). The cytoplasm ROI was separated from the nucleus to provide a more accurate measure of metal concentrations in the cytoplasm where the SOD1 is located. The aggregates were easily located using the phase contrast images collected with the XFM data. In addition, the aggregates were small (1–3 μm) so the 500 nm beam size allowed for several pixels (approximately 10) from each aggregate to be analyzed. After generating ROIs, the data points within each ROI were averaged and the aggregate values were normalized to the protein density as determined by FTIR. Using the average values, a ratio of the aggregate/cytoplasm was generated for copper and zinc to demonstrate any change in metal content within the aggregates. Statistics were performed on mean values from the ROIs of each cell type with SPSS software (version 14.0) using the Kruskal-Wallis non-parametric test. Significant groups were then tested with Mann-Whitney U post-hoc test. Significance was determined by p < 0.05.
📊 Figures
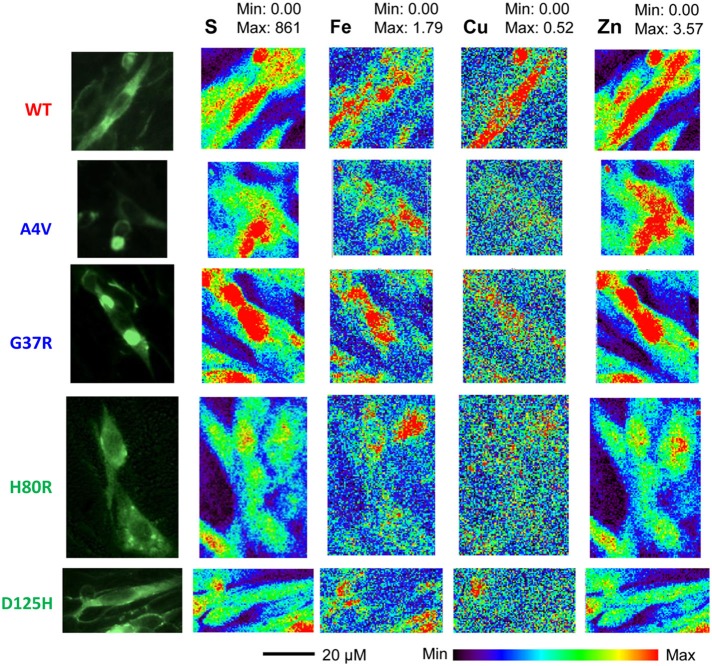
Figure 1
Epifluorescence images (first column) from SOD1-YFP CHO-K1 cells with WT, A4V, G37R, H80R or D125H SOD1 . XFM maps for sulfur (second column), iron (third column), copper (fourth column), and zinc (fi...
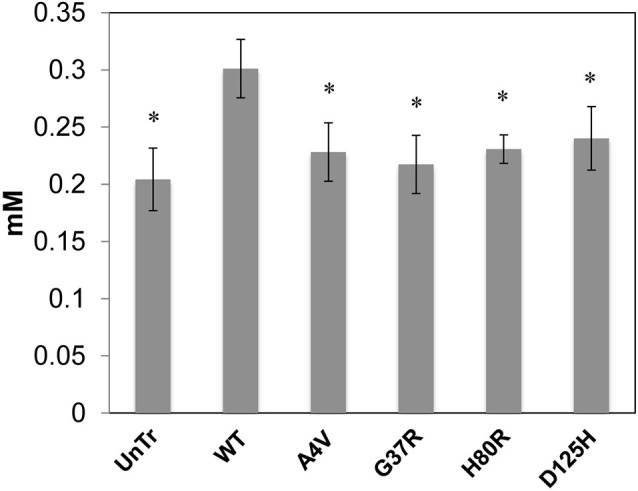
Figure 2
Bar graph of intracellular copper levels (excluding the nucleus) for SOD1-YFP cells . Concentrations are in mM. The WT cells contained the highest level of copper in comparison to the cells overexpres...
Figure images are served from the NIH/NLM PubMed Central Open Access Subset or Europe PMC; copyright remains with the publishers and authors.
💬 Discussion
0 commentsNo comments yet. Be the first to start a discussion!
Leave a Comment