Abstract
Although ubiquitous in biological studies, the enhanced green and yellow fluorescent proteins (EGFP and EYFP) were not specifically optimized for neuroscience, and their underwhelming brightness and slow expression in brain tissue limits the fidelity of dendritic spine analysis and other indispensable techniques for studying neurodevelopment and plasticity. We hypothesized that EGFP's low solubility in mammalian systems must limit the total fluorescence output of whole cells, and that improving folding efficiency could therefore translate into greater brightness of expressing neurons. By introducing rationally selected combinations of folding-enhancing mutations into GFP templates and screening for brightness and expression rate in human cells, we developed mGreenLantern, a fluorescent protein having up to sixfold greater brightness in cells than EGFP. mGreenLantern illuminates neurons in the mouse brain within 72 h, dramatically reducing lag time between viral transduction and imaging, while its high brightness improves detection of neuronal morphology using widefield, confocal, and two-photon microscopy. When virally expressed to projection neurons in vivo, mGreenLantern fluorescence developed four times faster than EYFP and highlighted long-range processes that were poorly detectable in EYFP-labeled cells. Additionally, mGreenLantern retains strong fluorescence after tissue clearing and expansion microscopy, thereby facilitating superresolution and whole-brain imaging without immunohistochemistry. mGreenLantern can directly replace EGFP/EYFP in diverse systems due to its compatibility with GFP filter sets, recognition by EGFP antibodies, and excellent performance in mouse, human, and bacterial cells. Our screening and rational engineering approach is broadly applicable and suggests that greater potential of fluorescent proteins, including biosensors, could be unlocked using a similar strategy.
🔬 Techniques
🔭 Microscopes
🧬 Organisms
💻 Software
✨ Fluorophores
🧪 Sample Preparation
🔬 Cell Lines
🏭 Microscope Brands
🧪 Reagent Suppliers
🔴 Lasers
📷 Detectors
🔎 Objectives
💻 Software Details
💾 Data Repositories
🏛️ Research Organizations (ROR)
Affiliated research institutions:
📋 Methods
Cellular Brightness. Low-passage HeLa (ATCC CCL-2), BE(2)-M17 (ATCC CRL-2267), and HEK293T cells were routinely cultured in OptiMEM (Gibco) supplemented with 5% fetal bovine serum (VWR) and penicillin–streptomycin (Gibco). Cells were passaged into 96-well black clear-bottom tissue culture treated assay plates (Corning) and grown for 24 h in media without phenol red before transfection with 0.2 µg of DNA per well using a single pcDNA3.1-[FP]-P2A-mCherry plasmid, or cotransfected with 0.2 µg each of pcDNA3.1-[FP] and pcDNA3.1-mCherry individual plasmids. Fluorescence was measured on a BioTek H1 Synergy microplate reader 48 h after transfection using endpoint scans (λ ex /λ em = 495/525 nm for GFPs and 585/615 nm for mCherry). After subtracting blanks, GFP fluorescence was divided by mCherry signal, normalized to the EGFP ratio, and plotted in GraphPad Prism. To determine cellular brightness using widefield microscopy, HeLa cells were transfected using 0.2 µg of pcDNA3.1-[FP] in 96-well format. After 48 h, cells were washed twice with PBS, pH 7.4 (Gibco), and allowed to incubate in fresh phenol red-free culture media for 30 min. Imaging was performed on a Keyence BZ-X700 All-in-One Fluorescence Microscope equipped with a 20× air objective and computer-controlled motorized stage. After briefly confirming the presence of cells using brightfield, focusing was manually adjusted for each well, and all wells were imaged under identical excitation and acquisition settings with a GFP filter cube (Keyence). Tile scans were collected for each well and analyzed in ImageJ by thresholding, quantifying mean fluorescence intensity of at least 300 cells per FP for each of six independent transfections, and normalizing the average values per transfection to an EGFP control. Bacterial Brightness and Protein Solubility. Bacteria were thawed from glycerol stocks and grown overnight in LB supplemented with 100 µg/mL ampicillin. The next day, all cultures were adjusted to the same optical density and used as starter cultures to inoculate at a 1:100 (vol/vol) ratio fresh media plus 0.2% arabinose for induction. Cultures were grown overnight at 37 °C with shaking at 275 rpm to ensure thorough oxygenation. The following day, 100 µL of overnight culture was added in replicate to black 96-well clear-bottom assay plates (Corning), and fluorescence was measured using λ ex /λ em = 495/525-nm detection settings on a BioTek Synergy H1 microplate reader. Fluorescence values were background subtracted, normalized to the EGFP control sample, and the bacterial brightness data were plotted in GraphPad Prism. The remaining cultures were pelleted and frozen at −80 °C. To obtain lysate from bacterial cultures, cultures were thawed on ice and resuspended in ice-cold PBS. Resuspended cultures were sonicated identically on ice, centrifuged at 4 °C for 15 min at 20,000 × g , and the clarified lysate containing soluble protein was collected. To wash the insoluble pellet and remove residual soluble protein, the pellet was resuspended in PBS, centrifuged as described, and the supernatant was discarded. The washed insoluble pellet was resuspended in PBS and very briefly sonicated to homogenize it. To obtain soluble lysate from mammalian cultures, HEK293T and BE(2)-M17 cells were passaged onto six-well plates and grown for at least 24 h before transfection using Turbofect (Thermo Fisher) according to manufacturer instructions. Cells were harvested by trypsinization 48 h later and washed three times with cold PBS before storage at −80 °C. Pellets were lysed by repeated freeze–thaw from liquid nitrogen to 37 °C water, resuspended in ice-cold RIPA buffer supplemented with phenylmethylsulfonyl fluoride protease inhibitor, and briefly sonicated on ice. Lysate was clarified by centrifugation as described. Total protein concentration of clarified lysate was determined using the BCA Protein Assay (Pierce) with BSA standard curve. Aliquots of clarified lysate were adjusted using identical final concentration and volume using PBS, boiled at 100 °C for 5 min in SDS loading dye containing 0.2 M DTT, and allowed to cool passively to room temperature (RT). Samples were checked briefly using a 470-nm LED to confirm total loss of fluorescence, i.e., complete denaturation, before loading onto mini 4 to 15% or 12% Tris-Glycine gels (Bio-Rad) for bacterial or mammalian protein, respectively. Gels were stained with Coomassie reagent (Thermo Scientific) and imaged on a Bio-Rad ChemiDoc XRS+ scanner using identical exposure times. Band intensity was analyzed by densitometry in Fiji (ImageJ) using the Analyze → Gels function. Averages of three and two experimental replicates are presented for the bacterial and mammalian gels, respectively. Mammalian Cell Culture and Imaging. For localization, photobleaching, OSER assay, and proExM experiments, cells were passaged into 35-mm tissue culture plates containing a 22-mm glass bottom (MatTek) and grown for at least 24 h before transfection with Turbofect (Thermo Fisher) and 1-µg plasmid. Live cells were imaged 12 to 18 h after transfection using a Zeiss LSM 880 laser-scanning confocal microscope equipped with computer-controlled Zeiss Enhanced Navigation (ZEN) software, an argon-ion laser with 488- and 514-nm filters, 10×, 40×, or 63× differential interference contrast (DIC) objectives, and a high-sensitivity gallium arsenide phosphide (GaAsP) photodetector, or a lower-sensitivity photomultiplier tube (PMT) for the high-intensity photobleaching experiments. OSER Assay. The OSER assay was performed as described ( 32 ) under the mentioned transfection and culture conditions. Only healthy cultures of mycoplasma-free HeLa cells were imaged. Highly stressed or mitotic cells with sheeted ER, lobed nuclei, or indistinct nuclei, were excluded from analysis. In general, ∼100 cells were analyzed per FP for each of three experimental replicates and compared to mEGFP and Clover. Photobleaching. Photobleaching experiments were performed on a Zeiss LSM 880 confocal microscope with a Plan-Apochromat 40×/1.3 Oil DIC UVVIS-IR objective using live HeLa cells in phenol red-free media transfected as described. Pinhole was set to 1 Airy unit (“0.9-µm section”), scan time of 316 ms, pixel size of 0.83 µm, pixel dwell of 4.12 µs, 256 × 256-px frames, and 12-bit depth. The 488-nm argon-ion laser power was measured at the objective with a Thorlabs PMD100 power meter equipped with S130VC photodetector (Thorlabs). Laser power was initially set to the minimum necessary to identify suitable regions for bleaching before being increased to 77 µW at t = 0. Images from the H2B-[FP] transfected live HeLa cells were collected in the 490- to 650-nm emission range using ZEN acquisition software (Zeiss). Scaling of the initial emission rate to 1,000 photons/s per molecule at t = 0 s was performed as described ( 47 ). Kinetic Unfolding. Purified protein in TNG buffer (50 mM Tris⋅HCl, 150 mM NaCl, 10% glycerol, pH 7.4) was adjusted to 1 µM and diluted 10-fold directly in a black 96-well clear-bottom assay plate containing 7 M GdnHCl in TNG buffer to a final concentration of 6.3 M GdnHCl and 0.1 µM FP. At the same time, protein from the same stock was dispensed into TNG buffer without GdnHCl, and the plate was quickly sealed with clear optical adhesive to prevent evaporation. Fluorescence measurements began after an initial ∼15-s lag time, with λ ex /λ em = 495/525 nm at 2-min interval for a total of 11 h. Curves were plotted as the fluorescence ratio of unfolded to native protein over time. Thermostability. FP was adjusted to 1 µM final concentration in PBS and 50 µL was dispensed into replicate wells of a clear 96-well qPCR plate. The plate was sealed with optically clear adhesive and heated in a Bio-Rad C1000 Touch thermal cycler equipped with a CFX96 Real-Time System and FAM filter. Temperature was held at 25 °C for 15 s to confirm consistent readings before the samples were heated at a rate of 0.3 °C/min to a final temperature of 100 °C. Melting temperatures were determined using the Bio-Rad CFX96 software and melting curve derivatives. Curves were plotted by normalizing each data point to the individual FP’s average initial value from the 25 °C baseline hold. Expansion Microscopy (proExM). HeLa cells were grown and transfected in 35-mm imaging plates as described, using pLifeAct-mGreenLantern. After live imaging, proExM was performed according to established protocols ( 26 , 27 ), without immunostaining. Antibody Compatibility. HEK293T cells were transfected with pcDNA3.1-[FP] and cultured as described. After 48-h expression, cells were fixed with room temperature 4% paraformaldehyde (PFA) for 15 min, washed 3 × 5 min with PBS, and incubated in 0.1% Triton X-100 and 5% donkey serum in PBS (“blocking solution”) for 60 min at RT. Primary antibody (goat α-GFP polyclonal, Abcam, #ab6673; or goat α-GFP polyclonal, Novus, #NB1001770; or Ms α-GFP monoclonal, Life Technologies, #A-11122) was applied in fresh blocking solution at 1:1,000 dilution overnight at 4 °C. The next day, cells were washed 3 × 5 min in PBS and incubated with donkey α-goat IgG Alexa Fluor 555 secondary antibody (Invitrogen; #A-21432) for exactly 2 h at RT. Cells were washed, stained with DAPI, washed again with PBS, mounted using Vectashield antifade medium (Vector Laboratories), and sealed with nail polish that was allowed to dry fully before imaging on a Nikon Eclipse 80i microscope.
Show full methods section
Cellular Brightness. Low-passage HeLa (ATCC CCL-2), BE(2)-M17 (ATCC CRL-2267), and HEK293T cells were routinely cultured in OptiMEM (Gibco) supplemented with 5% fetal bovine serum (VWR) and penicillin–streptomycin (Gibco). Cells were passaged into 96-well black clear-bottom tissue culture treated assay plates (Corning) and grown for 24 h in media without phenol red before transfection with 0.2 µg of DNA per well using a single pcDNA3.1-[FP]-P2A-mCherry plasmid, or cotransfected with 0.2 µg each of pcDNA3.1-[FP] and pcDNA3.1-mCherry individual plasmids. Fluorescence was measured on a BioTek H1 Synergy microplate reader 48 h after transfection using endpoint scans (λ ex /λ em = 495/525 nm for GFPs and 585/615 nm for mCherry). After subtracting blanks, GFP fluorescence was divided by mCherry signal, normalized to the EGFP ratio, and plotted in GraphPad Prism. To determine cellular brightness using widefield microscopy, HeLa cells were transfected using 0.2 µg of pcDNA3.1-[FP] in 96-well format. After 48 h, cells were washed twice with PBS, pH 7.4 (Gibco), and allowed to incubate in fresh phenol red-free culture media for 30 min. Imaging was performed on a Keyence BZ-X700 All-in-One Fluorescence Microscope equipped with a 20× air objective and computer-controlled motorized stage. After briefly confirming the presence of cells using brightfield, focusing was manually adjusted for each well, and all wells were imaged under identical excitation and acquisition settings with a GFP filter cube (Keyence). Tile scans were collected for each well and analyzed in ImageJ by thresholding, quantifying mean fluorescence intensity of at least 300 cells per FP for each of six independent transfections, and normalizing the average values per transfection to an EGFP control. Bacterial Brightness and Protein Solubility. Bacteria were thawed from glycerol stocks and grown overnight in LB supplemented with 100 µg/mL ampicillin. The next day, all cultures were adjusted to the same optical density and used as starter cultures to inoculate at a 1:100 (vol/vol) ratio fresh media plus 0.2% arabinose for induction. Cultures were grown overnight at 37 °C with shaking at 275 rpm to ensure thorough oxygenation. The following day, 100 µL of overnight culture was added in replicate to black 96-well clear-bottom assay plates (Corning), and fluorescence was measured using λ ex /λ em = 495/525-nm detection settings on a BioTek Synergy H1 microplate reader. Fluorescence values were background subtracted, normalized to the EGFP control sample, and the bacterial brightness data were plotted in GraphPad Prism. The remaining cultures were pelleted and frozen at −80 °C. To obtain lysate from bacterial cultures, cultures were thawed on ice and resuspended in ice-cold PBS. Resuspended cultures were sonicated identically on ice, centrifuged at 4 °C for 15 min at 20,000 × g , and the clarified lysate containing soluble protein was collected. To wash the insoluble pellet and remove residual soluble protein, the pellet was resuspended in PBS, centrifuged as described, and the supernatant was discarded. The washed insoluble pellet was resuspended in PBS and very briefly sonicated to homogenize it. To obtain soluble lysate from mammalian cultures, HEK293T and BE(2)-M17 cells were passaged onto six-well plates and grown for at least 24 h before transfection using Turbofect (Thermo Fisher) according to manufacturer instructions. Cells were harvested by trypsinization 48 h later and washed three times with cold PBS before storage at −80 °C. Pellets were lysed by repeated freeze–thaw from liquid nitrogen to 37 °C water, resuspended in ice-cold RIPA buffer supplemented with phenylmethylsulfonyl fluoride protease inhibitor, and briefly sonicated on ice. Lysate was clarified by centrifugation as described. Total protein concentration of clarified lysate was determined using the BCA Protein Assay (Pierce) with BSA standard curve. Aliquots of clarified lysate were adjusted using identical final concentration and volume using PBS, boiled at 100 °C for 5 min in SDS loading dye containing 0.2 M DTT, and allowed to cool passively to room temperature (RT). Samples were checked briefly using a 470-nm LED to confirm total loss of fluorescence, i.e., complete denaturation, before loading onto mini 4 to 15% or 12% Tris-Glycine gels (Bio-Rad) for bacterial or mammalian protein, respectively. Gels were stained with Coomassie reagent (Thermo Scientific) and imaged on a Bio-Rad ChemiDoc XRS+ scanner using identical exposure times. Band intensity was analyzed by densitometry in Fiji (ImageJ) using the Analyze → Gels function. Averages of three and two experimental replicates are presented for the bacterial and mammalian gels, respectively. Mammalian Cell Culture and Imaging. For localization, photobleaching, OSER assay, and proExM experiments, cells were passaged into 35-mm tissue culture plates containing a 22-mm glass bottom (MatTek) and grown for at least 24 h before transfection with Turbofect (Thermo Fisher) and 1-µg plasmid. Live cells were imaged 12 to 18 h after transfection using a Zeiss LSM 880 laser-scanning confocal microscope equipped with computer-controlled Zeiss Enhanced Navigation (ZEN) software, an argon-ion laser with 488- and 514-nm filters, 10×, 40×, or 63× differential interference contrast (DIC) objectives, and a high-sensitivity gallium arsenide phosphide (GaAsP) photodetector, or a lower-sensitivity photomultiplier tube (PMT) for the high-intensity photobleaching experiments. OSER Assay. The OSER assay was performed as described ( 32 ) under the mentioned transfection and culture conditions. Only healthy cultures of mycoplasma-free HeLa cells were imaged. Highly stressed or mitotic cells with sheeted ER, lobed nuclei, or indistinct nuclei, were excluded from analysis. In general, ∼100 cells were analyzed per FP for each of three experimental replicates and compared to mEGFP and Clover. Photobleaching. Photobleaching experiments were performed on a Zeiss LSM 880 confocal microscope with a Plan-Apochromat 40×/1.3 Oil DIC UVVIS-IR objective using live HeLa cells in phenol red-free media transfected as described. Pinhole was set to 1 Airy unit (“0.9-µm section”), scan time of 316 ms, pixel size of 0.83 µm, pixel dwell of 4.12 µs, 256 × 256-px frames, and 12-bit depth. The 488-nm argon-ion laser power was measured at the objective with a Thorlabs PMD100 power meter equipped with S130VC photodetector (Thorlabs). Laser power was initially set to the minimum necessary to identify suitable regions for bleaching before being increased to 77 µW at t = 0. Images from the H2B-[FP] transfected live HeLa cells were collected in the 490- to 650-nm emission range using ZEN acquisition software (Zeiss). Scaling of the initial emission rate to 1,000 photons/s per molecule at t = 0 s was performed as described ( 47 ). Kinetic Unfolding. Purified protein in TNG buffer (50 mM Tris⋅HCl, 150 mM NaCl, 10% glycerol, pH 7.4) was adjusted to 1 µM and diluted 10-fold directly in a black 96-well clear-bottom assay plate containing 7 M GdnHCl in TNG buffer to a final concentration of 6.3 M GdnHCl and 0.1 µM FP. At the same time, protein from the same stock was dispensed into TNG buffer without GdnHCl, and the plate was quickly sealed with clear optical adhesive to prevent evaporation. Fluorescence measurements began after an initial ∼15-s lag time, with λ ex /λ em = 495/525 nm at 2-min interval for a total of 11 h. Curves were plotted as the fluorescence ratio of unfolded to native protein over time. Thermostability. FP was adjusted to 1 µM final concentration in PBS and 50 µL was dispensed into replicate wells of a clear 96-well qPCR plate. The plate was sealed with optically clear adhesive and heated in a Bio-Rad C1000 Touch thermal cycler equipped with a CFX96 Real-Time System and FAM filter. Temperature was held at 25 °C for 15 s to confirm consistent readings before the samples were heated at a rate of 0.3 °C/min to a final temperature of 100 °C. Melting temperatures were determined using the Bio-Rad CFX96 software and melting curve derivatives. Curves were plotted by normalizing each data point to the individual FP’s average initial value from the 25 °C baseline hold. Expansion Microscopy (proExM). HeLa cells were grown and transfected in 35-mm imaging plates as described, using pLifeAct-mGreenLantern. After live imaging, proExM was performed according to established protocols ( 26 , 27 ), without immunostaining. Antibody Compatibility. HEK293T cells were transfected with pcDNA3.1-[FP] and cultured as described. After 48-h expression, cells were fixed with room temperature 4% paraformaldehyde (PFA) for 15 min, washed 3 × 5 min with PBS, and incubated in 0.1% Triton X-100 and 5% donkey serum in PBS (“blocking solution”) for 60 min at RT. Primary antibody (goat α-GFP polyclonal, Abcam, #ab6673; or goat α-GFP polyclonal, Novus, #NB1001770; or Ms α-GFP monoclonal, Life Technologies, #A-11122) was applied in fresh blocking solution at 1:1,000 dilution overnight at 4 °C. The next day, cells were washed 3 × 5 min in PBS and incubated with donkey α-goat IgG Alexa Fluor 555 secondary antibody (Invitrogen; #A-21432) for exactly 2 h at RT. Cells were washed, stained with DAPI, washed again with PBS, mounted using Vectashield antifade medium (Vector Laboratories), and sealed with nail polish that was allowed to dry fully before imaging on a Nikon Eclipse 80i microscope.
Visualization of Long-Range
Projections and In Vivo Expression Rate. Animals. Male C57BL/6 mice (Charles River) and PV-Cre mice (The Jackson Laboratory; stock #017320) were group-housed under a standard 12-h light/dark cycle in a temperature and humidity-controlled vivarium and were provided with food and water ad libitum. Stereotactic surgery. Mice were anesthetized with 2% isoflurane and head-fixed over a heating pad in a mouse stereotactic apparatus (Narishige International). A volume of 350 nL of AAV2/1-EF1α-DIO-mGreenLantern-WPRE-pA (obtained from Boston Children’s Hospital Viral Core, Boston, MA) or AAV2/1-EF1α-DIO-EYFP-WPRE-pA (obtained from University of Pennsylvania Vector Core, Philadelphia, PA) was injected with AAV1-hSyn-Cre-WPRE-hGH in a 10:1 ratio of FP:Cre virus into visual cortex; or into the ACA to visualize long-range projections ( n = 3 mice per FP); or into the ACA at a 15:1 (FP:Cre):Tracer ratio to visualize the rate of in vivo expression ( n = 2 hemispheres per FP). Tracer was Alexa 594-coated latex beads (Lumafluor). ACA injection coordinates relative to bregma were as follows: anteroposterior, +0.4 mm; mediolateral, +0.2 mm; dorsoventral, −0.5 mm. Mice were isolated postsurgery until fully awake and immediately returned to their home cage. For expression in transgenic animals, PV-Cre mice (The Jackson Laboratory; stock #017320) aged postnatal day 60 (P60) to P90 were injected with 500 nL of AAV2/1-EF1α-DIO-mGreenLantern-WPRE-hGH (obtained from Boston Children’s Hospital Viral Core, Boston, MA) with animal and surgical methods as previously described. Tissue preparation and histology. At the specified time points, mice underwent transcardial perfusion with PBS followed by 4% PFA in PBS. Brains were postfixed in 4% PFA overnight and coronally sectioned at 50 µm on a vibratome (Leica; VT1000 S). Confocal Imaging and Analysis. Imaging was performed on a Zeiss LSM 710 confocal microscope (Zeiss) using a calibrated 10× air objective (or 63× oil-immersion objective where specified). Images were collected using both 488- and 514-nm lasers separately while preserving identical settings for each FP (i.e., two sets of images) unless otherwise specified. The tracer was imaged using 561-nm laser excitation. Pinhole was 25 µm (1 Airy unit); resolution, 1,024 × 1,024 px; 0.6 scan zoom; averaging = 4 (line); scan speed = 8. To visualize projection neurons, tile scans of whole coronal sections were acquired from tissue harvested 14 d (or 3, 7, and 14 d for the in vivo expression experiment) after injection, as described. Tiles were stitched in ImageJ, displayed using the ImageJ 16-color rainbow lookup table, and superimposed on an Allen Brain Atlas diagram at the coronal depth with corresponding anterior/posterior distance to bregma. “Axon filling” was quantified by measuring the area of the striatum and corpus callosum with positive fluorescence, defined as >2 SD below the mean pixel intensity for the given FP/laser line combination, and normalizing that value to the fluorescent ACA area defined in the same manner. The bar graph was generated in GraphPad Prism analyzed using two-way ANOVA with Sidak’s multiple-comparisons test, n = 3 mice per FP. Likewise, for the in vivo expression experiment, “fluorescence” was calculated as described in Fig. 3 A and plotted for each FP/laser line combination. Two-Photon Imaging and Spine Analysis. Animals. C57BL/6J mice at 6 to 8 wk of age on surgery day were used for spine imaging experiments. Mice had ad libitum access to food and water and were group housed (two to five mice per cage) under a 12-h light/dark cycle (lights on 06:00). All procedures were overseen by and adherent to the rules set forth by the Weill Cornell Medical College Institutional Animal Care and Use Committee. Viral vectors. A dual viral approach was used to obtain sparse labeling of pyramidal cells. rAAV8-CaMKIIa-mCherry-Cre was obtained from the University of North Carolina at Chapel Hill Vector Core (titer, 4.7 × 10 12 particles/mL). Virus was diluted 10-fold using sterile PBS. This solution was then mixed with equal volume of either (undiluted) AAV2/1-EF1α-DIO-mGreenLantern-WPRE-pA (obtained from Boston Children’s Hospital Vector Core), AAV8-Syn-DIO-EGFP (obtained from the University of Pennsylvania Vector Core), or AAV2/1-EF1α-DIO-EYFP-WPRE-hGH (obtained from the University of Pennsylvania Vector Core). To label PFC neurons projecting to dorsal striatum, 500 nL of AAV2/1-EF1α-DIO-mGreenLantern-WPRE-pA virus was injected into PFC and 500 nL of AAV1-Cav2-Cre was injected into dorsomedial striatum ( Cranial window surgery ). Cranial window surgery. Anesthesia was induced using isoflurane (induction, 5%; maintenance, 1 to 2%). Dexamethasone (1 mg/kg, i.p.) and metacam (1 mg/kg, i.p.) were administered prophylactically to reduce brain swelling and pain, respectively. After animals were placed in a stereotactic frame (Kopf Instruments), sterile eye lubricant (Puralube; Fisher Scientific) was administered to prevent corneal drying, and a microwavable heating pad (Snugglesafe) was used to maintain body temperature. Scalp fur was trimmed, and the skull surface was exposed with a midline scalp incision. Bupivicaine (0.05 mL, 5 mg/mL) was administered topically as a second prophylactic analgesic. A small circular section of skin (∼1-cm diameter) was excised using surgical scissors (Fine Science Tools). The periosteum was bluntly dissected away, and bupivacaine (0.05 mL, 5 mg/kg) was topically applied. The region to be imaged (dorsal PFC) was identified using stereotaxic coordinates (1.7 mm anterior to bregma; 0.35 mm lateral from the midline). A custom-made circular titanium headplate was attached to the skull using dental cement (C&B Metabond; Parkell). The titanium head plate was then screwed into a custom-built fork fixed to a solid metal base. Under a continuous gentle flow of PBS (137 mM NaCl, 27 mM KCl, 10 mM phosphate buffer; VWR), a ∼4-mm circular section of the skull—slightly larger than the window—was removed using a 0.5-mm burr (Fine Science Tools) and a high-speed hand dental drill (Model EXL-M40; Osada), taking great care not to compress brain tissue or damage the sagittal venous sinus. The dura beneath the craniotomy was delicately removed using fine forceps (Fine Science Tools). Sugi swabs (John Weiss and Son, Ltd.) were used to absorb trace bleeding. The AAV mixture (100 nL) was injected at a rate of 150 nL/min using a Nanofil syringe with a 33-G beveled needle and pump (World Precision Instruments). After the injection, the needle was kept in place for 2 min to allow time for diffusion of the viruses prior to removing the needle from the brain. A 3-mm glass coverslip (Warner Instruments) was gently placed over the brain. Veterinary adhesive (Vetbond; Fisher Scientific) was used to form a seal between the coverslip and the skull. A layer of Metabond was then applied for added durability. Metacam (1 mg/kg, i.p.) was administered as an analgesic 24 h after surgery, and as needed thereafter. Two-photon imaging and spine analysis. Images were acquired using a commercial 2P laser-scanning microscope equipped with a scanning galvanometer and a Spectra-Physics Mai Tai DeepSee laser tuned to 920 nm. Images acquired through a cranial window were obtained using a 25×, 1.05 numerical aperture water-immersion objective with a 2-mm working distance (Olympus). Fluorescence was detected through GaAsP PMTs using the Fluoview acquisition software (Olympus), and images were collected in the green channel using a F30FGR bandpass filter (Semrock). Z -stacks were acquired (640 × 640 px, 4-µs pixel dwell time, 1-μm step size) with 3× digital zoom. Spine imaging experiments occurred under KX anesthesia (ketamine, 100 mg/mL, and xylazine, 10 mg/mL, at dosages of 0.1 mL/10 g body weight). Spine density of PFC neurons was determined by counting total spines per 100 µm from each of 95 and 101 dendritic segments and normalizing to the EGFP mean ( n = 2 and 3 mice for EGFP and mGreenLantern, respectively). Brightness of FP-Expressing Neurons Ex Vivo. Cell culture. Pregnant female mice were killed and hippocampus from E17 embryos were dissected. Following incubation in Trypsin-EDTA 0.25% for 10 min, hippocampal cells were mechanically dissociated with a fire-polished Pasteur pipette. Neurons were plated at 1.5 × 10 4 cells/cm 2 in 24-well poly- l -lysine–coated plates in plating media (MEM containing 2 mM glutamine, supplemented with 10% FBS, 1 mM pyruvate, 0.37% glucose, and 25 U/mL penicillin/streptomycin). Medium was changed within 2 to 24 h of plating to a serum-free medium containing Neurobasal with B-27 supplement, 0.5 mM glutamine, 25 µM glutamate, and 25 U/mL penicillin/streptomycin and AraC (cytosine-1-B- d -arabinofuranoside). Cells were maintained at 37 °C and 5% CO 2 . Primary hippocampal neurons were infected at DIV10 with AAV2/1-CAG-EGFP or mGreenLantern virus diluted to 2.5 × 10 9 particles/mL (Duke Viral Vector Core) in the same media. After 4 d (DIV14) of viral infection, cells were fixed for immunocytochemistry. All reagents used to prepare primary neuronal cultured were purchased from Thermo Fisher, except glucose, which was from Sigma. Immunocytochemistry. After 4 d of viral infection, cells were briefly washed with Hanks’ balanced salt solution (HBSS) (Thermo Fisher) and fixed with prewarmed 4% PFA/4% sucrose solution for 15 min at room temperature, protected from light. After fixation, cells were washed several times with HBSS. Coverslips were mounted with ProLong Gold antifade reagent (Invitrogen), and imaging was performed within 48 h of fixation. Neuronal imaging and analysis. Imaging was performed within 48 h of fixation using a Nikon TE2000 inverted fluorescence microscope equipped with a 60× oil objective and ANDOR camera (Zyla Camera sCMOS). For fluorescence quantitation, 20 random images were acquired per coverslip under the same acquisition parameters for all samples. Background was subtracted using NIS-Elements AR (version 4.20) software before quantitation. Statistical analysis was performed using GraphPad Prism, version 8.2.0, software. Statistical significance was considered at * P < 0.05, ** P < 0.01, and *** P < 0.001 between the means of a minimum of three cultures per conditions using Student’s t test. Results are expressed as mean ± SEM. All experiments were performed with at least three independent neuronal primary cultures.
📊 Figures
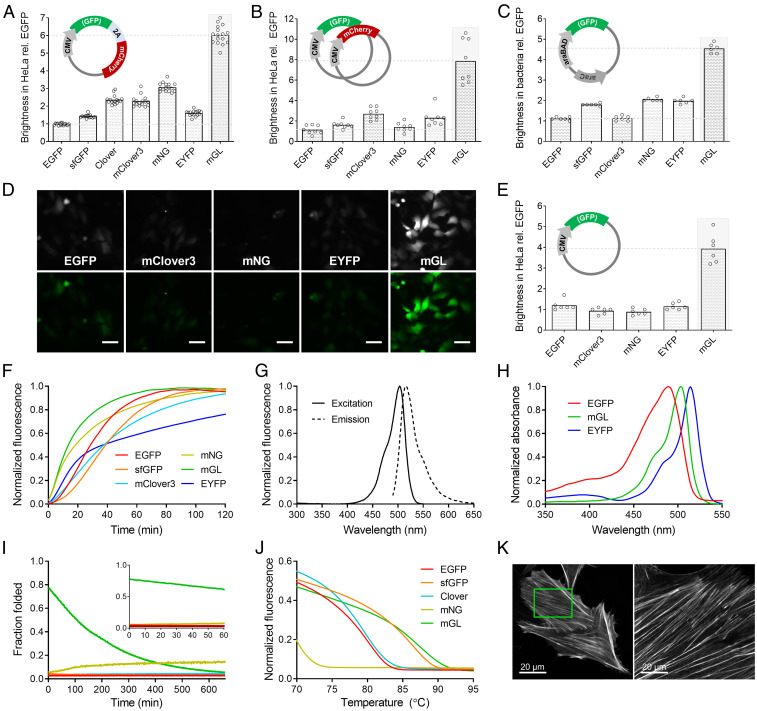
Fig. 1.
Biochemical properties and brightness of FPs in cultured cells. ( A ) Brightness of FPs in HeLa cells 48 h after transfection with a single coexpression plasmid that produces an FP and mCherry in a 1:...
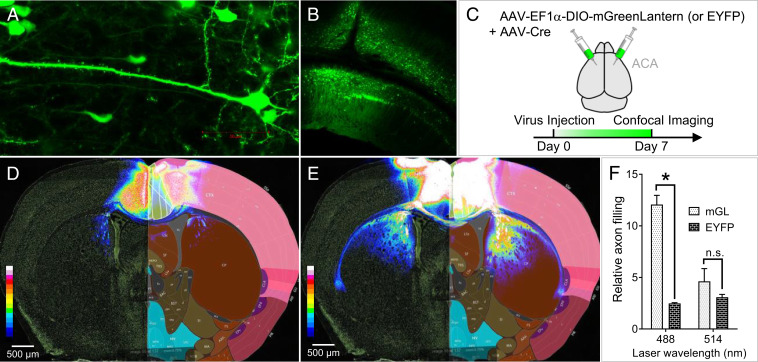
Fig. 2.
mGreenLantern expresses efficiently in the mouse brain and robustly illuminates long-range neuronal projections. ( A ) At 7 d post injection (d.p.i.), individual mGreenLantern-expressing neurons of th...
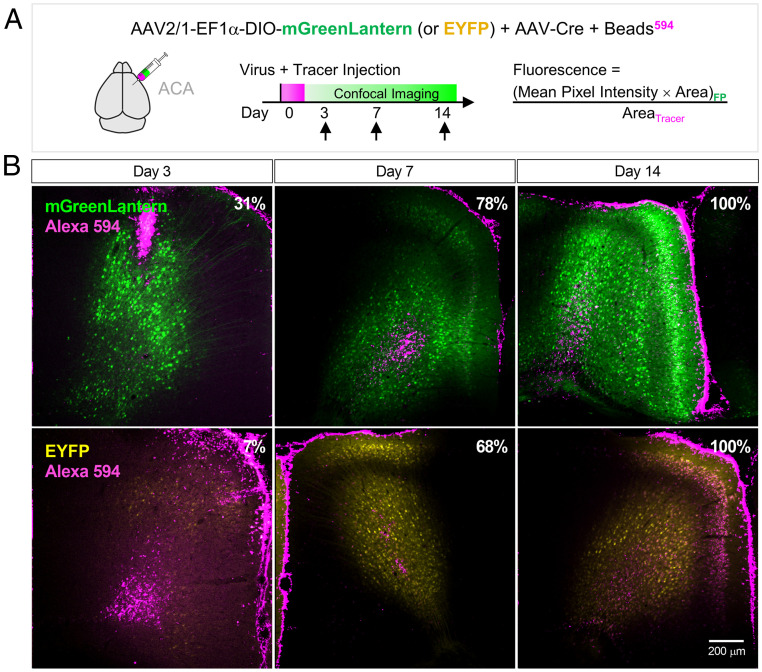
Fig. 3.
In vivo expression kinetics of virally transduced mGreenLantern and EYFP in mouse. ( A ) AAV2/1-EF1u03b1-DIO-mGreenLantern-WPRE-pA or EYFP virus co-injected with AAV-Cre and Alexa 594-coated latex bea...
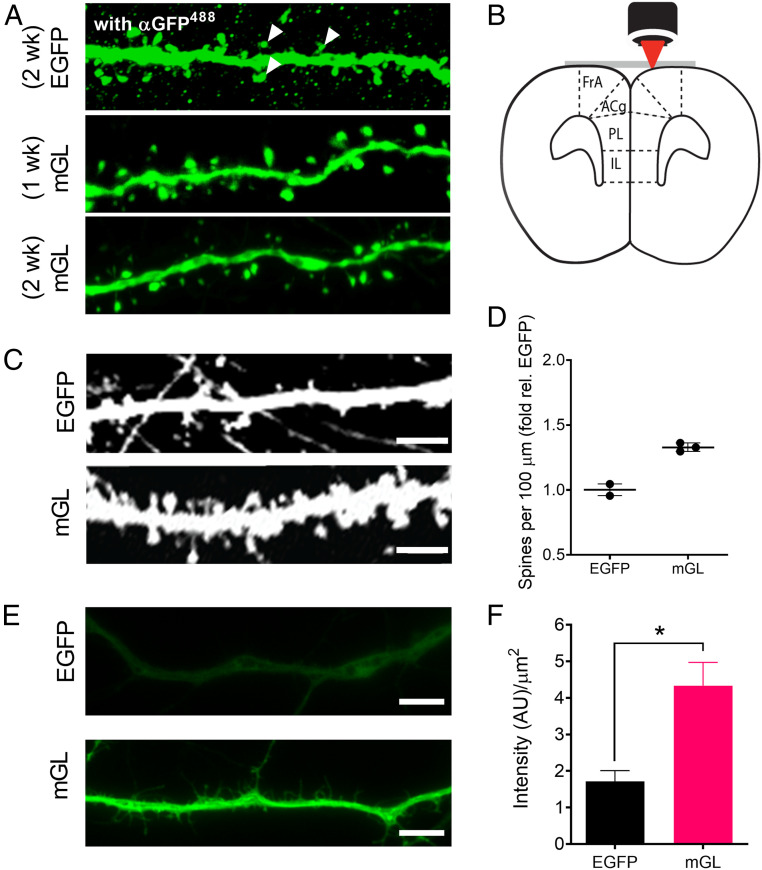
Fig. 4.
mGreenLantern (mGL) improves visualization of neuronal morphology in vivo and ex vivo. ( A ) Representative mGL-expressing neurons in ACA after 1- and 2-wk expression without antibody enhancement, com...
Figure images are served from the NIH/NLM PubMed Central Open Access Subset or Europe PMC; copyright remains with the publishers and authors.
💬 Discussion
0 commentsNo comments yet. Be the first to start a discussion!
Leave a Comment