Abstract
The γ-tubulin ring complex (γTuRC) is the major microtubule nucleator in cells. The mechanism of its regulation is not understood. We purified human γTuRC and measured its nucleation properties in a total internal reflection fluorescence (TIRF) microscopy-based real-time nucleation assay. We find that γTuRC stably caps the minus ends of microtubules that it nucleates stochastically. Nucleation is inefficient compared with microtubule elongation. The 4 Å resolution cryoelectron microscopy (cryo-EM) structure of γTuRC, combined with crosslinking mass spectrometry analysis, reveals an asymmetric conformation with only part of the complex in a "closed" conformation matching the microtubule geometry. Actin in the core of the complex, and MZT2 at the outer perimeter of the closed part of γTuRC appear to stabilize the closed conformation. The opposite side of γTuRC is in an "open," nucleation-incompetent conformation, leading to a structural asymmetry explaining the low nucleation efficiency of purified human γTuRC. Our data suggest possible regulatory mechanisms for microtubule nucleation by γTuRC closure.
🔬 Techniques
🧬 Organisms
✨ Fluorophores
🧪 Sample Preparation
🔬 Cell Lines
🏭 Microscope Brands
🧪 Reagent Suppliers
🔎 Objectives
💻 Software Details
📋 Protocols
💾 Data Repositories
🏷️ Research Resource Identifiers (RRIDs)
Verified research resources used in this paper:
🏛️ Research Organizations (ROR)
Affiliated research institutions:
📋 Methods
Key Resources Table REAGENT or RESOURCE SOURCE IDENTIFIER
Antibodies γ-tubulin, clone GTU-88 Sigma-Aldrich Cat#: T6557; RRID: AB_477584 mTagBFP Evrogen Cat#: AB233; RRID: AB_2571743 polyclonal rabbit anti-GCP2 antibody (amino acids 1-155) this study costum-made, Pettingill polyclonal rabbit anti-GCP4 antibody (amino acids: 1-745) this study costum-made Covalab mouse anti-HA, clone F-7 Santa Cruz Biotechnology Cat#: sc-7392; RRID: AB_627809 anti-rabbit WestVision Peroxidase Polymer antibody Vector Cat#: WB-1000; RRID: AB_2336860 goat anti-mouse immunoglobulins/HRP Agilent Cat#: P0447; RRID: AB_2617137 goat anti-mouse (H+L) antibody, FITC conjugate Sigma-Aldrich Cat#: 12-506; RRID: AB_390186 rabbit anti-actin, beta polyclonal antibody Abcam Cat# ab8227; RRID: AB_2305186 Bacterial and Virus Strains Bacterial strain for molecular cloning: Escherichia coli DH5α EMBL Strain name: DH5α Chemicals, Peptides, and Recombinant Proteins γTuRC-GCP2-mBFP-AviTag This study Corresponding recombinant DNA: pTC069 mGFP-EB3 Previously used by Roostalu et al. (2020) N/A mGFP-TPX2 Previously used by Roostalu et al. (2015) N/A chTOG-mGFP Previously used by Roostalu et al. (2015) N/A Pig brain tubulin Purified according to Castoldi and Popov (2003) N/A Catalase Sigma-Aldrich Cat#: C40 Glucose Oxidase Serva Cat#: 22778.01 Bovine Serum Albumin Sigma-Aldrich Cat#: 05470 κ-casein Sigma-Aldrich Cat#: C0406 NeutrAvidin LifeTechnologies Cat#: A2666 (3-Glycidyloxypropyl)trimethoxy-silane Sigma-Aldrich Cat#: 440167 Biotin-CONH-PEG-NH 2 (3000 Da) Rapp Polymere GmbH Cat#: 133000-25-20 HO-PEG-NH 2 (3000 Da) Rapp Polymere GmbH Cat#: 103000-20 Streptavidin-HRP Thermo Fisher Cat#: 21130 BS3 (bis(sulfosuccinimidyl)suberate) Thermo Fisher Cat#: 21586 Deposited Data Human γTuRC This study EMD-10744 Crosslinking mass spectrometry data This study PRIDE-PXD018106 Experimental Models: Cell Lines HeLa Kyoto cells for recombinant GCP2-mBFP-AviTag expression Cell services, Francis Crick Institute CVCL_1922 Oligonucleotides Primers for GCP2-mBFP-AviTag in pLVX-Puro: GGACTCAGATCT CGAATGAGTGAATTTCGGATTC ACCAT, TGATCAGTTCTTCGCT TCCGCCTCCTCCGCCCTCGTG CCACTCGATCTTCTGAGCCTCG AAGATGTCGTTCAGACCGCCCT GAAAATACAGGTTTTCTCCGCC TCCTCCGCCCTGTGCGGTGAC TGCGACC, AGCGAAGAACTGA TCAAAGAAAAC, GGTAGAATTA TCTAGTCAGTTCAGTTTATGAC CCAGTTT Sigma-Aldrich N/A Primers for HA-BirA in pLVX-IRES-Hyg: CGGTGAATTCCT CGAATGTACCCATACGATG TTCCAGATTACGCTGGCGG AGGAGGCGGAAAGGATAAC ACCGTGCCACTG, AGAGGG GCGGGATCTTATTATTTTTCT GCACTACGCAGG Sigma-Aldrich N/A Recombinant DNA pTC069 (pLVX-Puro-GCP2-mGFP-AviTag) This study cDNA from Origene (NCBI Reference Sequence: NM_001256617.1 ) pTC070 (pLVX-IRES-Hyg-HA-BirA) This study BirA sequence taken from plasmid pJR284 Software and Algorithms Fiji for image analysis NIH, USA https://fiji.sc/ Matlab for image alignment MathWorks https://www.mathworks.com/products/matlab.html RELION-3.0 Scheres, 2012 , Zivanov et al., 2018 https://www2.mrc-lmb.cam.ac.uk/relion/index.php?title=Main_Page EMAN2 v2.07 Tang et al., 2007 https://blake.bcm.edu/emanwiki/EMAN2 Gctf v.1.18 Zhang, 2016 https://doi.org/10.1016/j.jsb.2015.11.003 MotionCor2 Zheng et al., 2017 https://msg.ucsf.edu/em/software/motioncor2.html crYOLO (SPHIRE Package) Wagner et al., 2019 https://msg.ucsf.edu/em/software/motioncor2.html cryoSPARC v2 Punjani et al., 2017 https://www.nature.com/articles/nmeth.4169 PHENIX v1.13 Adams et al., 2010 , Afonine et al., 2018 , Terwilliger et al., 2019 http://www.phenix-online.org/ UCSF Chimera Pettersen et al., 2004 https://www.cgl.ucsf.edu/chimera/ iTasser Roy et al., 2010 https://www.nature.com/articles/nprot.2010.5 Coot v0.8.8 Emsley et al., 2010 http://scripts.iucr.org/cgi-bin/paper?S0907444910007493 Namdinator Kidmose et al., 2019 http://journals.iucr.org/m/issues/2019/04/00/eh5002/index.html xiSEARCH Mendes et al., 2019 https://www.rappsilberlab.org/software/xisearch xiFDR Fischer and Rappsilber, 2017 https://www.rappsilberlab.org/software/xifdr Other HiPrep 26/10 Desalting column GE Healthcare Cat#: 17508701 HiTrap Desalting column GE Healthcare Cat#: 17140801 HiTrap SP Sepharose FF column GE Healthcare Cat#: 17505401 Streptavidin mutein matrix Sigma-Aldrich Cat#: 3708152001 Superose 6 10/300 GL column GE Healthcare Cat#: 29091596 Superdex Peptide 3.2/300 column GE Healthcare N/A Lacey grids (400 mesh) with a layer of ultra-thin carbon Agar Scientific Cat#: AGS187-4 50-centimetre EASY-Spray C18 LC column Thermo Scientific N/A Resource Availability Lead Contact Further information and requests for resources and reagents should be directed to and will be fulfilled by the Lead Contact Thomas Surrey ( thomas.surrey@crg.eu ).
Show full methods section
Key Resources Table REAGENT or RESOURCE SOURCE IDENTIFIER
Antibodies γ-tubulin, clone GTU-88 Sigma-Aldrich Cat#: T6557; RRID: AB_477584 mTagBFP Evrogen Cat#: AB233; RRID: AB_2571743 polyclonal rabbit anti-GCP2 antibody (amino acids 1-155) this study costum-made, Pettingill polyclonal rabbit anti-GCP4 antibody (amino acids: 1-745) this study costum-made Covalab mouse anti-HA, clone F-7 Santa Cruz Biotechnology Cat#: sc-7392; RRID: AB_627809 anti-rabbit WestVision Peroxidase Polymer antibody Vector Cat#: WB-1000; RRID: AB_2336860 goat anti-mouse immunoglobulins/HRP Agilent Cat#: P0447; RRID: AB_2617137 goat anti-mouse (H+L) antibody, FITC conjugate Sigma-Aldrich Cat#: 12-506; RRID: AB_390186 rabbit anti-actin, beta polyclonal antibody Abcam Cat# ab8227; RRID: AB_2305186 Bacterial and Virus Strains Bacterial strain for molecular cloning: Escherichia coli DH5α EMBL Strain name: DH5α Chemicals, Peptides, and Recombinant Proteins γTuRC-GCP2-mBFP-AviTag This study Corresponding recombinant DNA: pTC069 mGFP-EB3 Previously used by Roostalu et al. (2020) N/A mGFP-TPX2 Previously used by Roostalu et al. (2015) N/A chTOG-mGFP Previously used by Roostalu et al. (2015) N/A Pig brain tubulin Purified according to Castoldi and Popov (2003) N/A Catalase Sigma-Aldrich Cat#: C40 Glucose Oxidase Serva Cat#: 22778.01 Bovine Serum Albumin Sigma-Aldrich Cat#: 05470 κ-casein Sigma-Aldrich Cat#: C0406 NeutrAvidin LifeTechnologies Cat#: A2666 (3-Glycidyloxypropyl)trimethoxy-silane Sigma-Aldrich Cat#: 440167 Biotin-CONH-PEG-NH 2 (3000 Da) Rapp Polymere GmbH Cat#: 133000-25-20 HO-PEG-NH 2 (3000 Da) Rapp Polymere GmbH Cat#: 103000-20 Streptavidin-HRP Thermo Fisher Cat#: 21130 BS3 (bis(sulfosuccinimidyl)suberate) Thermo Fisher Cat#: 21586 Deposited Data Human γTuRC This study EMD-10744 Crosslinking mass spectrometry data This study PRIDE-PXD018106 Experimental Models: Cell Lines HeLa Kyoto cells for recombinant GCP2-mBFP-AviTag expression Cell services, Francis Crick Institute CVCL_1922 Oligonucleotides Primers for GCP2-mBFP-AviTag in pLVX-Puro: GGACTCAGATCT CGAATGAGTGAATTTCGGATTC ACCAT, TGATCAGTTCTTCGCT TCCGCCTCCTCCGCCCTCGTG CCACTCGATCTTCTGAGCCTCG AAGATGTCGTTCAGACCGCCCT GAAAATACAGGTTTTCTCCGCC TCCTCCGCCCTGTGCGGTGAC TGCGACC, AGCGAAGAACTGA TCAAAGAAAAC, GGTAGAATTA TCTAGTCAGTTCAGTTTATGAC CCAGTTT Sigma-Aldrich N/A Primers for HA-BirA in pLVX-IRES-Hyg: CGGTGAATTCCT CGAATGTACCCATACGATG TTCCAGATTACGCTGGCGG AGGAGGCGGAAAGGATAAC ACCGTGCCACTG, AGAGGG GCGGGATCTTATTATTTTTCT GCACTACGCAGG Sigma-Aldrich N/A Recombinant DNA pTC069 (pLVX-Puro-GCP2-mGFP-AviTag) This study cDNA from Origene (NCBI Reference Sequence: NM_001256617.1 ) pTC070 (pLVX-IRES-Hyg-HA-BirA) This study BirA sequence taken from plasmid pJR284 Software and Algorithms Fiji for image analysis NIH, USA https://fiji.sc/ Matlab for image alignment MathWorks https://www.mathworks.com/products/matlab.html RELION-3.0 Scheres, 2012 , Zivanov et al., 2018 https://www2.mrc-lmb.cam.ac.uk/relion/index.php?title=Main_Page EMAN2 v2.07 Tang et al., 2007 https://blake.bcm.edu/emanwiki/EMAN2 Gctf v.1.18 Zhang, 2016 https://doi.org/10.1016/j.jsb.2015.11.003 MotionCor2 Zheng et al., 2017 https://msg.ucsf.edu/em/software/motioncor2.html crYOLO (SPHIRE Package) Wagner et al., 2019 https://msg.ucsf.edu/em/software/motioncor2.html cryoSPARC v2 Punjani et al., 2017 https://www.nature.com/articles/nmeth.4169 PHENIX v1.13 Adams et al., 2010 , Afonine et al., 2018 , Terwilliger et al., 2019 http://www.phenix-online.org/ UCSF Chimera Pettersen et al., 2004 https://www.cgl.ucsf.edu/chimera/ iTasser Roy et al., 2010 https://www.nature.com/articles/nprot.2010.5 Coot v0.8.8 Emsley et al., 2010 http://scripts.iucr.org/cgi-bin/paper?S0907444910007493 Namdinator Kidmose et al., 2019 http://journals.iucr.org/m/issues/2019/04/00/eh5002/index.html xiSEARCH Mendes et al., 2019 https://www.rappsilberlab.org/software/xisearch xiFDR Fischer and Rappsilber, 2017 https://www.rappsilberlab.org/software/xifdr Other HiPrep 26/10 Desalting column GE Healthcare Cat#: 17508701 HiTrap Desalting column GE Healthcare Cat#: 17140801 HiTrap SP Sepharose FF column GE Healthcare Cat#: 17505401 Streptavidin mutein matrix Sigma-Aldrich Cat#: 3708152001 Superose 6 10/300 GL column GE Healthcare Cat#: 29091596 Superdex Peptide 3.2/300 column GE Healthcare N/A Lacey grids (400 mesh) with a layer of ultra-thin carbon Agar Scientific Cat#: AGS187-4 50-centimetre EASY-Spray C18 LC column Thermo Scientific N/A Resource Availability Lead Contact Further information and requests for resources and reagents should be directed to and will be fulfilled by the Lead Contact Thomas Surrey ( thomas.surrey@crg.eu ).
Materials Availability
Plasmids and the cell line generated in this study are available upon request.
Data and Code Availability
The electron microscopy map has been deposited to the Electron Microscopy Data Bank under accession numbers EMD-10744. The mass spectrometry proteomics data have been deposited to the ProteomeXchange Consortium via the PRIDE partner repository with the dataset identifier PXD018106.
Experimental Model and Subject Details Escherichia coli bacterial strains
DH5a and DH10MultiBac were grown in Luria Bertani (LB) medium in the appropriate antibiotics.
HeLa-Kyoto cells
(RRID:CVCL_1922) were cultured at 37°C (10% CO 2 ) in Dulbecco's Modified Eagle Medium (DMEM) supplemented with 10% fetal bovine serum, 50 U mL -1 penicillin and 50 μg mL -1 streptomycin. Absence of mycoplasma contamination was verified regularly.
Method Details Lentivirus Expression
Constructs and Molecular Biology To generate a fluorescently-tagged and biotinylatable human γTuRC, the coding region for full-length human GCP2 (amino acids 1-902) was amplified by PCR using its cDNA as template ( NM_001256617.1 , Origene). The mTagBFP (blue fluorescent protein, Evrogen) coding sequence was also amplified by PCR. Both PCR-amplified sequences were cloned into a pLVX-Puro vector (Clonetech) using Gibson assembly (In-Fusion cloning, Takara), to form GCP2_G 5 A_TEV_G 5 A_mTagBFP_G 5 A_BAP, an expression construct for GCP2 which is C-terminally tagged with mTagBFP and biotin acceptor peptide (BAP: GLNDIFEAQKIEWHE), both separated from GCP2 by a TEV protease cleavage site. Glycine linkers (G 5 A) were placed between sequences. To facilitate the in vivo biotinylation of tagged γTuRC E. coli biotin ligase BirA was cloned into a pLVX-IRES-Hyg vector (Clonetech) using Gibson assembly to form HA_ G 5 A_BirA; an expression construct of BirA with an HA-tag added to the BirA N-terminus, separated by a G 5 A-linker. Primers used for cloning are listed in the Key Resources Table .
Antibodies
Commercial and custom-made antibodies were used for the characterization of purified γTuRC by western blotting (see Key Resources Table ). Custom-made antibodies were raised against His 6 -tagged proteins expressed and purified from E. coli . Specific antibodies were affinity purified by standard methods using MBP-tagged proteins expressed and purified from E. coli and coupled to CNBr-beads (GE Healthcare). The specificity of custom-made antibodies was confirmed by western blotting against human cell lysate after RNAi depletion of target proteins for 72 h using the RNAiMAX Transfection procedure (Thermo Fisher) and the RNA oligonucleotide sequences described previously ( Cota et al., 2017 ). For detection of biotinylated proteins by western blot, peroxidase coupled streptavidin (streptavidin-HRP, Thermo Fisher) was used. Cell Culture and Cell Line Development To generate HeLa-Kyoto cells stably expressing biotinylated mTagBFP-tagged GCP2, cells were co-transduced with GCP2 and BirA lentivirus ( Abella et al., 2016 ) followed by hygromycin and puromycin selection. Resistant cells expressing mTagBFP were sorted by FACS (fluorescent assisted cell sorter) and cultured independently in 96 well plates. The isolated single-cell colonies were screened for HA-BirA expression by immunofluorescence staining (primary antibody: mouse anti-HA (F-7, Santa Cruz Biotechnology); secondary antibody: goat anti-mouse-FITC (Sigma)) and then using high throughput imaging (High throughput screening facility, Francis Crick Institute). The localisation of GCP2-mTagBFP-BAP was confirmed by live-cell fluorescence imaging using a spinning disc confocal microscope based on a NikonTI-E frame with a 100x 1.49 N.A. Nikon objective lens (Cairn Research, Faversham, UK). mTagBFP expressing colonies were further tested by western blotting to confirm the expression of GCP2-mTagBFP-BAP and HA-BirA. When producing large cell cultures for purification, three days before harvesting cells (using trypsination), D-biotin (Sigma Aldrich) was added to a final concentration of 50 μM. Cell pellets were stored at -80°C until further use.
Purification of Human γTuRC
Cells were resuspended in lysis buffer (50 mM HEPES, 150 mM KCl, 5 mM MgCl 2 , 1 mM EGTA, 1 mM DTT, 0.1 mM GTP, pH 7.4) containing protease inhibitors (complete EDTA-free protease inhibitor mix, Roche) and DNAse I (10 μg ml -1 , Sigma-Aldrich). Resuspended cells were lysed using a polytron tissue dispenser (3x90 s at 6.6x10 3 rpm) and lysate was clarified twice by centrifugation (17,000xg, 15 min, 4°C). Clarified lysate was filtered through three sets of filters with decreasing pore size: 1.2 μm (GE Healthcare), 0.8 μm (GE-Healthcare) and 0.45 μm (Millipore). The lysate was buffer exchanged into storage buffer (lysis buffer containing 0.02% (vol./vol.) Brij-35) over HiPrep 26/10 desalting columns to remove D-biotin from the lysate. Protein-containing fractions were pooled, supplemented with protease inhibitors and loaded onto a 1 mL HiTrap SP Sepharose FF column connected in tandem with 1 mL streptavidin mutein matrix beads (Sigma Aldrich) packed into a Tricorn 5/50 column (GE-Healthcare). The streptavidin mutein matrix column was washed with 30 mL storage buffer, 30 mL wash buffer (lysis buffer containing 200 mM KCl and 0.2% (vol./vol.) Brij-35) and 30 mL storage buffer. Proteins were eluted with storage buffer supplemented with 5 mM D-biotin. The buffer was then exchanged back into storage buffer using a HiTrap Desalting column. Protein-containing fractions were pooled and concentrated using Amicon centrifugal units (MWCO 30 , 000, Millipore), centrifuged (17,000xg, 10 min, 4°C) and separated by size exclusion chromatography using a Superose 6 10/300 GL column. γTuRC peak fractions were pooled, concentrated, ultracentrifuged (278,088.3xg, 10 min, 4°C), snap frozen and stored in liquid nitrogen. From 120 g of cell pellet typically ∼85 μg of tagged γTuRC were purified. Purification of Human chTOG-mGFP, mGFP-TPX2 and mGFP-EB3 GFP-tagged microtubule binders were purified as described ( Roostalu et al., 2015 , Roostalu et al., 2020 ). In brief, StrepTagII-chTOG-mGFP was expressed in Sf21 cells and affinity purified using a StrepTrap HP column. After removal of the N-terminal StrepTagII by tobacco etch virus (TEV) protease, chTOG-mGFP was further purified by size exclusion chromatography. StrepTagII-mGFP-TPX2 was expressed in Sf21 cells and affinity purified using a StrepTrap HP column. After removal of the N-terminal StrepTagII by TEV protease, mGFP-TPX2 was further purified by anion exchange chromatography and size exclusion chromatography. His 6 -tagged mGFP-EB3 was expressed in E. coli (BL21 pRIL) and affinity purified using a HiTrap Chelating column. After removal of the N-terminal His 6 -tag by TEV protease, mGFP-EB3 was further purified by size exclusion chromatography.
Tubulin Purification and Labelling
Porcine brain tubulin was purified and covalently labelled with NHS-biotin (Thermo Fisher) or NHS-CF640R (Sigma-Aldrich) using standard procedures ( Castoldi and Popov, 2003 , Hyman et al., 1991 ). CF640R-tubulin was labelled at a ratio of 0.4 fluorophores per tubulin dimer. LC-MS/MS Analysis of Fluorescently Tagged γTuRC Purified γTuRC was separated by SDS-PAGE and stained using InstantBlue (Expedeon). Protein bands were excised from the gel and analysed by the Francis Crick Institute Proteomics facility. Briefly, Tryptic peptides were analysed using a Q Exactive orbitrap mass spectrometer coupled to an Ultimate 3000 HPLC equipped with an EasySpray nano-source (Thermo Fisher Scientific). A one-hour method of MS1 orbitrap (60k resolution) followed by top 10 HCD MS2 (35k resolution) produced raw data files. Raw files were analysed in MaxQuant (v1.6.0.13) against the SwissProt Homo sapiens protein database (downloaded June 2019) using the iBAQ algorithm. The canonical GCP2 sequence was replaced with the construct sequence (GCP2-5xGly-TEV-5xGly-mBFP-5xGly-AviTag). Variable modifications of methionine oxidation and protein N-terminal acetylation along with a fixed modification of cysteine carbamidomethylation were selected. The proteingroups.txt file was imported in Perseus (v1.4.0.2) for data analysis. Potential contaminants, reverse sequences and proteins identified by site were removed. iBAQ intensities were log 2 transformed. γTuRC-Mediated Microtubule Nucleation Assay To study microtubule nucleation by γTuRC, we modified a previous TIRF microscopy-based surface nucleation assay without γTuRC ( Roostalu et al., 2015 ). Flow chambers were assembled from one biotin-polyethylene glycol (PEG)-functionalized coverglass and one poly(L-lysine)-PEG-passivated counter glass. Biotin-PEG-functionalized glass was prepared essentially as described ( Bieling et al., 2010 ), with some modifications. In brief, 22 x 22 mm coverglasses (Menzel Gläser; #1.5) were sonicated in 3 M NaOH for 30 min, rinsed with Milli-Q water, sonicated in Piranha solution (95-97% H 2 SO 4 /30% H 2 O 2 (3/2 (vol./vol.))) for 45 min in a fume hood, washed with Milli-Q water, sonicated for 5 min in Milli-Q water, and washed again in Milli-Q water. After spin-drying, sandwiches consisting of two coverglasses with (3-Glycidyloxypropyl)trimethoxy-silane (GOPTS) (Sigma Aldrich; 440167) in between them were kept at 75°C for 30 min, left to cool for 15 min before glass sandwiches were separated. After being kept in acetone for 2 x 15 min, coverglasses were spin-dried and assembled into another sandwich with ∼50 mg of PEG mix (biotin-CONH-PEG-NH 2 (Rapp Polymere; 133000-25-20)/HO-PEG-NH 2 (Rapp Polymere; 10300-20) (1/10 (w/w))), ensuring that the pre-functionalized sides of the glasses are on the inside of the sandwich. Sandwiches were kept at 75°C overnight after removing any air from the inside of the sandwich. After separation, coverglasses were sonicated for 30 min in Milli-Q water, washed with Milli-Q water, spin-dried and stored at 4°C for a maximum of 2 months. Poly(L-lysine)-PEG-passivated counter glass was prepared by spreading 10 μL of 2 mg/mL Poly(L-lysine)-PEG (SuSoS) between two strips of double-sided tape (placed ∼5 mm apart parallel to one another) on a microscopy glass (76x26 mm, VWR, 631-1550P) and left to dry for at least 20 min. The glass was washed with water and dried with N 2 . For a microscopy assay, a flow chamber consisting of one biotin-PEG-coverglass and a poly(L-lysine)-PEG counter glass was incubated for 10 min with 5% Pluronic F-127 (Sigma Aldrich) in MilliQ water, washed with assay buffer (AB: 80 mM PIPES, 60 mM KCl, 1 mM EGTA, 1 mM MgCl 2 , 1 mM GTP, 5 mM 2-mercaptoethanol, 0.15% (w/vol.) methylcellulose (4,000 cP, Sigma-Aldrich) 1% (w/vol.) glucose, 0.02% (vol./vol.) Brij-35)) supplemented with 50 μg mL -1 κ-casein (Sigma-Aldrich), followed by a 3-min incubation with the same buffer additionally containing 50 μg mL -1 of NeutrAvidin (Life Technologies). The chamber was subsequently washed with γTuRC storage buffer and incubated for 5 min with prediluted γTuRC in γTuRC storage buffer to the concentration indicated for each experiment. Unbound γTuRC was removed by washing the flow cell with AB. Then the final assay mix was passed through, the chamber was sealed with vacuum grease (Beckman) and placed onto the microscope. Final assay mix: AB supplemented with oxygen scavengers (160 μg mL -1 catalase (Sigma-Aldrich), 680 μg mL -1 glucose oxidase (Serva)) diluted in BRB80 (80mM PIPES, 1mM EGTA, 1mM MgCl 2 ), 1 mg ml -1 bovine serum albumin (Sigma-Aldrich) in BRB80, varying concentrations of tubulin (containing 4.8% CF640R-labelled tubulin). For experiments with microtubule binders 2.9% (vol./vol.) of either chTOG-mGFP, mGFP-TPX2 or mGFP-EB3 was added at different concentrations. chTOG-mGFP and mGFP-TPX2 concentrations were altered by predilution in their storage buffers ( Jha et al., 2017 , Roostalu et al., 2015 ). mGFP-EB3 was diluted in BRB80. The final assay mix containing chTOG-GFP was ultracentrifuged (278,088.03xg, 10 min, 4°C) before flowing the mix into the chamber. To keep the buffer composition of the final assay mix unchanged within a set of experiments and to allow for direct comparisons between experiments, the overall BRB80 and storage buffer content was kept constant within one set of experiments. Microtubule Dynamics Assays Using 'Seeds' To image the properties of microtubules having both dynamic plus and minus ends, microtubules were grown from pre-polymerized and immobilized GMPCPP-stabilized microtubules ('seeds'). Dynamics assays were performed as nucleation assays, but instead of γTuRC biotinylated and fluorescently labelled microtubule seeds were bound to the glass surface. Seeds were prepared as described previously ( Bieling et al., 2010 ), here containing 39% CF640R-labelled tubulin. In brief, 6.7 μM tubulin, 5 μM biotinylated tubulin and 7.1 μM CF640R-labelled tubulin and 0.5 μM GMPCPP (Jena bioscience, NU-405S) in BRB80 was incubated for 1 h at 37°C, diluted 8.33-fold with prewarmed BRB80 and centrifuged at 17,000 g at room temperature for 10 min. The pellet was resuspended in prewarmed BRB80 and centrifuged at 17,000 g for 2 min, followed again by resuspension of the pellet in prewarmed BRB80. Microtubule seeds were kept at room temperature and used on the same day.
TIRF Microscopy
All experiments were performed using a total internal reflection fluorescence (TIRF) microscope (Cairn Research, Faversham, UK) ( Hannabuss et al., 2019 ). Experiments were imaged 2 min after placing the chamber on the microscope. The temperature was kept at 33±1°C for all experiments. Two- and three-colour time-lapse imaging for γTuRC nucleation assays and dynamics assays were performed at 1 frame/5 s with a 300-ms exposure time for tubulin (640 nm) and GFP (480 nm) channels and 1000-ms for γTuRC-mBFP (408 nm) using a 60x 1.49 NA Nikon objective lens. For single molecule γTuRC assays shown in Figure 2 F, images were acquired at 1 frame/1.8 s with a 500-ms exposure time using a 100x 1.49 N.A. Nikon objective lens. CF640R-tubulin (640 nm excitation) and mGFP-tagged proteins (488 nm excitation) were imaged simultaneously. γTuRC-mTagBFP-BAP (405 nm excitation) was imaged every 10 frames for single molecule γTuRC assays and once at the beginning and at the end of the movie for γTuRC nucleation assays. TIRF Microscopy Image Processing The Fiji package of ImageJ was used to generate kymographs (space-time plots) and to merge image sequences from different channels. For multi-colour imaging, image alignment was performed using a Matlab script ( Maurer et al., 2014 ). Background was subtracted using the background subtraction tool of Fiji (‘rolling ball’ method). For movies from single molecule γTuRC assays shown in Figure 2 F γTuRC-mTagBFP-AviTag images were merged using the ‘grouped Z project’ function in Fiji. To subtract camera noise an empty flow chamber was imaged using the same imaging conditions. The background image was generated as described above and subtracted from the γTuRC-mTagBFP-AviTag image, which was then used to merge with images of CF640R-tubulin. Microtubule Growth Speeds Growth speeds were measured directly from kymographs using the ‘Resclice function’ in Fiji. Lines were drawn manually along growing plus- and minus-ends. Growth speeds were calculated from the slope of the line. The total number of microtubules used for the measurement of growth speeds for each experimental condition is stated in the corresponding figure legend and data was pooled from at least three independent experiments if not stated otherwise. For conditions with high nucleation rates, at least 50 microtubules per experimental repeat were analysed. For condition with low nucleation rates, all microtubules with a minimum lifetime of ∼2 min were used for analysis.
Microtubule Nucleation Rate Analysis
For each nucleation assay, microtubules were counted manually at 10 different time points either until the end of the movie or until individual microtubule nucleation events could no longer be identified due to overcrowding. The total number of nucleated microtubules in a field of view at a given time point was obtained by counting the newly nucleated microtubules and adding it to the number obtained at the previous analysed time point. Microtubule numbers were tracked using the ‘Point tool’ together with the ‘ROI manager tool’ in Fiji. For the quantification of γTuRC-mediated microtubule nucleation rates, only microtubules were counted that started nucleating from the surface and that stayed surface-attached. Microtubule nucleation rates represent the slope of the linear regression for each condition and are given in number per nucleated microtubules per field of view and per time. Negative Stain Grid Preparation and Data Collection A 4-μl droplet of human γTuRC (purified as described above) diluted in γTuRC storage buffer was applied to a freshly glow-discharged carbon-coated grid (C300Cu100, EM Resolution) and incubated for 2 min. The grid was stained with consecutive applications onto three 50-μl droplets of 2% uranyl acetate solution for 30 s each. The grid was then blotted dry and stored until imaged on a 120 keV G2 Spirit transmission electron microscope (FEI) equipped with a 2k×2k Ultrascan-1000 camera (Gatan). The Micrographs were collected using a nominal magnification of 30,000x, resulting in a pixel size of 3.45 Å at the specimen level.
Cryo Grid Preparation and Data Collection
Freeze-thawed human γTuRC (purified as described above) was briefly spun to remove aggregates. Lacey grids (400 mesh) with a layer of ultra-thin carbon (Agar Scientific) were glow-discharged at 45 mA for 1 min using a K100X Glow Discharge Unit (EMS). A 4 μl-droplet was then applied directly onto the carbon-side of the grid loaded into the humidity chamber of a Vitrobot Mark IV (Thermo Fisher) set to room temperature and 90% humidity. After an incubation time of 60 seconds, the grid was blotted for 3s and plunged into liquid ethane. The ice quality was assessed on a 200 kV Talos Arctica (Thermo Fisher) and a small dataset was collected to evaluate the sample quality. The highest-quality grid was imaged using a 300kV Titan Krios electron microscope (Thermo Fisher) using a GIF Quantum energy filter (Gatan) and a K2 Summit direct detector (Gatan), operated in counting mode. A total of 2,4000 movies were collected over two sessions at a pixel size of 1.08 Å/px with a total dose of ∼50 e−/A2 and a defocus range of -1.0 - -3.5 μm.
Negative Stain Electron Microscopy Image Processing
The particles were picked using e2boxer.py of the EMAN2 v2.07 software package ( Tang et al., 2007 ), using the semi-automated (swarm) option. Box files were then imported in the RELION-3.0 ( Zivanov et al., 2018 ), which was used for all downstream image processing steps that were performed. Contrast transfer function parameters were determined using Gctf v.1.18 ( Zhang, 2016 ), and extracted particles were subjected to two-dimensional classification.
Cryo-EM Image Processing
To correct for beam-induced movements all movie frames were aligned using dose-weighted averaging in MotionCor2( Zheng et al., 2017 ). CTF parameters were estimated using non-dose-weighted micrographs generated by Gctf v.1.18 ( Zhang, 2016 ). Automated particle-picking was performed using crYOLO of the SPHIRE software package ( Wagner et al., 2019 ). Box files were imported in RELION-3 ( Zivanov et al., 2018 ) and a total of ∼ 1.1 million particles were initially binned by a factor of four and extracted from dose-weighted micrographs with a box size of 128 pixels. After several rounds of two-dimensional classification, a total of 522,496 high-resolution particles were selected, which evidently contained high-resolution information. Unbinned particles were re-extracted, using a 512-pixel box size. These particles were used to generate three reference free ab initio models using cryoSPARC v2 ( Punjani et al., 2017 ). The best model, which resulted from 229,744 particles, was imported in RELION-3, filtered to 60 Å and used as a starting reference for 3D classification of the 522,496 high-resolution particles. The combination of all particles yielded in the highest resolution class, which was subsequently subjected to one initial 3D refinement, followed by three rounds of CTF refinement and one Bayesian particle polishing step. Polished particles were subjected to one final round of CTF refinement, 3D refinement and post processing, yielding in a final 3D structure with an overall resolution of 4 Å. Further cryoEM density modification implemented in Phenix ( Terwilliger et al., 2019 ) increased the resolution to 3.7 Å (used for display in figures showing amino acid chains). Although BFP was present in the complex, fused to the C-terminus of GCP2, density for this tag was not visible in the cryo-EM structure, due to both flexibility and the mixture of tagged and untagged GCP2 found in the complex.
Generation of an Atomic Model
The crystal structure of human GCP4 (PDB entry 3RIP ) ( Guillet et al., 2011 ) was separated in three distinct domains and used for docking into the cryo-EM map, using the Fit in map option in UCSF Chimera ( Pettersen et al., 2004 ).
Highest correlation
GCP subunits were assigned to GCP4, while GCP3 was recognised because of a characteristic helical extension in the C-terminal γ-tubulin interacting domain, first modelled using iTasser ( Roy et al., 2010 ), adjusted manually in Coot ( Emsley et al., 2010 ) and refined using Phenix ( Afonine et al., 2018 ) and Namdinator ( Kidmose et al., 2019 ). Other GCP assignments were based on CLMS results (detailed below).
Crosslinking and Mass Spectrometry
The purified γTuRC complex at a concentration of 0.2 mg/ml in gel filtration buffer (50 mM HEPES pH 7.4, 150 mM KCl, 1 mM MgCl 2 , 1 mM EGTA, 1 mM DTT, 0.1 mM GTP and 0.02 % Brij-35) was crosslinked with 2.4 mM disulfosuccinimidyl suberate (BS3) in a thermomixer for 1 h at 24°C and 850 rpm. The reaction was quenched with 92 mM NH 4 HCO 3 in a thermomixer for 30 min at 24°C and 850 rpm. The crosslinked sample was cold-acetone precipitated. The dried protein pellet was resolubilized in 40 μL digestion buffer (8M urea in 100 mM ammonium bicarbonate (ABC) with 1 mM Dithiothreitol (DTT)) to an estimated protein concentration of 1 mg/mL. Dissolved protein sample was reduced by addition of 0.2 uL 1M DTT, the reduction reaction was incubated at room temperature for 30 minutes. The free -SH groups in the sample were then alkylated by adding 1.2 uL 500 mM Iodoacetamide (IAA) and incubating at room temperature for 20 minutes. After alkylation, 0.2 uL 1M DTT was added to quench excess of IAA. Subsequently, protein sample was digested with LysC (with 1:50 (m/m) protein to protease ratio) at room temperature for four hours. The sample was then diluted with 100 mM ABC to reach urea concentration of 1.5 M. Trypsin was added with 1:50 (m/m) protein to protease ratio to further digest proteins for over night (∼15 hours) at room temperature. Resulting peptides were de-salted using C18 StageTips (PMID: 17703201 ). 20% of total peptides were directly analysed by liquid chromatography–tandem mass spectrometry (LC-MS/MS) in duplicate. The remaining 80% peptides were fractionated using size exclusion chromatography in order to enrich for crosslinked peptides (PMID: 24356771 ). Peptides were separated using a Superdex Peptide 3.2/300 column (GE Healthcare) at a flow rate of 10 μl/min. The mobile phase consisted of 30% (v/v) acetonitrile and 0.1% trifluoroacetic acid. The earliest six peptide-containing fractions (50 μl each) were collected. Solvent was removed using a vacuum concentrator. The fractions were then analysed by LC-MS/MS. LC-MS/MS analysis was performed using an Orbitrap Fusion Lumos Tribrid mass spectrometer (Thermo Fisher Scientific), connected to an Ultimate 3000 RSLCnano system (Dionex, Thermo Fisher Scientific). Each SEC fraction was resuspended in 1.6% v/v acetonitrile 0.1% v/v formic acid and analysed with two LC-MS/MS acquisitions. Peptides were injected onto a 50-centimetre EASY-Spray C18 LC column (Thermo Scientific) that is operated at 50°C column temperature. Mobile phase A consists of water, 0.1% v/v formic acid and mobile phase B consists of 80% v/v acetonitrile and 0.1% v/v formic acid. Peptides were loaded and separated at a flowrate of 0.3 μL/min. Eluted peptides were ionized by an EASY-Spray source (Thermo Scientific) and introduced directly into the mass spectrometer. For non-fractionated samples, peptides were separated using a linear gradient going from 2% mobile phase B to 40% mobile phase B over 110 minutes, followed by a linear increase from 40% to 95% mobile phase B in eleven minutes. The MS data is acquired in the data-dependent mode with three-second acquisition cycle. The full scan mass spectrum was recorded in the Orbitrap with a resolution of 120,000. The ions with a charge state from 3+ to 7+ were isolated and fragmented using higher-energy collisional dissociation (HCD) with 30% collision energy. The fragmentation spectra were then recorded in the Orbitrap with a resolution of 50000. Dynamic exclusion was enabled with single repeat count and 60-second exclusion duration. The collected SEC fractions were each analysed with duplicated acquisitions. Peptides were separated by applying a gradient ranging from 2% to 45% B over 90 min. Gradient was optimized for each corresponding SEC fraction. Following the separating gradient, the content of B was ramped to 55% and 95% within 2.5 minutes each. The MS data is acquired in the data-dependent mode with the top-speed option. For each three-second acquisition cycle, the full scan mass spectrum was recorded in the Orbitrap with a resolution of 120,000. The ions with a charge state from 3+ to 7+ were isolated and fragmented using Higher-energy collisional dissociation (HCD). For each isolated precursor, one of three collision energy settings (26%, 28% or 30%) was selected for fragmentation using data dependent decision tree based on the m/z and charge of the precursor. The fragmentation spectra were then recorded in the Orbitrap with a resolution of 50000. Dynamic exclusion was enabled with single repeat count and 60-second exclusion duration. The MS2 peak lists were generated from the raw mass spectrometric data files using the MSConvert module in ProteoWizard (version 3.0.11729). The default parameters were applied, except that Top MS/MS Peaks per 100 Da was set to 20 and the de-noising function was enabled. Precursor and fragment m/z values were recalibrated. Identification of crosslinked peptides was carried out using xiSEARCH software ( https://www.rappsilberlab.org/software/xisearch ) (PMID: 31556486 ). Peak lists from all LC-MS/MS acquisitions were searched against the sequence and the reversed sequence of γTuRC subunits. The following parameters were applied for the search: MS accuracy = 5 ppm; MS2 accuracy = 10 ppm; enzyme = trypsin (with full tryptic specificity); allowed number of missed cleavages = two; missing monoisotopic peak=2 5; cross-linker = BS3 the reaction specificity for BS3 was assumed to be for lysine, serine, threonine, tyrosine and protein N termini); fixed modifications = carbamidomethylation on cysteine; variable modifications = oxidation on methionine, modifications by BS3 that are hydrolyzed or amidated on the end. Identified crosslinked peptide candidates were filtered using XiFDR (PMID: 28267312 ). A false discovery rate (FDR) of 2% on residue-pair-level was applied with “boost between” option selected. A list of identified crosslinked residue pairs is reported in Data S2 . Structural interpretation of inter-protein crosslinks was focused on protein pairs that were crosslinked with three or more residue pairs. The pseudo-atomic model of γTuRC complex was compared against the crosslinking data. The distances between the Cα atoms of crosslinked residue pairs in the model were measured and compared against a theoretical crosslinking limit of 30 Å for crosslinker BS3 (calculated based the spacer of the crosslinker and the length of the side chains of crosslinked residues).
Quantification and Statistical Analysis
Image analysis was performed with the Fiji package of ImageJ and Matlab. Plots were generated in GraphPad Prism. Data were pooled from at least three independently performed experiments if not stated otherwise. All error bars represent the standard error of mean (s.e.m.) or standard deviation (s.d.) as indicated in each Figure. Linear regression and curve fitting were performed using GraphPad Prism. Details of the analysis are given in the STAR Methods DETAIL section.
Materials Availability
Plasmids and the cell line generated in this study are available upon request.
Experimental Model and Subject Details Escherichia coli bacterial strains
DH5a and DH10MultiBac were grown in Luria Bertani (LB) medium in the appropriate antibiotics.
HeLa-Kyoto cells
(RRID:CVCL_1922) were cultured at 37°C (10% CO 2 ) in Dulbecco's Modified Eagle Medium (DMEM) supplemented with 10% fetal bovine serum, 50 U mL -1 penicillin and 50 μg mL -1 streptomycin. Absence of mycoplasma contamination was verified regularly.
Method Details Lentivirus Expression
Constructs and Molecular Biology To generate a fluorescently-tagged and biotinylatable human γTuRC, the coding region for full-length human GCP2 (amino acids 1-902) was amplified by PCR using its cDNA as template ( NM_001256617.1 , Origene). The mTagBFP (blue fluorescent protein, Evrogen) coding sequence was also amplified by PCR. Both PCR-amplified sequences were cloned into a pLVX-Puro vector (Clonetech) using Gibson assembly (In-Fusion cloning, Takara), to form GCP2_G 5 A_TEV_G 5 A_mTagBFP_G 5 A_BAP, an expression construct for GCP2 which is C-terminally tagged with mTagBFP and biotin acceptor peptide (BAP: GLNDIFEAQKIEWHE), both separated from GCP2 by a TEV protease cleavage site. Glycine linkers (G 5 A) were placed between sequences. To facilitate the in vivo biotinylation of tagged γTuRC E. coli biotin ligase BirA was cloned into a pLVX-IRES-Hyg vector (Clonetech) using Gibson assembly to form HA_ G 5 A_BirA; an expression construct of BirA with an HA-tag added to the BirA N-terminus, separated by a G 5 A-linker. Primers used for cloning are listed in the Key Resources Table .
Antibodies
Commercial and custom-made antibodies were used for the characterization of purified γTuRC by western blotting (see Key Resources Table ). Custom-made antibodies were raised against His 6 -tagged proteins expressed and purified from E. coli . Specific antibodies were affinity purified by standard methods using MBP-tagged proteins expressed and purified from E. coli and coupled to CNBr-beads (GE Healthcare). The specificity of custom-made antibodies was confirmed by western blotting against human cell lysate after RNAi depletion of target proteins for 72 h using the RNAiMAX Transfection procedure (Thermo Fisher) and the RNA oligonucleotide sequences described previously ( Cota et al., 2017 ). For detection of biotinylated proteins by western blot, peroxidase coupled streptavidin (streptavidin-HRP, Thermo Fisher) was used. Cell Culture and Cell Line Development To generate HeLa-Kyoto cells stably expressing biotinylated mTagBFP-tagged GCP2, cells were co-transduced with GCP2 and BirA lentivirus ( Abella et al., 2016 ) followed by hygromycin and puromycin selection. Resistant cells expressing mTagBFP were sorted by FACS (fluorescent assisted cell sorter) and cultured independently in 96 well plates. The isolated single-cell colonies were screened for HA-BirA expression by immunofluorescence staining (primary antibody: mouse anti-HA (F-7, Santa Cruz Biotechnology); secondary antibody: goat anti-mouse-FITC (Sigma)) and then using high throughput imaging (High throughput screening facility, Francis Crick Institute). The localisation of GCP2-mTagBFP-BAP was confirmed by live-cell fluorescence imaging using a spinning disc confocal microscope based on a NikonTI-E frame with a 100x 1.49 N.A. Nikon objective lens (Cairn Research, Faversham, UK). mTagBFP expressing colonies were further tested by western blotting to confirm the expression of GCP2-mTagBFP-BAP and HA-BirA. When producing large cell cultures for purification, three days before harvesting cells (using trypsination), D-biotin (Sigma Aldrich) was added to a final concentration of 50 μM. Cell pellets were stored at -80°C until further use.
Purification of Human γTuRC
Cells were resuspended in lysis buffer (50 mM HEPES, 150 mM KCl, 5 mM MgCl 2 , 1 mM EGTA, 1 mM DTT, 0.1 mM GTP, pH 7.4) containing protease inhibitors (complete EDTA-free protease inhibitor mix, Roche) and DNAse I (10 μg ml -1 , Sigma-Aldrich). Resuspended cells were lysed using a polytron tissue dispenser (3x90 s at 6.6x10 3 rpm) and lysate was clarified twice by centrifugation (17,000xg, 15 min, 4°C). Clarified lysate was filtered through three sets of filters with decreasing pore size: 1.2 μm (GE Healthcare), 0.8 μm (GE-Healthcare) and 0.45 μm (Millipore). The lysate was buffer exchanged into storage buffer (lysis buffer containing 0.02% (vol./vol.) Brij-35) over HiPrep 26/10 desalting columns to remove D-biotin from the lysate. Protein-containing fractions were pooled, supplemented with protease inhibitors and loaded onto a 1 mL HiTrap SP Sepharose FF column connected in tandem with 1 mL streptavidin mutein matrix beads (Sigma Aldrich) packed into a Tricorn 5/50 column (GE-Healthcare). The streptavidin mutein matrix column was washed with 30 mL storage buffer, 30 mL wash buffer (lysis buffer containing 200 mM KCl and 0.2% (vol./vol.) Brij-35) and 30 mL storage buffer. Proteins were eluted with storage buffer supplemented with 5 mM D-biotin. The buffer was then exchanged back into storage buffer using a HiTrap Desalting column. Protein-containing fractions were pooled and concentrated using Amicon centrifugal units (MWCO 30 , 000, Millipore), centrifuged (17,000xg, 10 min, 4°C) and separated by size exclusion chromatography using a Superose 6 10/300 GL column. γTuRC peak fractions were pooled, concentrated, ultracentrifuged (278,088.3xg, 10 min, 4°C), snap frozen and stored in liquid nitrogen. From 120 g of cell pellet typically ∼85 μg of tagged γTuRC were purified. Purification of Human chTOG-mGFP, mGFP-TPX2 and mGFP-EB3 GFP-tagged microtubule binders were purified as described ( Roostalu et al., 2015 , Roostalu et al., 2020 ). In brief, StrepTagII-chTOG-mGFP was expressed in Sf21 cells and affinity purified using a StrepTrap HP column. After removal of the N-terminal StrepTagII by tobacco etch virus (TEV) protease, chTOG-mGFP was further purified by size exclusion chromatography. StrepTagII-mGFP-TPX2 was expressed in Sf21 cells and affinity purified using a StrepTrap HP column. After removal of the N-terminal StrepTagII by TEV protease, mGFP-TPX2 was further purified by anion exchange chromatography and size exclusion chromatography. His 6 -tagged mGFP-EB3 was expressed in E. coli (BL21 pRIL) and affinity purified using a HiTrap Chelating column. After removal of the N-terminal His 6 -tag by TEV protease, mGFP-EB3 was further purified by size exclusion chromatography.
Tubulin Purification and Labelling
Porcine brain tubulin was purified and covalently labelled with NHS-biotin (Thermo Fisher) or NHS-CF640R (Sigma-Aldrich) using standard procedures ( Castoldi and Popov, 2003 , Hyman et al., 1991 ). CF640R-tubulin was labelled at a ratio of 0.4 fluorophores per tubulin dimer. LC-MS/MS Analysis of Fluorescently Tagged γTuRC Purified γTuRC was separated by SDS-PAGE and stained using InstantBlue (Expedeon). Protein bands were excised from the gel and analysed by the Francis Crick Institute Proteomics facility. Briefly, Tryptic peptides were analysed using a Q Exactive orbitrap mass spectrometer coupled to an Ultimate 3000 HPLC equipped with an EasySpray nano-source (Thermo Fisher Scientific). A one-hour method of MS1 orbitrap (60k resolution) followed by top 10 HCD MS2 (35k resolution) produced raw data files. Raw files were analysed in MaxQuant (v1.6.0.13) against the SwissProt Homo sapiens protein database (downloaded June 2019) using the iBAQ algorithm. The canonical GCP2 sequence was replaced with the construct sequence (GCP2-5xGly-TEV-5xGly-mBFP-5xGly-AviTag). Variable modifications of methionine oxidation and protein N-terminal acetylation along with a fixed modification of cysteine carbamidomethylation were selected. The proteingroups.txt file was imported in Perseus (v1.4.0.2) for data analysis. Potential contaminants, reverse sequences and proteins identified by site were removed. iBAQ intensities were log 2 transformed. γTuRC-Mediated Microtubule Nucleation Assay To study microtubule nucleation by γTuRC, we modified a previous TIRF microscopy-based surface nucleation assay without γTuRC ( Roostalu et al., 2015 ). Flow chambers were assembled from one biotin-polyethylene glycol (PEG)-functionalized coverglass and one poly(L-lysine)-PEG-passivated counter glass. Biotin-PEG-functionalized glass was prepared essentially as described ( Bieling et al., 2010 ), with some modifications. In brief, 22 x 22 mm coverglasses (Menzel Gläser; #1.5) were sonicated in 3 M NaOH for 30 min, rinsed with Milli-Q water, sonicated in Piranha solution (95-97% H 2 SO 4 /30% H 2 O 2 (3/2 (vol./vol.))) for 45 min in a fume hood, washed with Milli-Q water, sonicated for 5 min in Milli-Q water, and washed again in Milli-Q water. After spin-drying, sandwiches consisting of two coverglasses with (3-Glycidyloxypropyl)trimethoxy-silane (GOPTS) (Sigma Aldrich; 440167) in between them were kept at 75°C for 30 min, left to cool for 15 min before glass sandwiches were separated. After being kept in acetone for 2 x 15 min, coverglasses were spin-dried and assembled into another sandwich with ∼50 mg of PEG mix (biotin-CONH-PEG-NH 2 (Rapp Polymere; 133000-25-20)/HO-PEG-NH 2 (Rapp Polymere; 10300-20) (1/10 (w/w))), ensuring that the pre-functionalized sides of the glasses are on the inside of the sandwich. Sandwiches were kept at 75°C overnight after removing any air from the inside of the sandwich. After separation, coverglasses were sonicated for 30 min in Milli-Q water, washed with Milli-Q water, spin-dried and stored at 4°C for a maximum of 2 months. Poly(L-lysine)-PEG-passivated counter glass was prepared by spreading 10 μL of 2 mg/mL Poly(L-lysine)-PEG (SuSoS) between two strips of double-sided tape (placed ∼5 mm apart parallel to one another) on a microscopy glass (76x26 mm, VWR, 631-1550P) and left to dry for at least 20 min. The glass was washed with water and dried with N 2 . For a microscopy assay, a flow chamber consisting of one biotin-PEG-coverglass and a poly(L-lysine)-PEG counter glass was incubated for 10 min with 5% Pluronic F-127 (Sigma Aldrich) in MilliQ water, washed with assay buffer (AB: 80 mM PIPES, 60 mM KCl, 1 mM EGTA, 1 mM MgCl 2 , 1 mM GTP, 5 mM 2-mercaptoethanol, 0.15% (w/vol.) methylcellulose (4,000 cP, Sigma-Aldrich) 1% (w/vol.) glucose, 0.02% (vol./vol.) Brij-35)) supplemented with 50 μg mL -1 κ-casein (Sigma-Aldrich), followed by a 3-min incubation with the same buffer additionally containing 50 μg mL -1 of NeutrAvidin (Life Technologies). The chamber was subsequently washed with γTuRC storage buffer and incubated for 5 min with prediluted γTuRC in γTuRC storage buffer to the concentration indicated for each experiment. Unbound γTuRC was removed by washing the flow cell with AB. Then the final assay mix was passed through, the chamber was sealed with vacuum grease (Beckman) and placed onto the microscope. Final assay mix: AB supplemented with oxygen scavengers (160 μg mL -1 catalase (Sigma-Aldrich), 680 μg mL -1 glucose oxidase (Serva)) diluted in BRB80 (80mM PIPES, 1mM EGTA, 1mM MgCl 2 ), 1 mg ml -1 bovine serum albumin (Sigma-Aldrich) in BRB80, varying concentrations of tubulin (containing 4.8% CF640R-labelled tubulin). For experiments with microtubule binders 2.9% (vol./vol.) of either chTOG-mGFP, mGFP-TPX2 or mGFP-EB3 was added at different concentrations. chTOG-mGFP and mGFP-TPX2 concentrations were altered by predilution in their storage buffers ( Jha et al., 2017 , Roostalu et al., 2015 ). mGFP-EB3 was diluted in BRB80. The final assay mix containing chTOG-GFP was ultracentrifuged (278,088.03xg, 10 min, 4°C) before flowing the mix into the chamber. To keep the buffer composition of the final assay mix unchanged within a set of experiments and to allow for direct comparisons between experiments, the overall BRB80 and storage buffer content was kept constant within one set of experiments. Microtubule Dynamics Assays Using 'Seeds' To image the properties of microtubules having both dynamic plus and minus ends, microtubules were grown from pre-polymerized and immobilized GMPCPP-stabilized microtubules ('seeds'). Dynamics assays were performed as nucleation assays, but instead of γTuRC biotinylated and fluorescently labelled microtubule seeds were bound to the glass surface. Seeds were prepared as described previously ( Bieling et al., 2010 ), here containing 39% CF640R-labelled tubulin. In brief, 6.7 μM tubulin, 5 μM biotinylated tubulin and 7.1 μM CF640R-labelled tubulin and 0.5 μM GMPCPP (Jena bioscience, NU-405S) in BRB80 was incubated for 1 h at 37°C, diluted 8.33-fold with prewarmed BRB80 and centrifuged at 17,000 g at room temperature for 10 min. The pellet was resuspended in prewarmed BRB80 and centrifuged at 17,000 g for 2 min, followed again by resuspension of the pellet in prewarmed BRB80. Microtubule seeds were kept at room temperature and used on the same day.
TIRF Microscopy
All experiments were performed using a total internal reflection fluorescence (TIRF) microscope (Cairn Research, Faversham, UK) ( Hannabuss et al., 2019 ). Experiments were imaged 2 min after placing the chamber on the microscope. The temperature was kept at 33±1°C for all experiments. Two- and three-colour time-lapse imaging for γTuRC nucleation assays and dynamics assays were performed at 1 frame/5 s with a 300-ms exposure time for tubulin (640 nm) and GFP (480 nm) channels and 1000-ms for γTuRC-mBFP (408 nm) using a 60x 1.49 NA Nikon objective lens. For single molecule γTuRC assays shown in Figure 2 F, images were acquired at 1 frame/1.8 s with a 500-ms exposure time using a 100x 1.49 N.A. Nikon objective lens. CF640R-tubulin (640 nm excitation) and mGFP-tagged proteins (488 nm excitation) were imaged simultaneously. γTuRC-mTagBFP-BAP (405 nm excitation) was imaged every 10 frames for single molecule γTuRC assays and once at the beginning and at the end of the movie for γTuRC nucleation assays. TIRF Microscopy Image Processing The Fiji package of ImageJ was used to generate kymographs (space-time plots) and to merge image sequences from different channels. For multi-colour imaging, image alignment was performed using a Matlab script ( Maurer et al., 2014 ). Background was subtracted using the background subtraction tool of Fiji (‘rolling ball’ method). For movies from single molecule γTuRC assays shown in Figure 2 F γTuRC-mTagBFP-AviTag images were merged using the ‘grouped Z project’ function in Fiji. To subtract camera noise an empty flow chamber was imaged using the same imaging conditions. The background image was generated as described above and subtracted from the γTuRC-mTagBFP-AviTag image, which was then used to merge with images of CF640R-tubulin. Microtubule Growth Speeds Growth speeds were measured directly from kymographs using the ‘Resclice function’ in Fiji. Lines were drawn manually along growing plus- and minus-ends. Growth speeds were calculated from the slope of the line. The total number of microtubules used for the measurement of growth speeds for each experimental condition is stated in the corresponding figure legend and data was pooled from at least three independent experiments if not stated otherwise. For conditions with high nucleation rates, at least 50 microtubules per experimental repeat were analysed. For condition with low nucleation rates, all microtubules with a minimum lifetime of ∼2 min were used for analysis.
Microtubule Nucleation Rate Analysis
For each nucleation assay, microtubules were counted manually at 10 different time points either until the end of the movie or until individual microtubule nucleation events could no longer be identified due to overcrowding. The total number of nucleated microtubules in a field of view at a given time point was obtained by counting the newly nucleated microtubules and adding it to the number obtained at the previous analysed time point. Microtubule numbers were tracked using the ‘Point tool’ together with the ‘ROI manager tool’ in Fiji. For the quantification of γTuRC-mediated microtubule nucleation rates, only microtubules were counted that started nucleating from the surface and that stayed surface-attached. Microtubule nucleation rates represent the slope of the linear regression for each condition and are given in number per nucleated microtubules per field of view and per time. Negative Stain Grid Preparation and Data Collection A 4-μl droplet of human γTuRC (purified as described above) diluted in γTuRC storage buffer was applied to a freshly glow-discharged carbon-coated grid (C300Cu100, EM Resolution) and incubated for 2 min. The grid was stained with consecutive applications onto three 50-μl droplets of 2% uranyl acetate solution for 30 s each. The grid was then blotted dry and stored until imaged on a 120 keV G2 Spirit transmission electron microscope (FEI) equipped with a 2k×2k Ultrascan-1000 camera (Gatan). The Micrographs were collected using a nominal magnification of 30,000x, resulting in a pixel size of 3.45 Å at the specimen level.
Cryo Grid Preparation and Data Collection
Freeze-thawed human γTuRC (purified as described above) was briefly spun to remove aggregates. Lacey grids (400 mesh) with a layer of ultra-thin carbon (Agar Scientific) were glow-discharged at 45 mA for 1 min using a K100X Glow Discharge Unit (EMS). A 4 μl-droplet was then applied directly onto the carbon-side of the grid loaded into the humidity chamber of a Vitrobot Mark IV (Thermo Fisher) set to room temperature and 90% humidity. After an incubation time of 60 seconds, the grid was blotted for 3s and plunged into liquid ethane. The ice quality was assessed on a 200 kV Talos Arctica (Thermo Fisher) and a small dataset was collected to evaluate the sample quality. The highest-quality grid was imaged using a 300kV Titan Krios electron microscope (Thermo Fisher) using a GIF Quantum energy filter (Gatan) and a K2 Summit direct detector (Gatan), operated in counting mode. A total of 2,4000 movies were collected over two sessions at a pixel size of 1.08 Å/px with a total dose of ∼50 e−/A2 and a defocus range of -1.0 - -3.5 μm.
Negative Stain Electron Microscopy Image Processing
The particles were picked using e2boxer.py of the EMAN2 v2.07 software package ( Tang et al., 2007 ), using the semi-automated (swarm) option. Box files were then imported in the RELION-3.0 ( Zivanov et al., 2018 ), which was used for all downstream image processing steps that were performed. Contrast transfer function parameters were determined using Gctf v.1.18 ( Zhang, 2016 ), and extracted particles were subjected to two-dimensional classification.
Cryo-EM Image Processing
To correct for beam-induced movements all movie frames were aligned using dose-weighted averaging in MotionCor2( Zheng et al., 2017 ). CTF parameters were estimated using non-dose-weighted micrographs generated by Gctf v.1.18 ( Zhang, 2016 ). Automated particle-picking was performed using crYOLO of the SPHIRE software package ( Wagner et al., 2019 ). Box files were imported in RELION-3 ( Zivanov et al., 2018 ) and a total of ∼ 1.1 million particles were initially binned by a factor of four and extracted from dose-weighted micrographs with a box size of 128 pixels. After several rounds of two-dimensional classification, a total of 522,496 high-resolution particles were selected, which evidently contained high-resolution information. Unbinned particles were re-extracted, using a 512-pixel box size. These particles were used to generate three reference free ab initio models using cryoSPARC v2 ( Punjani et al., 2017 ). The best model, which resulted from 229,744 particles, was imported in RELION-3, filtered to 60 Å and used as a starting reference for 3D classification of the 522,496 high-resolution particles. The combination of all particles yielded in the highest resolution class, which was subsequently subjected to one initial 3D refinement, followed by three rounds of CTF refinement and one Bayesian particle polishing step. Polished particles were subjected to one final round of CTF refinement, 3D refinement and post processing, yielding in a final 3D structure with an overall resolution of 4 Å. Further cryoEM density modification implemented in Phenix ( Terwilliger et al., 2019 ) increased the resolution to 3.7 Å (used for display in figures showing amino acid chains). Although BFP was present in the complex, fused to the C-terminus of GCP2, density for this tag was not visible in the cryo-EM structure, due to both flexibility and the mixture of tagged and untagged GCP2 found in the complex.
Generation of an Atomic Model
The crystal structure of human GCP4 (PDB entry 3RIP ) ( Guillet et al., 2011 ) was separated in three distinct domains and used for docking into the cryo-EM map, using the Fit in map option in UCSF Chimera ( Pettersen et al., 2004 ).
Highest correlation
GCP subunits were assigned to GCP4, while GCP3 was recognised because of a characteristic helical extension in the C-terminal γ-tubulin interacting domain, first modelled using iTasser ( Roy et al., 2010 ), adjusted manually in Coot ( Emsley et al., 2010 ) and refined using Phenix ( Afonine et al., 2018 ) and Namdinator ( Kidmose et al., 2019 ). Other GCP assignments were based on CLMS results (detailed below).
Crosslinking and Mass Spectrometry
The purified γTuRC complex at a concentration of 0.2 mg/ml in gel filtration buffer (50 mM HEPES pH 7.4, 150 mM KCl, 1 mM MgCl 2 , 1 mM EGTA, 1 mM DTT, 0.1 mM GTP and 0.02 % Brij-35) was crosslinked with 2.4 mM disulfosuccinimidyl suberate (BS3) in a thermomixer for 1 h at 24°C and 850 rpm. The reaction was quenched with 92 mM NH 4 HCO 3 in a thermomixer for 30 min at 24°C and 850 rpm. The crosslinked sample was cold-acetone precipitated. The dried protein pellet was resolubilized in 40 μL digestion buffer (8M urea in 100 mM ammonium bicarbonate (ABC) with 1 mM Dithiothreitol (DTT)) to an estimated protein concentration of 1 mg/mL. Dissolved protein sample was reduced by addition of 0.2 uL 1M DTT, the reduction reaction was incubated at room temperature for 30 minutes. The free -SH groups in the sample were then alkylated by adding 1.2 uL 500 mM Iodoacetamide (IAA) and incubating at room temperature for 20 minutes. After alkylation, 0.2 uL 1M DTT was added to quench excess of IAA. Subsequently, protein sample was digested with LysC (with 1:50 (m/m) protein to protease ratio) at room temperature for four hours. The sample was then diluted with 100 mM ABC to reach urea concentration of 1.5 M. Trypsin was added with 1:50 (m/m) protein to protease ratio to further digest proteins for over night (∼15 hours) at room temperature. Resulting peptides were de-salted using C18 StageTips (PMID: 17703201 ). 20% of total peptides were directly analysed by liquid chromatography–tandem mass spectrometry (LC-MS/MS) in duplicate. The remaining 80% peptides were fractionated using size exclusion chromatography in order to enrich for crosslinked peptides (PMID: 24356771 ). Peptides were separated using a Superdex Peptide 3.2/300 column (GE Healthcare) at a flow rate of 10 μl/min. The mobile phase consisted of 30% (v/v) acetonitrile and 0.1% trifluoroacetic acid. The earliest six peptide-containing fractions (50 μl each) were collected. Solvent was removed using a vacuum concentrator. The fractions were then analysed by LC-MS/MS. LC-MS/MS analysis was performed using an Orbitrap Fusion Lumos Tribrid mass spectrometer (Thermo Fisher Scientific), connected to an Ultimate 3000 RSLCnano system (Dionex, Thermo Fisher Scientific). Each SEC fraction was resuspended in 1.6% v/v acetonitrile 0.1% v/v formic acid and analysed with two LC-MS/MS acquisitions. Peptides were injected onto a 50-centimetre EASY-Spray C18 LC column (Thermo Scientific) that is operated at 50°C column temperature. Mobile phase A consists of water, 0.1% v/v formic acid and mobile phase B consists of 80% v/v acetonitrile and 0.1% v/v formic acid. Peptides were loaded and separated at a flowrate of 0.3 μL/min. Eluted peptides were ionized by an EASY-Spray source (Thermo Scientific) and introduced directly into the mass spectrometer. For non-fractionated samples, peptides were separated using a linear gradient going from 2% mobile phase B to 40% mobile phase B over 110 minutes, followed by a linear increase from 40% to 95% mobile phase B in eleven minutes. The MS data is acquired in the data-dependent mode with three-second acquisition cycle. The full scan mass spectrum was recorded in the Orbitrap with a resolution of 120,000. The ions with a charge state from 3+ to 7+ were isolated and fragmented using higher-energy collisional dissociation (HCD) with 30% collision energy. The fragmentation spectra were then recorded in the Orbitrap with a resolution of 50000. Dynamic exclusion was enabled with single repeat count and 60-second exclusion duration. The collected SEC fractions were each analysed with duplicated acquisitions. Peptides were separated by applying a gradient ranging from 2% to 45% B over 90 min. Gradient was optimized for each corresponding SEC fraction. Following the separating gradient, the content of B was ramped to 55% and 95% within 2.5 minutes each. The MS data is acquired in the data-dependent mode with the top-speed option. For each three-second acquisition cycle, the full scan mass spectrum was recorded in the Orbitrap with a resolution of 120,000. The ions with a charge state from 3+ to 7+ were isolated and fragmented using Higher-energy collisional dissociation (HCD). For each isolated precursor, one of three collision energy settings (26%, 28% or 30%) was selected for fragmentation using data dependent decision tree based on the m/z and charge of the precursor. The fragmentation spectra were then recorded in the Orbitrap with a resolution of 50000. Dynamic exclusion was enabled with single repeat count and 60-second exclusion duration. The MS2 peak lists were generated from the raw mass spectrometric data files using the MSConvert module in ProteoWizard (version 3.0.11729). The default parameters were applied, except that Top MS/MS Peaks per 100 Da was set to 20 and the de-noising function was enabled. Precursor and fragment m/z values were recalibrated. Identification of crosslinked peptides was carried out using xiSEARCH software ( https://www.rappsilberlab.org/software/xisearch ) (PMID: 31556486 ). Peak lists from all LC-MS/MS acquisitions were searched against the sequence and the reversed sequence of γTuRC subunits. The following parameters were applied for the search: MS accuracy = 5 ppm; MS2 accuracy = 10 ppm; enzyme = trypsin (with full tryptic specificity); allowed number of missed cleavages = two; missing monoisotopic peak=2 5; cross-linker = BS3 the reaction specificity for BS3 was assumed to be for lysine, serine, threonine, tyrosine and protein N termini); fixed modifications = carbamidomethylation on cysteine; variable modifications = oxidation on methionine, modifications by BS3 that are hydrolyzed or amidated on the end. Identified crosslinked peptide candidates were filtered using XiFDR (PMID: 28267312 ). A false discovery rate (FDR) of 2% on residue-pair-level was applied with “boost between” option selected. A list of identified crosslinked residue pairs is reported in Data S2 . Structural interpretation of inter-protein crosslinks was focused on protein pairs that were crosslinked with three or more residue pairs. The pseudo-atomic model of γTuRC complex was compared against the crosslinking data. The distances between the Cα atoms of crosslinked residue pairs in the model were measured and compared against a theoretical crosslinking limit of 30 Å for crosslinker BS3 (calculated based the spacer of the crosslinker and the length of the side chains of crosslinked residues).
Supplemental Information Document S1. Figures S1–S6 Data S1. List of Total iBAQ Intensities for Proteins in Purified Human γTuRC as Identified by Mass Spectrometry, Related to Figure 1 Data S2. List of Identified Crosslinked Residue Pairs, Related to Figure 6 Document S2. Article plus Supplemental Information
📊 Figures
Figureu00a01
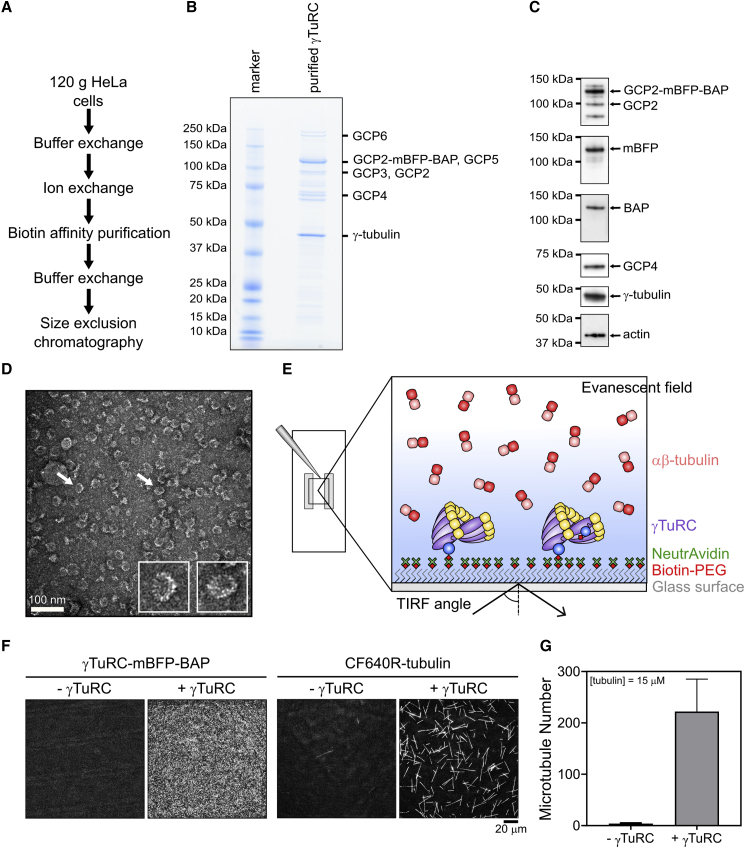
Purification and Characterization of u03b3TuRC-mBFP-BAP (A) Overview of purification steps. (B) Coomassie-stained SDS-PAGE of purified u03b3TuRC. Protein bands corresponding to u03b3TuRC subunits as i...
Figureu00a02
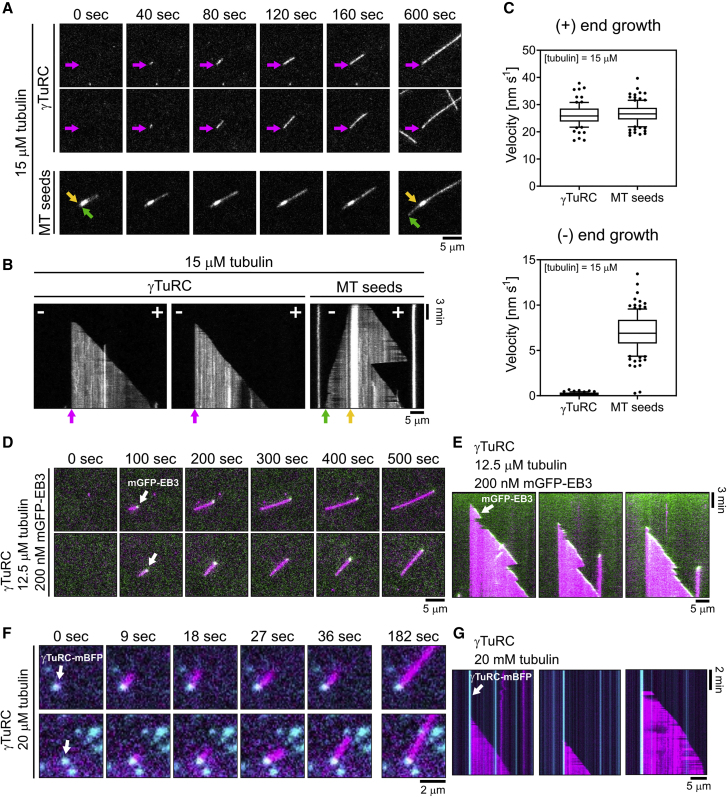
u03b3TuRC Nucleates and Caps Microtubules at Their Minus End (Au2013C) Comparison between u03b3TuRC microtubule nucleation assay and microtubule seed assay. Both assays were performed in the presence ...
Figureu00a03
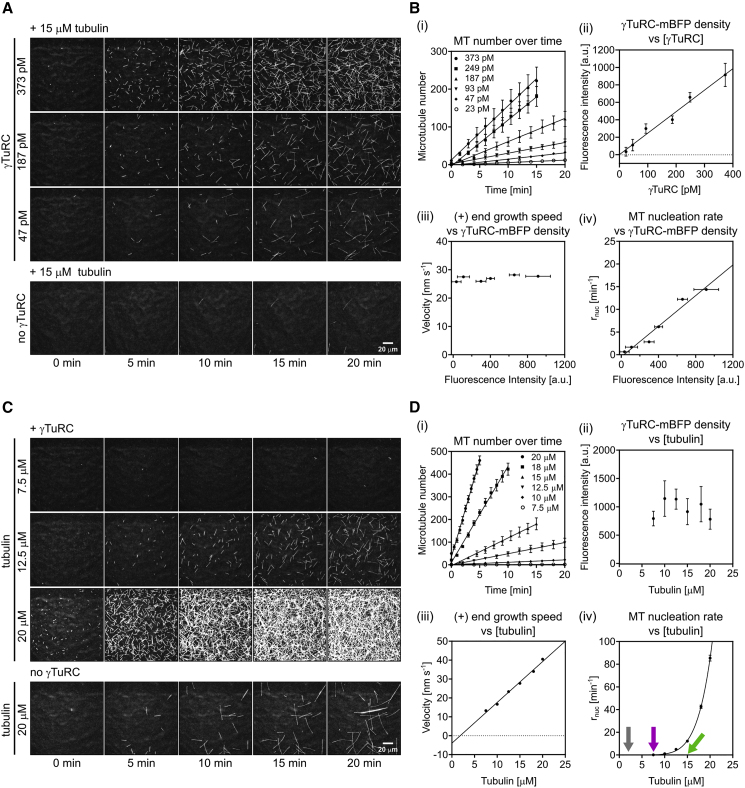
The Microtubule Nucleation Efficiency of u03b3TuRC Depends on u03b3TuRC Surface Density and Tubulin Concentration (A and B) Microtubule nucleation at 33u00b0C in the presence of 15u00a0u03bcM CF640R-t...
Figureu00a04
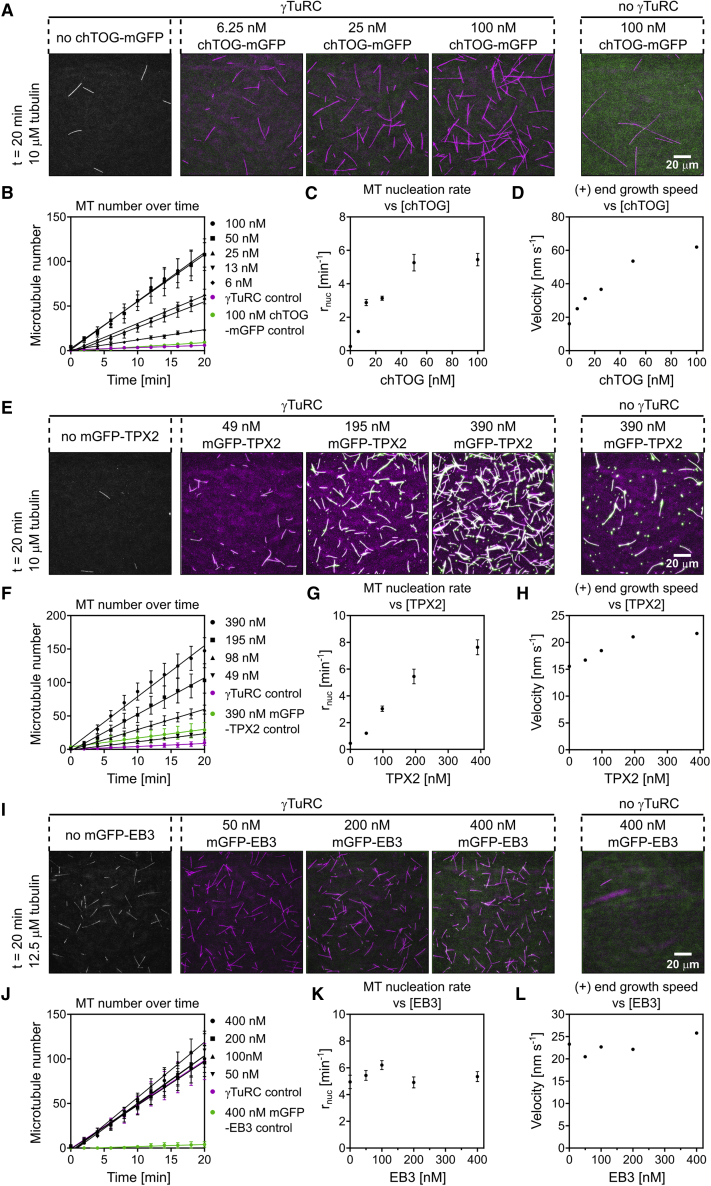
Microtubule Associated Proteins Can Increase the Microtubule Nucleation Efficiency of u03b3TuRC (Au2013D) u03b3TuRC-mediated microtubule nucleation in the presence of different chTOG-mGFP concentratio...
Figureu00a05
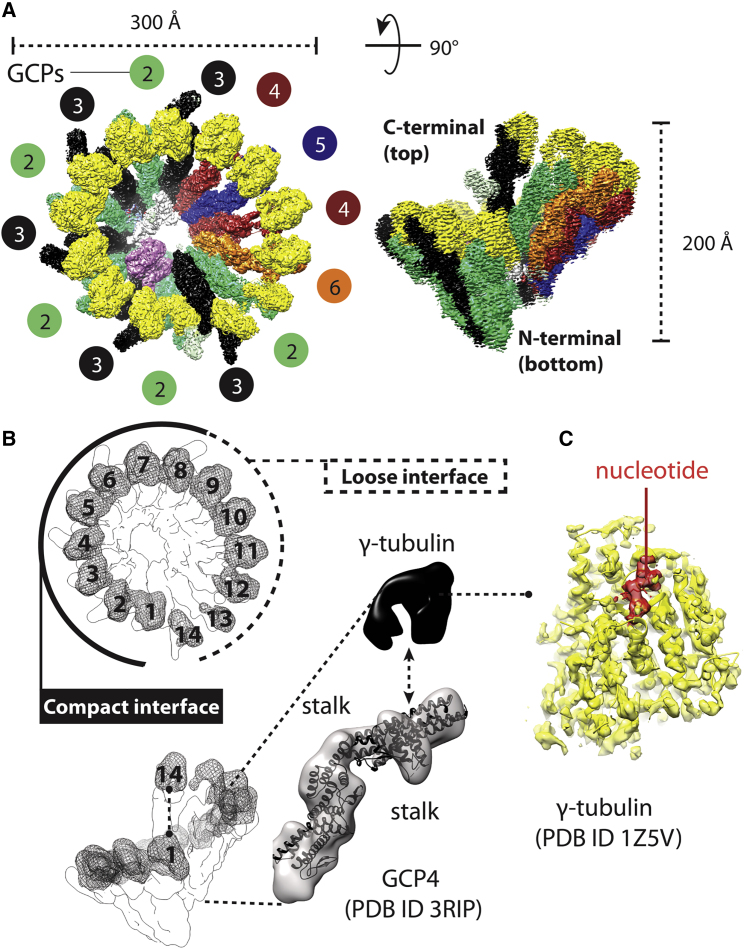
Cryo-EM Structure of Human u03b3TuRC (A) Surface rendering of the cryo-EM structure viewed from the top and side. u03b3TuRC is shaped like a cone with a base diameter of 300 and height of 200u00a0u00c...
Figureu00a06
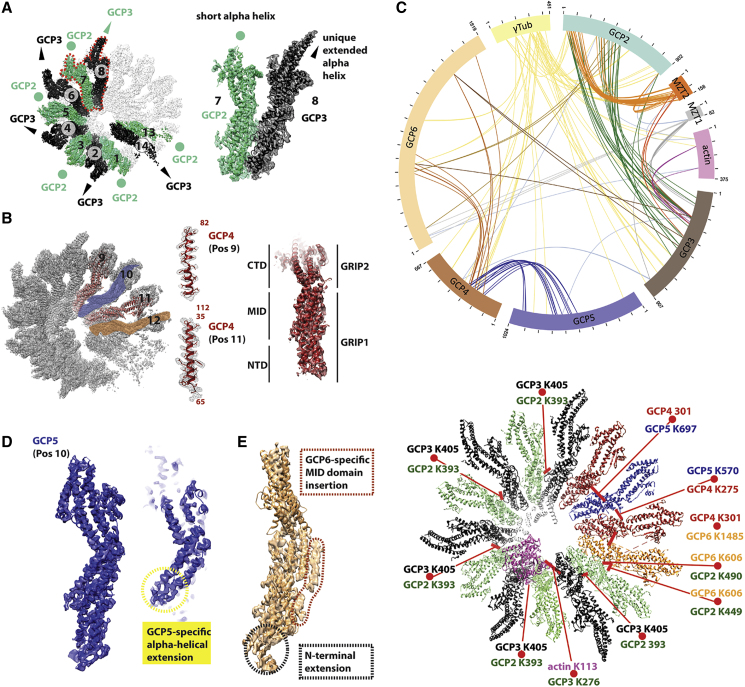
GCP Subunit Assignment (A) GCP2 and GCP3 are known to form a stable heterodimer. Homology modeling indicates that GCP3 contains a unique u03b1-helical extension, resulting in a distinctive feature tha...
Figureu00a07
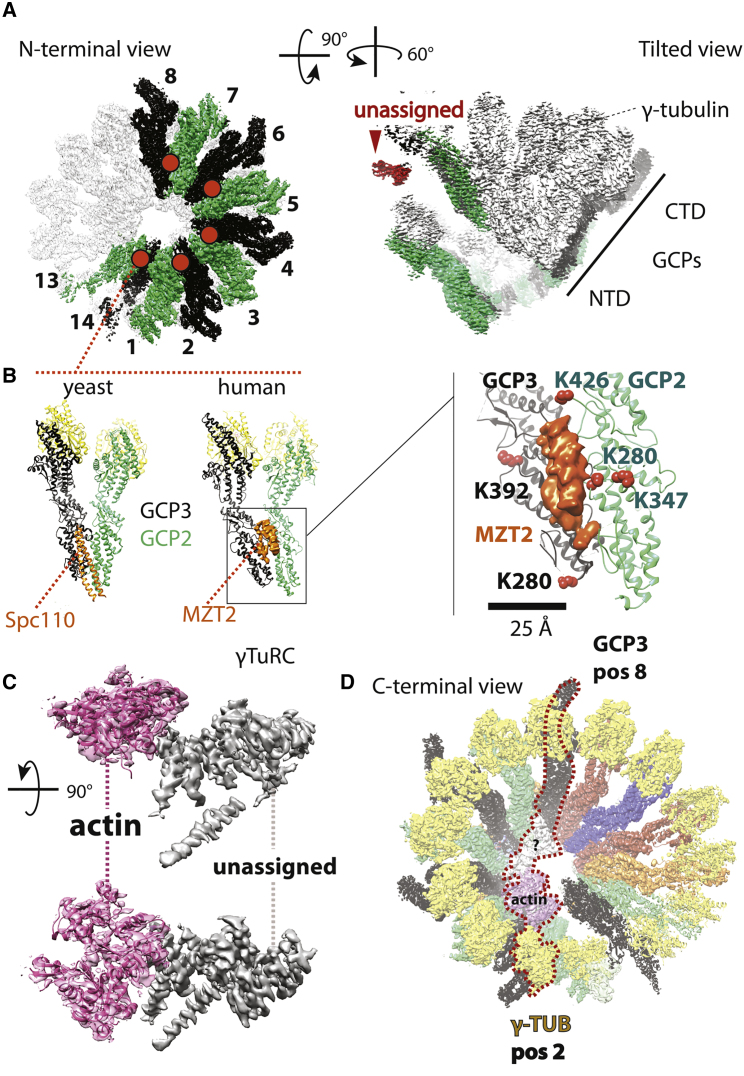
Analysis of the Unassigned Cryo-EM Density in the u03b3TuRC Complex (A) Unoccupied density appears to seal off the interface of GCP2 and GCP3, lining the outer perimeter of the GCP spiral (marked with...
Figure images are served from the NIH/NLM PubMed Central Open Access Subset or Europe PMC; copyright remains with the publishers and authors.
💬 Discussion
0 commentsNo comments yet. Be the first to start a discussion!
Leave a Comment