Abstract
Hair bundles of the inner ear have a specialized structure and protein composition that underlies their sensitivity to mechanical stimulation. Using mass spectrometry, we identified and quantified >1,100 proteins, present from a few to 400,000 copies per stereocilium, from purified chick bundles; 336 of these were significantly enriched in bundles. Bundle proteins that we detected have been shown to regulate cytoskeleton structure and dynamics, energy metabolism, phospholipid synthesis and cell signaling. Three-dimensional imaging using electron tomography allowed us to count the number of actin-actin cross-linkers and actin-membrane connectors; these values compared well to those obtained from mass spectrometry. Network analysis revealed several hub proteins, including RDX (radixin) and SLC9A3R2 (NHERF2), which interact with many bundle proteins and may perform functions essential for bundle structure and function. The quantitative mass spectrometry of bundle proteins reported here establishes a framework for future characterization of dynamic processes that shape bundle structure and function.
🔬 Techniques
🔭 Microscopes
🧬 Organisms
💻 Software
✨ Fluorophores
🧪 Sample Preparation
🔬 Cell Lines
🏭 Microscope Brands
🧪 Reagent Suppliers
📷 Detectors
🔎 Objectives
💻 Software Details
💾 Data Repositories
🏛️ Research Organizations (ROR)
Affiliated research institutions:
📋 Methods
Animals
Animal experiments reported here were approved by the Oregon Health & Science University Institutional Animal Care and Use Committee (IACUC); the approval number was A684. All experiments began with euthanasia of the animal, which was carried out using methods approved by American Veterinary Medical Association Panel on Euthanasia.
Preparation of samples for mass spectrometry
Utricle hair bundles were purified from E20–21 chicks using the twist-off method 4 , 8 . We estimated the fraction of epithelium protein accounted for by bundles using two independent methods. In the first, we divided the amount of bundle protein per utricle (16 ng; ref. 4 ), measured with a fluorescence protein assay, by the estimated recovery (~40%); this value was then divided by the protein per utricle (estimated here at 2.4 ± 0.2 µg). This approach suggested bundle protein was 1.7% of the utricle's total protein. In the second method, we estimated the areas taken up by bundles and cell bodies in images of plastic sections of fixed, osmium-stained utricles. Using Fiji ( http://fiji.sc ) to measure regions of interest, this method estimated that bundles make up 1.8 ± 0.6% of the total protein in the utricle. Given the uncertainties in each, the methods suggested that bundles make up ~2% of the total protein in the utricle. Separation of proteins by a short SDS-PAGE run prior to reduction, alkylation, and trypsin digestion substantially increased sensitivity and reproducibility of detection compared to other methods 31 , in part because we could remove interfering polymers from the agarose used for bundle isolation. NuPAGE LDS sample buffer (Invitrogen) with 50 mM dithiothreitol was added to a combined final volume of 80 µl per 100 utricles' worth of bundles; samples were heated to 70°C for 15 min. Epithelial proteins were also solubilized with NuPAGE LDS sample buffer. Proteins were separated by running ~1 cm into a NuPAGE 4–12% Bis-Tris gel (1.5 mm × 10 well; one or two lanes per bundle sample); gels were rinsed with water, then stained with Imperial Protein Stain (Thermo Scientific). The 1 cm of gel with separated proteins was manually sliced into six pieces. Gel pieces were transferred to siliconized tubes and washed and destained in 200 µl 50% methanol overnight. The gel pieces were dehydrated in acetonitrile, rehydrated in 30 µl of 10 mM dithiothreitol in 0.1 M ammonium bicarbonate and reduced at room temperature for 0.5 h. The DTT solution was removed and the sample alkylated at room temperature for 0.5 h with 30 µl of 50 mM iodoacetamide in 0.1 M ammonium bicarbonate. The reagent was removed and the gel pieces dehydrated in 100 µl acetonitrile. The acetonitrile was removed and the gel pieces rehydrated in 100 µl of 0.1 M ammonium bicarbonate. The pieces were dehydrated in 100 µl acetonitrile, the acetonitrile removed and the pieces completely dried by vacuum centrifugation. The gel pieces were rehydrated in 20 ng/µl trypsin (Sigma-Aldrich T6567 proteomics grade, from porcine pancreas, dimethylated) in 50 mM ammonium bicarbonate on ice for 10 min. Any excess enzyme solution was removed and 20 µl of 50 mM ammonium bicarbonate added. The sample was digested overnight at 37°C and the peptides formed extracted from the polyacrylamide in two 30 µl aliquots of 50% acetonitrile/5% formic acid. These extracts were combined and evaporated to 15 µl for MS analysis. For the gel slice immediately adjacent to the agarose in the sample well, peptides were first purified away from interfering polymers on a SCX CapTrap from Bruker-Michrom (TR1/25109/35; size 0.5 × 2 mm, bed volume 0.5 µl). The CapTrap was washed with 50 µl of 1% acetic acid (void volume collected) and then eluted with 25 µl 1 M ammonium acetate into an separate Eppendorf tube. The eluate was vacuum dried, then the sample then reconstituted with 15 µl of 3% acetic acid. A single experiment's worth of hair bundles or epithelium was analyzed by six LC-MS/MS runs, corresponding to the six gel pieces. Mass spectrometry data acquisition and analysis The LC-MS/MS system consisted of a Thermo Electron Orbitrap Velos ETD mass spectrometer system; the exceptional mass accuracy of the Orbitrap instrument allows for high resolution of peptide peak m/z (mass-to-charge ratio), which leads to increased numbers of confident protein assignments. Peptides were introduced into the mass spectrometer with a Protana nanospray ion source, which was interfaced to a reversed-phase capillary column of 8 cm length × 75 µm internal diameter, self-packed with Phenomenex C18 Jupiter of 10 µm particle size. An extract aliquot (7.5 µl) was injected and peptides eluted from the column by an acetonitrile/0.1 M acetic acid gradient at a flow rate of 0.5 µl/min over 1.2 hr. The nanospray ion source was operated at 2.5 kV. The digest was analyzed using the data-dependent capability of the instrument, acquiring—in sequential scans—a single full scan mass spectrum in the Orbitrap detector at 60,000 resolution to determine peptide molecular weights, and 20 product-ion spectra in the ion trap to determine amino acid sequence. MaxQuant version 1.2.2.5 software was used for protein identification and quantitation 10 . The default contaminants file associated with the MaxQuant download was edited to remove entries known to be present in hair bundles (e.g., actin) and to add additional impurities that entered the bundle-purification workflow (keratins, hemoglobins, egg white components). Nevertheless, alpha and beta hemoglobins, which appear in the preparation due to contamination from red blood cells 4 , are expressed in chick utricle 20 , suggesting that they should not be fully dismissed as components of hair cells. Mass spectrometry data were searched against Ensembl version 66 (released February, 2012) using Andromeda 9 ; the Ensembl FASTA file was edited by replacing several sequences with longer or full-length sequences, including actin gamma 1 ( NP_001007825.1 ), actin beta ( NP_990849.1 ), fascin 1 ( NP_001171603 ), fascin 2 ( NP_001171209 ), ATP synthase beta ( NP_001026562.1 ), peptidylprolyl isomerase A ( NP_001159798.1 ), calbindin 2 ( NP_990647.1 ), PDZD7 ( XP_003641537.1 ), espin ( XP_417532.3 ), and CACNA2D2 ( XP_427707.3 ). Protein identifications were reported with an FDR of 1%. Proteins identified with a single unique peptide are flagged in Supplementary Table 1 . If a set of peptides for a protein was identical to or completely contained within that of another protein, MaxQuant groups those proteins together ("redundant groups"); the entry with the largest number of peptides was used to identify the redundant group. Redundant groups that shared more than 20% of their identified peptides were further grouped in our analysis ("shared-peptide groups"); the entry with the greatest intensity associated with it was used to identify the shared-peptide group. All mass spectrometry proteomics data, including raw data, MaxQuant output files, and modified Ensembl FASTA database, have been deposited to the ProteomeXchange Consortium ( http://proteomecentral.proteomexchange.org ) via the PRIDE partner repository 51 with the dataset identifier PXD000104. Annotation of the chicken genome is incomplete and occasionally wrong. For all proteins identified in the BUN preparation, we manually examined annotations of the chicken Ensembl entry and Ensembl-identified orthologs of other species, particularly mouse and human, to determine an appropriate description and symbol. Whenever possible, we chose the human ortholog's gene name—as determined by the Human Genome Organization—for a protein's symbol. Gene Ontology annotation of the chicken genome is poor and, in many cases, was not useful for annotation of bundle proteins. Accordingly, we chose a simple, consistent set of ontology annotations to apply to all bundle proteins (see Fig. 2b ). All proteins in the BUN preparation had one (and only one) of these ontologies assigned to it ( Supplementary Table 1 ). Paralog identification Using data downloaded during 10/2012 from the Chicken Ensembl database ( http://www.ensembl.org/Gallus_gallus/Info/Index ) BioMart tool, we also identified all paralogs in the chicken genome for each protein entry or group, calculating the average sequence identity for all paralogs matching to a protein or protein group. We also determined which paralogs for a protein or protein group were identified in the combined BUN and UTR datasets, as well as which were present in the group of all proteins that were significantly enriched over the contamination level. These data are reported in Supplementary Table 1 .
Show full methods section
Animals
Animal experiments reported here were approved by the Oregon Health & Science University Institutional Animal Care and Use Committee (IACUC); the approval number was A684. All experiments began with euthanasia of the animal, which was carried out using methods approved by American Veterinary Medical Association Panel on Euthanasia.
Preparation of samples for mass spectrometry
Utricle hair bundles were purified from E20–21 chicks using the twist-off method 4 , 8 . We estimated the fraction of epithelium protein accounted for by bundles using two independent methods. In the first, we divided the amount of bundle protein per utricle (16 ng; ref. 4 ), measured with a fluorescence protein assay, by the estimated recovery (~40%); this value was then divided by the protein per utricle (estimated here at 2.4 ± 0.2 µg). This approach suggested bundle protein was 1.7% of the utricle's total protein. In the second method, we estimated the areas taken up by bundles and cell bodies in images of plastic sections of fixed, osmium-stained utricles. Using Fiji ( http://fiji.sc ) to measure regions of interest, this method estimated that bundles make up 1.8 ± 0.6% of the total protein in the utricle. Given the uncertainties in each, the methods suggested that bundles make up ~2% of the total protein in the utricle. Separation of proteins by a short SDS-PAGE run prior to reduction, alkylation, and trypsin digestion substantially increased sensitivity and reproducibility of detection compared to other methods 31 , in part because we could remove interfering polymers from the agarose used for bundle isolation. NuPAGE LDS sample buffer (Invitrogen) with 50 mM dithiothreitol was added to a combined final volume of 80 µl per 100 utricles' worth of bundles; samples were heated to 70°C for 15 min. Epithelial proteins were also solubilized with NuPAGE LDS sample buffer. Proteins were separated by running ~1 cm into a NuPAGE 4–12% Bis-Tris gel (1.5 mm × 10 well; one or two lanes per bundle sample); gels were rinsed with water, then stained with Imperial Protein Stain (Thermo Scientific). The 1 cm of gel with separated proteins was manually sliced into six pieces. Gel pieces were transferred to siliconized tubes and washed and destained in 200 µl 50% methanol overnight. The gel pieces were dehydrated in acetonitrile, rehydrated in 30 µl of 10 mM dithiothreitol in 0.1 M ammonium bicarbonate and reduced at room temperature for 0.5 h. The DTT solution was removed and the sample alkylated at room temperature for 0.5 h with 30 µl of 50 mM iodoacetamide in 0.1 M ammonium bicarbonate. The reagent was removed and the gel pieces dehydrated in 100 µl acetonitrile. The acetonitrile was removed and the gel pieces rehydrated in 100 µl of 0.1 M ammonium bicarbonate. The pieces were dehydrated in 100 µl acetonitrile, the acetonitrile removed and the pieces completely dried by vacuum centrifugation. The gel pieces were rehydrated in 20 ng/µl trypsin (Sigma-Aldrich T6567 proteomics grade, from porcine pancreas, dimethylated) in 50 mM ammonium bicarbonate on ice for 10 min. Any excess enzyme solution was removed and 20 µl of 50 mM ammonium bicarbonate added. The sample was digested overnight at 37°C and the peptides formed extracted from the polyacrylamide in two 30 µl aliquots of 50% acetonitrile/5% formic acid. These extracts were combined and evaporated to 15 µl for MS analysis. For the gel slice immediately adjacent to the agarose in the sample well, peptides were first purified away from interfering polymers on a SCX CapTrap from Bruker-Michrom (TR1/25109/35; size 0.5 × 2 mm, bed volume 0.5 µl). The CapTrap was washed with 50 µl of 1% acetic acid (void volume collected) and then eluted with 25 µl 1 M ammonium acetate into an separate Eppendorf tube. The eluate was vacuum dried, then the sample then reconstituted with 15 µl of 3% acetic acid. A single experiment's worth of hair bundles or epithelium was analyzed by six LC-MS/MS runs, corresponding to the six gel pieces. Mass spectrometry data acquisition and analysis The LC-MS/MS system consisted of a Thermo Electron Orbitrap Velos ETD mass spectrometer system; the exceptional mass accuracy of the Orbitrap instrument allows for high resolution of peptide peak m/z (mass-to-charge ratio), which leads to increased numbers of confident protein assignments. Peptides were introduced into the mass spectrometer with a Protana nanospray ion source, which was interfaced to a reversed-phase capillary column of 8 cm length × 75 µm internal diameter, self-packed with Phenomenex C18 Jupiter of 10 µm particle size. An extract aliquot (7.5 µl) was injected and peptides eluted from the column by an acetonitrile/0.1 M acetic acid gradient at a flow rate of 0.5 µl/min over 1.2 hr. The nanospray ion source was operated at 2.5 kV. The digest was analyzed using the data-dependent capability of the instrument, acquiring—in sequential scans—a single full scan mass spectrum in the Orbitrap detector at 60,000 resolution to determine peptide molecular weights, and 20 product-ion spectra in the ion trap to determine amino acid sequence. MaxQuant version 1.2.2.5 software was used for protein identification and quantitation 10 . The default contaminants file associated with the MaxQuant download was edited to remove entries known to be present in hair bundles (e.g., actin) and to add additional impurities that entered the bundle-purification workflow (keratins, hemoglobins, egg white components). Nevertheless, alpha and beta hemoglobins, which appear in the preparation due to contamination from red blood cells 4 , are expressed in chick utricle 20 , suggesting that they should not be fully dismissed as components of hair cells. Mass spectrometry data were searched against Ensembl version 66 (released February, 2012) using Andromeda 9 ; the Ensembl FASTA file was edited by replacing several sequences with longer or full-length sequences, including actin gamma 1 ( NP_001007825.1 ), actin beta ( NP_990849.1 ), fascin 1 ( NP_001171603 ), fascin 2 ( NP_001171209 ), ATP synthase beta ( NP_001026562.1 ), peptidylprolyl isomerase A ( NP_001159798.1 ), calbindin 2 ( NP_990647.1 ), PDZD7 ( XP_003641537.1 ), espin ( XP_417532.3 ), and CACNA2D2 ( XP_427707.3 ). Protein identifications were reported with an FDR of 1%. Proteins identified with a single unique peptide are flagged in Supplementary Table 1 . If a set of peptides for a protein was identical to or completely contained within that of another protein, MaxQuant groups those proteins together ("redundant groups"); the entry with the largest number of peptides was used to identify the redundant group. Redundant groups that shared more than 20% of their identified peptides were further grouped in our analysis ("shared-peptide groups"); the entry with the greatest intensity associated with it was used to identify the shared-peptide group. All mass spectrometry proteomics data, including raw data, MaxQuant output files, and modified Ensembl FASTA database, have been deposited to the ProteomeXchange Consortium ( http://proteomecentral.proteomexchange.org ) via the PRIDE partner repository 51 with the dataset identifier PXD000104. Annotation of the chicken genome is incomplete and occasionally wrong. For all proteins identified in the BUN preparation, we manually examined annotations of the chicken Ensembl entry and Ensembl-identified orthologs of other species, particularly mouse and human, to determine an appropriate description and symbol. Whenever possible, we chose the human ortholog's gene name—as determined by the Human Genome Organization—for a protein's symbol. Gene Ontology annotation of the chicken genome is poor and, in many cases, was not useful for annotation of bundle proteins. Accordingly, we chose a simple, consistent set of ontology annotations to apply to all bundle proteins (see Fig. 2b ). All proteins in the BUN preparation had one (and only one) of these ontologies assigned to it ( Supplementary Table 1 ). Paralog identification Using data downloaded during 10/2012 from the Chicken Ensembl database ( http://www.ensembl.org/Gallus_gallus/Info/Index ) BioMart tool, we also identified all paralogs in the chicken genome for each protein entry or group, calculating the average sequence identity for all paralogs matching to a protein or protein group. We also determined which paralogs for a protein or protein group were identified in the combined BUN and UTR datasets, as well as which were present in the group of all proteins that were significantly enriched over the contamination level. These data are reported in Supplementary Table 1 .
Intensity-based mass-spectrometric quantitation
To quantify proteins, we used a label-free method that relies each detected peptide's ion-current signal in the mass spectrometer. As peptides elute from the liquid chromatograph, undergo ionization, and are delivered to the mass spectrometer, the Orbitrap instrument we used measures their intensities, as well as their mass-to-charge ratio with high-resolution. Intensity depends both on the charge and amount of peptide delivered to the detector, although the efficiency of delivery varies widely from peptide to peptide because of variable recovery following liquid chromatography and differing degrees of ionization. Thus the relationship between intensity measured in the mass spectrometer and the amount of a peptide injected on to the liquid chromatograph also varies, which limits quantitation accuracy when standards for each protein are lacking. For example, hydrophobic peptides derived from transmembrane segments of integral membrane proteins are particularly poorly recovered, leading to reduced detection of this class of proteins 52 . Moreover, mass spectrometers like the one we used are tuned to optimally detect peptides in a relatively narrow mass range, typically 6–30 amino acids, so proteins with an overabundance of short or long tryptic peptides are quantified less accurately than an average peptide. Nevertheless, measurement of protein abundance uses the sum of many peptide measurements, so with larger proteins—which generate many peptides—inter-peptide variability is averaged out and quantitation accuracy is improved. In the iBAQ algorithm 11 , the intensities of the precursor peptides that map to each protein are summed together and divided by the number of theoretically observable peptides, which is considered to be all tryptic peptides between 6 and 30 amino acids in length. This operation converts a measure that is proportional to mass (intensity) into one that is proportional to molar amount (iBAQ). The release of the MaxQuant 10 we used (version 1.2.2.5) reports for each identified protein both its summed intensity and its iBAQ value. To determine absolute amounts of each protein in stereocilia, we generated a normalized measure of molar abundance (relative iBAQ). We first removed from the analysis all contaminant proteins that entered our sample-preparation workflow, including include keratins (from human skin), hemoglobins (from blood), egg white proteins (e.g., ovalbumin), and trypsin. We then divided each remaining protein's iBAQ value by the sum of all non-contaminant iBAQ values, generating an riBAQ value for each protein: (1) riBAQ = iBAQ i ∑ i = 1 n iBAQ i For iBAQ validation experiments, we spiked 1/5 of a vial of UPS2 standard proteins (Universal Proteomics Standard 2; Sigma-Aldrich) into 25 µg (~500 pmol total) of the E. coli extract. Each experiment thus included 48 human proteins, eight each at 10 pmol, 1 pmol, 100 fmol, 10 fmol, 1 fmol, and 100 amol. We carried out four independent experiments using methods identical to those for hair bundles and utricular epithelia, including a 1-cm SDS-PAGE separation that was followed by slicing the gel into six pieces; reduction, alkylation, and trypsin proteolysis; LC-MS/MS using the Orbitrap mass spectrometer; and MaxQuant analysis with riBAQ determination. For quantitative immunoblot validation of riBAQ values, BUN and UTR samples were loaded into 10- or 15-well Novex NuPAGE Bis-Tris 4–12% gels, along with dilutions of purified protein standards, and separated by SDS-PAGE. Protein standards were: CALM (bovine brain; EMD Millipore), ANXA5 (recombinant, from chicken; ImmunoTools GmbH), MYO1C (recombinant, from rat; gift of Lynne Coluccio, Boston Biomedical Research Institute), and FSCN2 (recombinant, from human; USCN Life Sciences). Five dilutions between 1 and 200 ng were used for CALM and ANXA5 standard curves, four dilutions between 0.01 and 1 ng were used for MYO1C, and four dilutions between 1.25 and 10 ng were used for the FSCN2. SDS-PAGE and immunoblotting were carried out essentially as described previously 4 , 31 . Band intensities were measured using Fiji imaging software and linear regression analysis was carried to determine the amount of each protein (ng/ear) within the bundle and epithelium samples. Three experiments were carried out for each protein. To estimate the mole fraction of each protein, the estimate of ng/ear was converted to mol/ear, then was divided by the number of moles of total protein per ear. We estimated moles of protein per ear by dividing the amount of protein per ear's worth of bundles or epithelium, then dividing by the average molecular mass for all proteins in each sample, which was weighted by the mole fraction estimated by mass spectrometry (46 kD for bundles, 56 kD for epithelium).
Statistical analysis
Fisher's exact test was used to determine the significance of the increased numbers of deafness proteins in the hair bundle samples. Permutation tests were employed to test whether the mean values of log 2 (BUN riBAQ/UTR riBAQ) were significantly greater than the corresponding contamination level of log 2 (0.20). Exact p-values were computed and adjusted for multiple test corrections by the false discovery rate 17 . All computations were done by using the exactRankTests package in the R statistical computing environment.
Electron microscopy sample preparation and tomography
We used high-pressure freezing and freeze substitution 53 to optimally preserve osmotically sensitive samples. Chick utricle epithelia were dissected in chick saline (155 mM NaCl, 5 mM KCl, 5 mM D-glucose, and 10 mM 4-(2-hydroxyethyl)-1-piperazineethanesulfonic acid (HEPES)) containing 0.1 mM CaCl 2 . The tissue was fixed for 2 hr at room temperature in 3% glutaraldehyde (Electron Microscopy Sciences), 0.2% tannic acid, 100 mM KCl, 5 mM MgCl 2 , and 20 mM 3-(N-morpholino) propanesulfonic acid (MOPS) at pH 6.8, then washed 3× for 5 min each at room temperature in the same solution without glutaraldehyde and tannic acid. Samples were stained with 1% OsO 4 in 0.1 M sodium phosphate buffer for 1 hr on ice, followed by three rinses with 0.1 M sodium phosphate buffer and three additional rinses with deionized water. Subsequent staining was carried out with 2% aqueous uranyl acetate at room temperature for 1 hr, followed immediately by three rinses with deionized water. Samples were coated with a 20% glycerol cryoprotectant and high-pressure frozen using a Bal-Tec HPM 010 high pressure freezer. Thereafter, freeze substitution was performed using a freeze substitution mix containing 0.1% uranyl acetate in 100% acetone. Epon-araldite resin embedding and infiltration was carried out as described 22 . Sections were cut at 70 or 120 nm for screening or for tomography, respectively. Thin sections, nominally 120 nm in thickness, were placed on 2 × 1 mm oval hole copper/rhodium grids with 0.6% Formvar coating for imaging and decorated with 10 nm or 15 nm gold fiducial markers for tomography. For additional stability upon beam exposure and to minimize charging, a thin film of carbon was deposited on grids containing sections using a Denton Vacuum system (DV-502). Initial screening and tomography was primarily done with JEOL1200-EX (TEM only), Philips CM200 FEG, and FEI Tecnai F20 electron microscopes, whereas analyzed tilt series were collected using an FEI Tecnai T12 LaB6 electron microscope operated at 120 kV. Images were recorded with a Gatan MegaScan Model 794/20 2K CCD (JEOL1200-EX), a Gatan First Light 4K CCD (CM200), a Tietz F415 4K CDD (F20), or a Gatan 1000 2048 × 2048-pixel CCD camera (T12). Tomograms for quantification were collected using ~0.8 µm underfocus at a nominal 13,500× magnification, corresponding to a pixel size of 0.8 nm at the specimen level. Dual-axis tilt series were recorded at 1° intervals for angles of up to ±65°. Projections were aligned and reconstructed into a three-dimensional volume with the software package IMOD 54 . Resulting maps were processed either with three iterations of a bilateral filter using PRIISM 55 or with successive rounds of smoothing, diffusion, or median filtering using the Clip program in IMOD. Segmentation and interactive simplified model building was done using UCSF Chimera 56 . The simplified model displaying actin filaments, crosslinkers, and connectors deliberately used cylinders smaller in diameter than their respective structures to allow adequate display of the crosslinkers and connectors.
Stereociliary protein network
The protein interaction data in Supplementary Table 2 can be represented in the form of a graph G = ⎨ N, L ⎬ where the set of nodes N correspond to bundle proteins and links L correspond to specific protein interactions. Two vertices n and m form an edge of the graph if ⎨ n, m ⎬ ∈ L ; because in our data, ⎨ n, m ⎬ ∈ L implies ⎨ m, n ⎬ ∈ L , the graph is undirected and is drawn with line segments rather than arrows. To visualize the interrelationships between these interactions, they are displayed in a drawing (a mathematically-defined "graph"). To represent the interactions aesthetically, link crossings were minimized and spacing between nodes was kept relatively even. We used a straight-edge drawing algorithm, spring-electrical embedding 25 , which minimizes the energy of a physical model of the graph in two dimensions. Spring-electrical embedding uses two forces. The "attractive force" f a = d ij 2 / K between adjacent nodes is proportional to the Euclidian distance between them ( d ij ); K is a spring-like constant that maintains the optimal distance between nodes. The "electrical force" (repulsive) is global and inversely proportional to the Euclidian distance between nodes: f r = K 2 / d ij . The layout of the graph vertices is then determined by minimizing the energy function described by these two forces 25 . These modeling rules draw together nodes with similar interactions and disperse unrelated ones, thus clustering related proteins, which may carry out similar roles in bundles. The spring-electrical embedding algorithm is implemented in Mathematica 8 (Wolfram Research; http://www.wolfram.com/mathematica/ ), which we used to generate the network figure.
Antibody methods
Primary antibodies were: for ANXA5, polyclonal anti-chick ANXA5 from Guy Richardson (University of Sussex); for alpha-tubulin, Sigma-Aldrich DMA1; for ATP1A1, Developmental Studies Hybridoma Bank a5; for ATP2B2, F2a (ref. 50 ); for ATP5A1, BD Transduction 612516; for CALM, Millipore 05-173; for CDC42, Cell Signaling #2466 (11A11); for CDH23, C2367 goat anti-CDH23 EC15/16 junction (CATRPAPPDRERQ); for CKB, rabbit anti-chBCK from Theo Wallimann (ETH Zürich); for CTNNB1, BD Transduction Labs #610154; for DSTN, anti-ADF/cofilin from James Bamberg (Colorado State University); for ENO1, Santa Cruz H-300; for ESPN, anti-espin from Stefan Heller (Stanford University) and pan-espin from Bechara Kachar (NIH); for FSCN2, anti-CYTLEFKAGKLAFKD (ref. 31 ); for GAPDH, Chemicon MAB374; for HSPA5 (GRP78), Abcam ab32618; for KIAA1211, rabbit anti-CVSTEPAWLALAKRKAKAWSD; for MDH2, Sigma-Aldrich HPA019714; for MYO1C, antibody 2652 (ref. 57 ); for MYO1H, rabbit G5991 anti-chick MYO1H C-terminal 15 kD; for MYO3A, QHF anti-Xenopus laevis MYO3A C-terminal 22 amino acids (from Beth Burnside, University of California, Berkeley); for MYO3B, rabbit anti-GDWIRKPLYGLFQYNSSMIGLESLC; for MYO7A, 138-1 (Developmental Studies Hybridoma Bank); for PCDH15, G19 anti-tip link antigen 58 ; for PRKAR2A, Santa Cruz M-20; for PTPRJ, mAb D37 (ref. 14 ); for RDX, Abnova #H00005962-M06 (1D9); pERM, Cell Signaling #3149 (41A3); RHOA, Cell Signaling #2117 (67B9); and for talin, Sigma-Aldrich 8D4. We raised polyclonal sera against a mixture of two chicken SLC9A3R2 peptides (CHSDLQSPGKESEDGDSEK and CQRHSHSFSSHSSRKDLNGQKE). Antibodies against MYO6 were obtained from John Kendrick-Jones (MRC Laboratory of Molecular Biology). We also used anti-SLC9A3R2 (anti-NHERF2) 2331B (from Mark Donowitz; Johns Hopkins University) for immunoblotting. For immunoblotting, utricles were dissected from E20-E21 chick embryos in cold, oxygenated chicken saline containing 4 mM CaCl 2 , and ototlithic membranes were removed without protease treatment. SDS-PAGE and immunoblotting were carried out essentially as described previously 4 , 31 . Primary antibodies were used at 1:1000, except anti-CALM (1:500). All secondary antibodies were diluted 1:10,000. For immunoprecipitation, RDX and SLC9A3R2 were cloned from chicken utricle cDNA into expression vectors with respectively Myc and HA epitope tags. Proteins were expressed for 24 hr in HEK293T cells using Effectene (Qiagen) transfection. Cells were lysed using a probe sonicator with PBS containing 1% Triton X-100, 0.5% NP40, and protease inhibitors; the extract was spun at 16,000 g for 15 min. The supernatant fluid was removed and incubated with anti-HA-agarose (Sigma) overnight at 4°C. Immunoprecipitates were washed and proteins were eluted with SDS sample buffer. SDS-PAGE and immunoblotting was carried out essentially as above. For immunocytochemistry, dissected utricles were fixed for 25 min in 4% formaldehyde (Electron Microscopy Sciences) in chicken saline. Organs were rinsed in PBS, permeabilized for 10 min in 0.5% Triton X-100 in PBS, and blocked for 2 hr in 2% bovine serum albumin/5% normal goat serum in PBS. Organs were incubated overnight at 4°C with primary antibodies diluted in blocking solution (1:250 dilution for all primary antibodies except anti-SLC9A3R2 and anti-RDX, both at 1:500), then rinsed 3× for 10 min each. Organs were then incubated for 3–4 hr in blocking solution with 1:1000 Alexa Fluor secondary antibodies and 0.4 U/ml Alexa Fluor 488 Phalloidin (Molecular Probes, Invitrogen). Organs were then rinsed 3× for 20 min each and mounted on slides in Vectashield (Vector Laboratories) using one Secure-Seal spacer (8 wells, 0.12 mm deep, Invitrogen). Images were acquired on an Olympus Fluoview FV1000 laser scanning confocal microscope system and AF10-ASW 3.0 acquisition software, using a 60× 1.42 NA Plan Apo objective with 3× zoom and 0.2 µm z-steps. Confocal images were deconvolved with the optical transfer function optimized for that objective using an iterative algorithm of 10 iterations. The histogram was adjusted for the most positive image and applied to all the other images for consistency before saving the images as 24 bit merged TIFF. All z-stacks were processed using Fiji (fiji.sc); the Reslice function was used to generate an x–z slab of the stack.
Antibody methods
Primary antibodies were: for ANXA5, polyclonal anti-chick ANXA5 from Guy Richardson (University of Sussex); for alpha-tubulin, Sigma-Aldrich DMA1; for ATP1A1, Developmental Studies Hybridoma Bank a5; for ATP2B2, F2a (ref. 50 ); for ATP5A1, BD Transduction 612516; for CALM, Millipore 05-173; for CDC42, Cell Signaling #2466 (11A11); for CDH23, C2367 goat anti-CDH23 EC15/16 junction (CATRPAPPDRERQ); for CKB, rabbit anti-chBCK from Theo Wallimann (ETH Zürich); for CTNNB1, BD Transduction Labs #610154; for DSTN, anti-ADF/cofilin from James Bamberg (Colorado State University); for ENO1, Santa Cruz H-300; for ESPN, anti-espin from Stefan Heller (Stanford University) and pan-espin from Bechara Kachar (NIH); for FSCN2, anti-CYTLEFKAGKLAFKD (ref. 31 ); for GAPDH, Chemicon MAB374; for HSPA5 (GRP78), Abcam ab32618; for KIAA1211, rabbit anti-CVSTEPAWLALAKRKAKAWSD; for MDH2, Sigma-Aldrich HPA019714; for MYO1C, antibody 2652 (ref. 57 ); for MYO1H, rabbit G5991 anti-chick MYO1H C-terminal 15 kD; for MYO3A, QHF anti-Xenopus laevis MYO3A C-terminal 22 amino acids (from Beth Burnside, University of California, Berkeley); for MYO3B, rabbit anti-GDWIRKPLYGLFQYNSSMIGLESLC; for MYO7A, 138-1 (Developmental Studies Hybridoma Bank); for PCDH15, G19 anti-tip link antigen 58 ; for PRKAR2A, Santa Cruz M-20; for PTPRJ, mAb D37 (ref. 14 ); for RDX, Abnova #H00005962-M06 (1D9); pERM, Cell Signaling #3149 (41A3); RHOA, Cell Signaling #2117 (67B9); and for talin, Sigma-Aldrich 8D4. We raised polyclonal sera against a mixture of two chicken SLC9A3R2 peptides (CHSDLQSPGKESEDGDSEK and CQRHSHSFSSHSSRKDLNGQKE). Antibodies against MYO6 were obtained from John Kendrick-Jones (MRC Laboratory of Molecular Biology). We also used anti-SLC9A3R2 (anti-NHERF2) 2331B (from Mark Donowitz; Johns Hopkins University) for immunoblotting. For immunoblotting, utricles were dissected from E20-E21 chick embryos in cold, oxygenated chicken saline containing 4 mM CaCl 2 , and ototlithic membranes were removed without protease treatment. SDS-PAGE and immunoblotting were carried out essentially as described previously 4 , 31 . Primary antibodies were used at 1:1000, except anti-CALM (1:500). All secondary antibodies were diluted 1:10,000. For immunoprecipitation, RDX and SLC9A3R2 were cloned from chicken utricle cDNA into expression vectors with respectively Myc and HA epitope tags. Proteins were expressed for 24 hr in HEK293T cells using Effectene (Qiagen) transfection. Cells were lysed using a probe sonicator with PBS containing 1% Triton X-100, 0.5% NP40, and protease inhibitors; the extract was spun at 16,000 g for 15 min. The supernatant fluid was removed and incubated with anti-HA-agarose (Sigma) overnight at 4°C. Immunoprecipitates were washed and proteins were eluted with SDS sample buffer. SDS-PAGE and immunoblotting was carried out essentially as above. For immunocytochemistry, dissected utricles were fixed for 25 min in 4% formaldehyde (Electron Microscopy Sciences) in chicken saline. Organs were rinsed in PBS, permeabilized for 10 min in 0.5% Triton X-100 in PBS, and blocked for 2 hr in 2% bovine serum albumin/5% normal goat serum in PBS. Organs were incubated overnight at 4°C with primary antibodies diluted in blocking solution (1:250 dilution for all primary antibodies except anti-SLC9A3R2 and anti-RDX, both at 1:500), then rinsed 3× for 10 min each. Organs were then incubated for 3–4 hr in blocking solution with 1:1000 Alexa Fluor secondary antibodies and 0.4 U/ml Alexa Fluor 488 Phalloidin (Molecular Probes, Invitrogen). Organs were then rinsed 3× for 20 min each and mounted on slides in Vectashield (Vector Laboratories) using one Secure-Seal spacer (8 wells, 0.12 mm deep, Invitrogen). Images were acquired on an Olympus Fluoview FV1000 laser scanning confocal microscope system and AF10-ASW 3.0 acquisition software, using a 60× 1.42 NA Plan Apo objective with 3× zoom and 0.2 µm z-steps. Confocal images were deconvolved with the optical transfer function optimized for that objective using an iterative algorithm of 10 iterations. The histogram was adjusted for the most positive image and applied to all the other images for consistency before saving the images as 24 bit merged TIFF. All z-stacks were processed using Fiji (fiji.sc); the Reslice function was used to generate an x–z slab of the stack.
Supplementary Material 1 2 3 4
📊 Figures
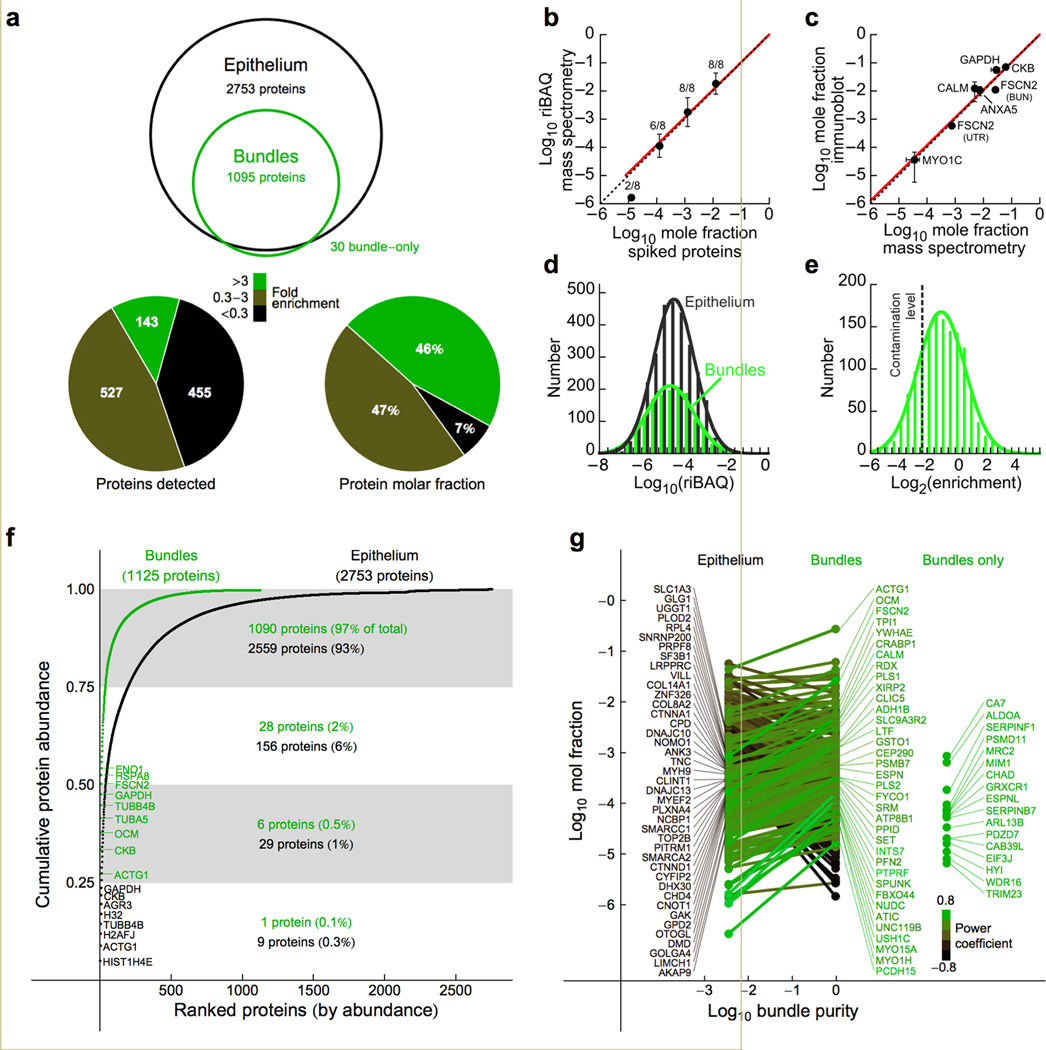
Figure 1
Quantitative analysis of chick hair-bundle proteins. ( a ) Top , proteins identified in bundles and epithelium (2 or more experiments). Bottom left , representation of bundle proteins as bundle-enrich...
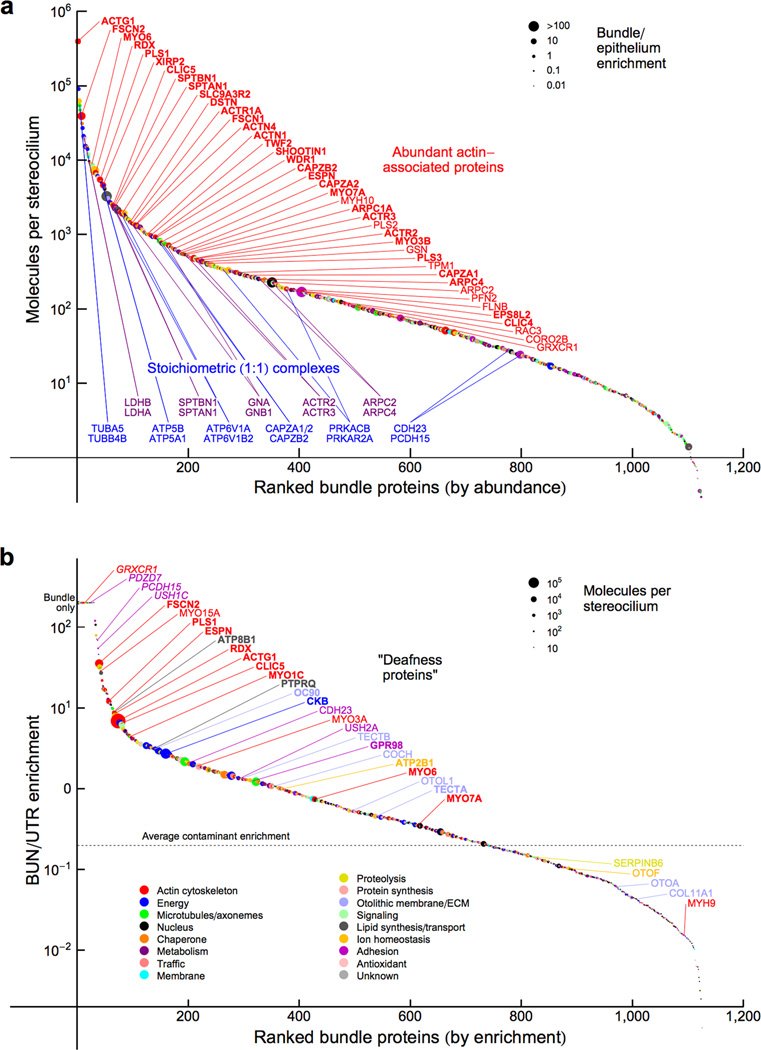
Figure 2
Protein composition of chick hair bundles. ( a ) Hair bundle proteins ranked in order of abundance. Data-point color indicates protein class (key in panel b ); symbol size represents bundle-to-epithel...
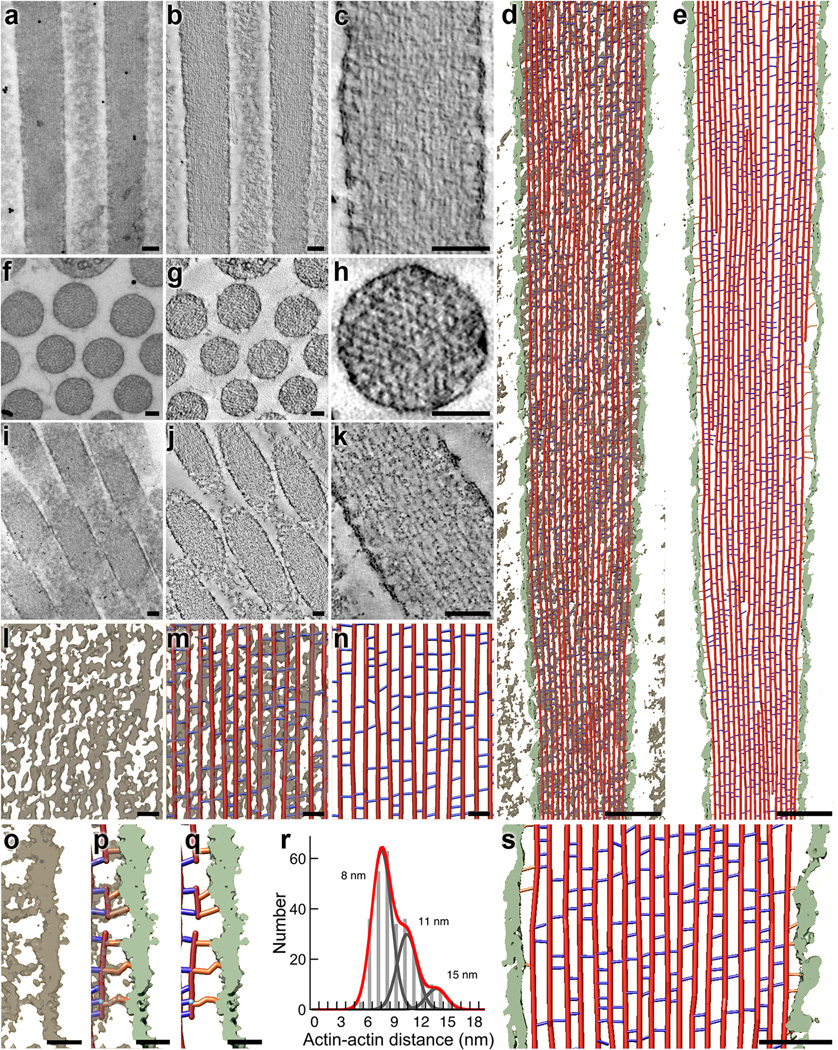
Figure 3
Electron tomography of chick stereocilia. ( au2013c ) Tomogram from a stereocilium oriented longitudinally with respect to the plane of section. ( a ) Two-dimensional 0u00b0 tilt projection image reco...
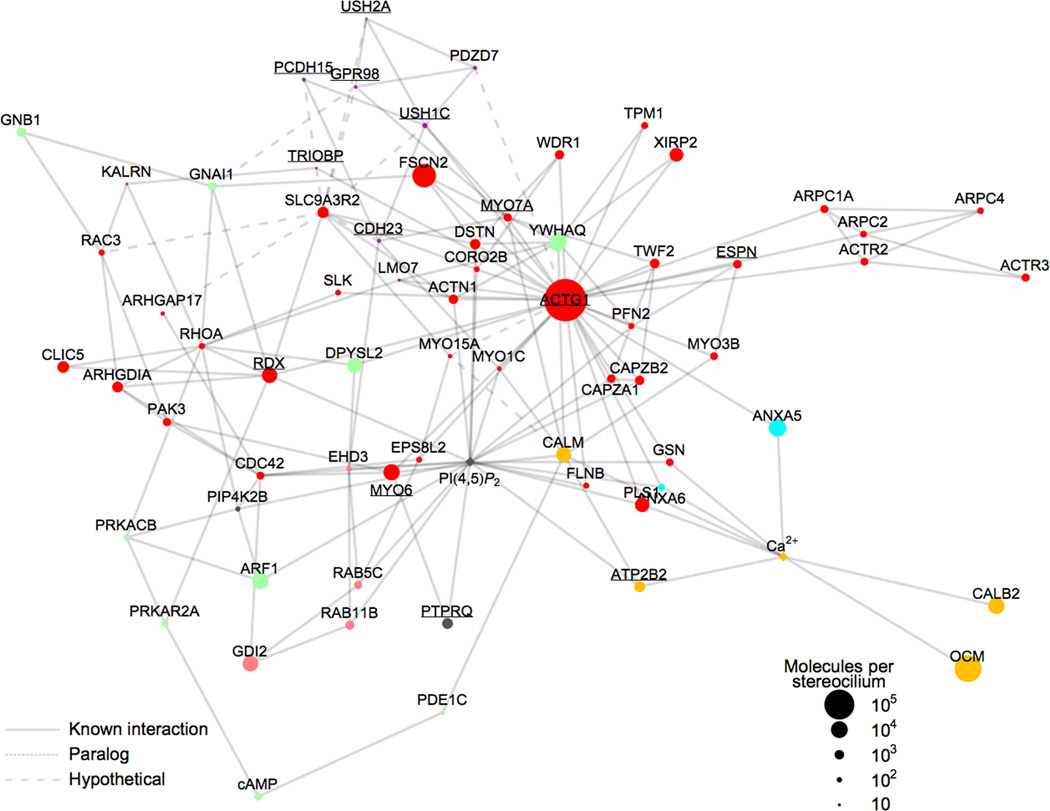
Figure 4
Interaction network for hair-bundle proteins. Symbols (nodes) represent bundle proteins or second messengers; only nodes with two or more interactions are plotted, with exceptions of OCM and CALB2. Un...
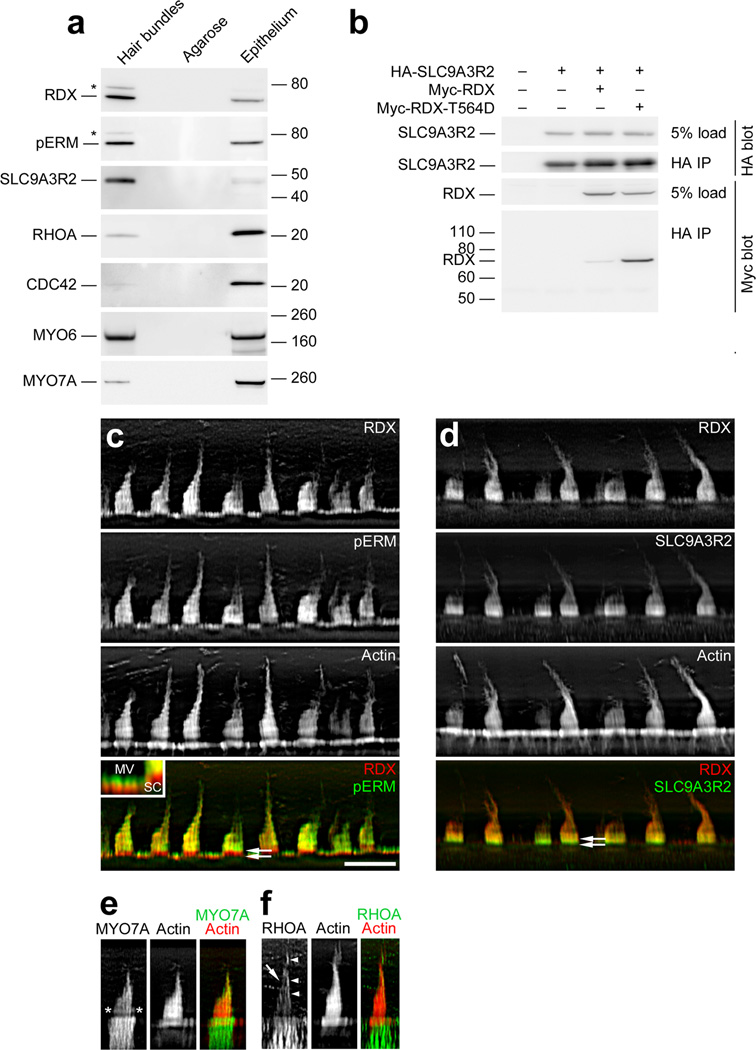
Figure 5
Identification of RDX and SLC9A3R2 in hair bundles. ( a ) Protein immunoblotting with purified hair bundles. Lanes from left to right for each blot: Hair bundles , bundles from 40 chick ears (~0.6 u00...
Figure images are served from the NIH/NLM PubMed Central Open Access Subset or Europe PMC; copyright remains with the publishers and authors.
💬 Discussion
0 commentsNo comments yet. Be the first to start a discussion!
Leave a Comment