Abstract
The initial step in target cell infection by human, and the closely related simian immunodeficiency viruses (HIV and SIV, respectively) occurs with the binding of trimeric envelope glycoproteins (Env), composed of heterodimers of the viral transmembrane glycoprotein (gp41) and surface glycoprotein (gp120) to target T-cells. Knowledge of the molecular structure of trimeric Env on intact viruses is important both for understanding the molecular mechanisms underlying virus-cell interactions and for the design of effective immunogen-based vaccines to combat HIV/AIDS. Previous analyses of intact HIV-1 BaL virions have already resulted in structures of trimeric Env in unliganded and CD4-liganded states at ~20 Å resolution. Here, we show that the molecular architectures of trimeric Env from SIVmneE11S, SIVmac239 and HIV-1 R3A strains are closely comparable to that previously determined for HIV-1 BaL, with the V1 and V2 variable loops located at the apex of the spike, close to the contact zone between virus and cell. The location of the V1/V2 loops in trimeric Env was definitively confirmed by structural analysis of HIV-1 R3A virions engineered to express Env with deletion of these loops. Strikingly, in SIV CP-MAC, a CD4-independent strain, trimeric Env is in a constitutively "open" conformation with gp120 trimers splayed out in a conformation similar to that seen for HIV-1 BaL Env when it is complexed with sCD4 and the CD4i antibody 17b. Our findings suggest a structural explanation for the molecular mechanism of CD4-independent viral entry and further establish that cryo-electron tomography can be used to discover distinct, functionally relevant quaternary structures of Env displayed on intact viruses.
🔬 Techniques
🔭 Microscopes
💻 Software
✨ Fluorophores
🧪 Sample Preparation
🔬 Cell Lines
🏭 Microscope Brands
🧪 Reagent Suppliers
📷 Detectors
💻 Software Details
💾 Data Repositories
🏛️ Research Organizations (ROR)
Affiliated research institutions:
📋 Methods
Sample preparation
SIV and HIV-1 viruses were produced by infection of SupT1 cells, treated with 2,2′dithiodipyridine (Aldrithiol-2, AT-2) and purified by sucrose gradient centrifugation to obtain concentrated preparations (typically ∼10 11 virions/mL) that retained functionally intact Env. AT-2 treatment renders viruses non-infectious by preferential covalent modification of internal virion proteins required for infectivity, but under conditions known to maintain the conformational and functional integrity of the viral envelope glycoprotein, including full competence for receptor dependent target cell membrane binding and fusion and viral entry [29] . The SIVmneE11S and SIVmac239 virus preparations, provided by the Biological Products Core of the AIDS and Cancer Virus Program, SAIC Frederick, Inc., were identical to those used in the previous conflicting reports of SIV Env structure for SIVmac239 by Zhu et al. [13] and SIVmneE11S by Zanetti et al. [14] . HIV-1 R3A containing a deletion of all but the first and last amino acid of the V1/V2 loop, plus a Gly-Ala-Gly linker, has been previously described [17] . Holey carbon-coated 200 mesh grids for electron microscopy were purchased from Quantifoil GmbH (Jena, Germany) and glow-discharged immediately prior to specimen preparation. 7D3 antibody was purified from mouse ascites fluid with Pierce NAb Spin Kits using Protein G resin, and added to CP-MAC at a concentration of 4 µM and incubated on ice for 30 minutes. Samples were deposited on the grids at room temperature and transferred to the chamber of a Mark III Vitrobot (FEI Company, OR) maintained at 25°C and 100% humidity. Grids were then blotted for 6 sec and plunged into liquid ethane cooled by liquid nitrogen. The total length of time that the specimens were handled at room temperature before plunge-freezing was ∼3–4 minutes.
Show full methods section
Sample preparation
SIV and HIV-1 viruses were produced by infection of SupT1 cells, treated with 2,2′dithiodipyridine (Aldrithiol-2, AT-2) and purified by sucrose gradient centrifugation to obtain concentrated preparations (typically ∼10 11 virions/mL) that retained functionally intact Env. AT-2 treatment renders viruses non-infectious by preferential covalent modification of internal virion proteins required for infectivity, but under conditions known to maintain the conformational and functional integrity of the viral envelope glycoprotein, including full competence for receptor dependent target cell membrane binding and fusion and viral entry [29] . The SIVmneE11S and SIVmac239 virus preparations, provided by the Biological Products Core of the AIDS and Cancer Virus Program, SAIC Frederick, Inc., were identical to those used in the previous conflicting reports of SIV Env structure for SIVmac239 by Zhu et al. [13] and SIVmneE11S by Zanetti et al. [14] . HIV-1 R3A containing a deletion of all but the first and last amino acid of the V1/V2 loop, plus a Gly-Ala-Gly linker, has been previously described [17] . Holey carbon-coated 200 mesh grids for electron microscopy were purchased from Quantifoil GmbH (Jena, Germany) and glow-discharged immediately prior to specimen preparation. 7D3 antibody was purified from mouse ascites fluid with Pierce NAb Spin Kits using Protein G resin, and added to CP-MAC at a concentration of 4 µM and incubated on ice for 30 minutes. Samples were deposited on the grids at room temperature and transferred to the chamber of a Mark III Vitrobot (FEI Company, OR) maintained at 25°C and 100% humidity. Grids were then blotted for 6 sec and plunged into liquid ethane cooled by liquid nitrogen. The total length of time that the specimens were handled at room temperature before plunge-freezing was ∼3–4 minutes.
Infectivity assay
CD4-independent replication of SIVmac239 and CP-MAC was determined by adding virus (50 ng of p27 gag ) to SupT1 cells or BC7 (a CD4-negative variant of SupT1), that were engineered to stably express human or rhesus CCR5 [30] . Cells were washed after 18 hours to remove exogenous virus and reverse transcriptase levels in culture supernatant determined over time. Infection was also monitored directly by immunofluorescence microscopy on methanol/acetone fixed cells using an anti-p27 gag monoclonal antibody ( Figure S8 ). Whole virion ELISA Based on estimated Env concentrations, whole virions were equally coated onto a 96-well plate, sealed and incubated overnight at 4°C. All subsequent steps were performed at 4°C and washes were performed with cold TNE buffer (100 mM Tris, 150 mM NaCl and 1 mM EDTA pH = 7.5). Wells were washed once, blocked with 1% BSA for 1 hour, and washed three more times. Primary 7D3antibody (1 µg/mL) was incubated for 1 hour and washed three times. Goat α-Mouse IgG, H and L chain alkaline phosphatase-conjugated secondary antibody (Calbiochem EMD, 1∶5000 dilution) was incubated for 1 hour and three washes were performed. 4-nitrophenyl phosphate (Sigma-Aldrich, 1 mg/mL) in alkaline phosphatase substrate buffer (50 mM NaHCO 3 , 1 mM MgCl 2 , pH = 9.8) was added at 25°C and absorbance was measured at 405 nm at various time points until saturation. Controls against non-specific binding of primary and secondary antibodies were performed and data were corrected accordingly.
Data for cryo-electron tomography
Data sets were collected on an energy-filtered (Gatan) Tecnai G2 Polara transmission electron microsocope (FEI, Netherlands) equipped with a 2K×2K post-energy filter CCD camera, operated at 200 kV and with the specimen maintained at −193°C. Data collection was carried out over a tilt range spanning ± 65° with tilt increments ranging from 1–2° and a defocus of 2.5 µm, with pixel sizes of 4.1 Å at the level of the specimen. Doses used for each image were between 1–2 el/Å 2 . Tilt series were aligned using manual fiducial-based alignment as implemented in IMOD [31] . Protein A gold fiducials (10 nm) were selected, tracked and positions refined. Tomograms were then reconstructed using R-weighted back projection. Virion centroids were identified manually and subtomograms (480×480×480 voxels) containing only the virions were selected. The final number of tilt series used for reconstruction for the SIVmneE11S, SIVmac239, SIV CP-MAC and SIV CP-MAC/7D3 maps were 21, 54, 57 and 37, respectively, consisting of 136, 305, 257 and 208 virions respectively, yielding 3800, 4576, 3797 and 1600 putative spikes, respectively.
Particle picking
For purposes of selection of Env spikes, virion subtomograms were down-sampled by a factor of 4, denoised using edge-enhancing anisotropic diffusion as implemented in IMOD and subjected to unsupervised membrane segmentation using an energy-based three-dimensional approach [32] . In order to identify the location of spikes in an automated manner, a scalar value was associated to every point on the segmented virion surface corresponding to the cross-correlation value between an external 3D template and the image data immediately outside the membrane. Spikes were identified at the locations corresponding to the local maxima of this function that were above a given threshold. A cylindrically symmetric phantom was used as a template for the search; the same template was used for all maps. Classification and averaging Subvolumes (100×100×100 voxels) corresponding to reconstructions of individual spikes (without denoising or binning) were cut from the virion subtomograms at the automatically extracted positions. The orientations of the long axis of the spike were determined using the normal to the automatically segmented membrane at the location of each spike, providing initial estimates for two of the three Euler angles. The remaining in-plane rotation was initially randomized to prevent any possible bias in subsequent alignments. After application of the Euler angles, sub-volumes were translationally aligned to their cylindrically averaged global average to ensure they all shared the same center of mass. The 10% of subvolumes that correlated most poorly with the updated global average were left out of the analysis. Spike volumes were aligned and classified without using external references and with proper accounting of the missing wedge using the framework described in Bartesaghi et al. [10] . Subvolume alignments were progressively refined at each iteration and spike volumes repeatedly clustered into 10 classes. Early stages of classification clearly showed classes with inherent 3-fold symmetry, and typically at the fourth iteration, 3-fold symmetry was imposed. At each round, the classes that showed the most clearly delineated features in all regions of the spike (typically ∼50–60%) were selected and combined to be used as reference for the next round. Typically ∼4000 spikes were selected for each dataset. Final maps were obtained after ∼5–12 refinement rounds and included contributions from ∼50% of sub-volumes in each dataset. The computational procedures we have used to obtain 3D density maps by averaging tomographic subvolumes were extensively tested first using simulated phantom objects to develop robust alignment and classification routines that take into account the missing wedge data and faithfully recover 3D structures from a series of heterogeneous 3D objects [10] . Experimental assessment of the computational developments were followed by obtaining 3D tomographic models of purified GroEL, a multimeric molecular complex whose structure is known at high resolution from X-ray crystallographic analysis, thereby enabling quantitative evaluation of each map. This computational approach yielded a 26 Å GroEL structure from as few as ∼300 volumes and without imposition of 7-fold symmetry inherent to the GroEL complex [10] . Application of these methods to ∼3000–4000 tomographic volumes of trimeric Env from SIV/HIV-1 strains resulted in maps at a resolution of ∼20 Å ( Figure S6 ). The classes are relatively homogeneous at the end of the refinement as illustrated by inspecting sections through the maps corresponding to each class average ( Figure S7 ). Notably, the computational procedures used by Zhu et al. [13] did not employ procedures to correct for the missing wedge, did not use either reference-free methods for 3D alignment of the individual spike subvolumes, or reference-free methods for image classification. The procedures used by Zanetti et al. [14] used missing wedge correction, but did not use image classification within the iterative alignment procedure.
Coordinate fitting
Steepest-ascent local optimization, as implemented in UCSF Chimera was utilized for fitting coordinates into density maps [33] . Coordinates were initially placed in random orientations and local maxima of the sum of pointwise products between the coordinates and the map were determined. Fitting was performed to convergence by performing multiples of 100 steepest ascent steps. Atomic coordinates were fit by generating a map simulated from the atomic coordinates at 20 Å. The fits shown in Figure 2 – 5 and Figure 7 were carried out using 1GC1 coordinates. These coordinates contain a truncated version (residues 119–129, and 194–202) of the V1/V2 loop region (spanning residues 119–202). To eliminate any bias in the fits from the inclusion of the partial loop residues present in the coordinates, they were excluded for purposes of coordinate fitting; even with their inclusion there were no significant changes in the fits. To fit the 7D3 density, the atomic coordinates for 17b were utilized and originally placed in difference density calculated from subtracting the CP-MAC density map from the 7D3-bound CP-MAC map and the 7D3 position was further refined to convergence.
Supporting Information Figure S1 Previously reported Env molecular architecture and trimeric models using gp120 coordinates. (a–d) Previously reported density maps for trimeric HIV-1 and SIV Env based on cryo-electron tomography combined with 3D averaging for trimeric Env from (a) SIVmac239 from Zhu et al. (Roux and colleagues 2006; [13] ), (b) SIVmneE11S from Zanetti et al. (Fuller and colleagues 2006; [14] ), (c) HIV-1 BaL from Zhu et al (Roux and colleagues 2008; [16] ) and (d) HIV-1 BaL from our laboratory [15] . All four maps are shown as isosurface representations. (2.15 MB TIF) Click here for additional data file. Figure S2 Expanded version of Figure 1d showing slices through the density map of trimeric SIVmneE11S Env at each iteration (from 1 to 7). The slices, spaced by 4.1 Å, are oriented with the bottom slices corresponding to the viral membrane, and top slices corresponding to the apex of the spike. A surface representation of the density map (same as Figure 1f ) is presented at right to provide a reference for the orientation of the stack of slices. (2.36 MB TIF) Click here for additional data file. Figure S3 Comparison of fits of 1GC1 (a, b) and 2BF1 (c, d) coordinates to the density map for trimeric SIVmneE11S Env. Two thresholds are shown, the lower threshold is more transparent as shown in Figure 1f–1h and the higher threshold is less transparent, highlighting the shape of gp120 density and corresponding coordinate fits. (a, b) Front and top views, respectively, of the fit of the coordinates [7] for gp120 (red ribbons) reported for the complex formed between truncated monomeric HIV-1 gp120, sCD4 and the Fab fragment of 17b to the experimentally derived density map for unliganded SIVmneE11S. These fits were derived by automated fitting of the coordinates to the density map using procedures implemented in the visualization program UCSF Chimera [33] . Other previously reported coordinates for HIV-1 gp120 in the sCD4-liganded state (2B4C and 2NY7) also resulted in similar orientations for gp120 in the density maps with density for the V1/V2 loops at the top of the spike (black arrows). (c, d) Front and top views, respectively, of the fit of the coordinates for gp120 previously reported for unliganded, monomeric SIV gp120 [7] (yellow ribbons) to the experimentally derived density map for unliganded SIVmneE11S. The orientations of gp120 shown to match that presented in the theoretical model proposed by Chen et al. [5] based on their crystallographic structure of unliganded, truncated SIV gp120. In this model, the V1/V2 loop regions were proposed to lie near the outer periphery of the base of the spike. (2.58 MB TIF) Click here for additional data file. Figure S4 Fit of gp120 coordinates to density map of the SIVnmeE11S Env spike. Density maps (green transparent isosurface in a, b, c) corresponding to the structures available for the truncated gp120 core (magenta ribbons) were computed at 20 Å resolution and these were fit into the experimentally determined density maps for the native spike using automated fitting functions implemented in the software package Chimera; front (d, e, f) and top (g, h, i) views are shown. The map orientation is identical in panels (a)–(f), and orthogonal to the orientation shown in panels (g)–(i). Visual inspection shows that the shapes of the 1GC1 (a, d, g) and 2NY7 (b, e, h) coordinates follow the shape of the experimentally determined map, while the 2BF1 (c, f, i) coordinates do not show obvious shape complementarity. The red spheres indicate the likely positions of the V1/V2 loop regions based on location of the corresponding truncated loops in the coordinates. In the 1GC1 and 2NY7 coordinates, the estimated location of the V1/V2 loop shows an excellent correspondence to the region of unassigned density at the apex of the spike, while the estimated location of this loop in the 2BF1 coordinates falls in a region of the density map where there is no unassigned density, and is not consistent with the observed architecture of the spike. All three sets of coordinates have significant deletions in the N and C-terminal regions which are expected to reside at the base of the spike, corresponding to the unassigned density visible in the map. As in Figure 2g and 2h , the 2BF1 coordinates were positioned in an orientation that corresponds to the preferred positions suggested by Chen et al. [5] . (3.62 MB TIF) Click here for additional data file. Figure S5 (a,b) Quantitative estimate of fit of different gp120 coordinates to density maps for SIVmneE11S (a) and SIVmac239 (b) Env by calculation of the number of atoms that are excluded in the map over a range of density thresholds. Using the best fits determined for gp120 from 1GC1 and 2NY7 and Chen's theoretical model for 2BF1 [5] , threshold values for density map visualization were progressively varied. At each threshold value, the proportion of atoms that fall outside the map contour was calculated. The plot shows that compared to the fits obtained using 1GC1 or 2NY7 coordinates, a substantially higher proportion of atoms are distributed outside the map contour when 2BF1 coordinates are used to carry out the fits for both SIVmneE11S and SIVmac239 Env. (0.95 MB TIF) Click here for additional data file.
Figure S6 Fourier Shell Correlation
(FSC) plots of the final maps for SIVmneE11S (red), SIVmac239 (green) and SIV CP-MAC (blue). The resolution at which the Fourier shell correlation drops to 0.5 is taken to represent the resolution limit of the density maps. FSC resolution estimates are ∼21 Å for all three maps. (0.13 MB TIF) Click here for additional data file. Figure S7 Illustration of class variation at the end of refinement of trimeric Env from SIVmneE11S, SIVmac239 and SIV CP-MAC viruses. Each row represents a class average obtained utilizing ∼ 4000 subvolumes. Sections through the density map of each class average are shown starting from the level of the lipid bilayer membrane (left end) to the top of the spike (right end) for the ten image classes. Each class average is very similar, but the classes with the highest signal-to-noise ratios and closest correlation coefficients (for example, classes 3, 4, 5, 7, 8 and 10 in SIVmneE11S) are averaged together to generate the final 3D averaged maps (bottom row). (4.64 MB TIF) Click here for additional data file. Figure S8 Detection of viral antigens on SIV CP-MAC- and SIVmac239- infected cells. BC7/Rh-CCR5 (CD4-negative; rhesus CCR5 positive) and SupT1/Hu-CCR5 (CD4-positive; human CCR5 positive) were inoculated with SIV CP-MAC or SIVmac239 and viral antigens assayed on day 8 by immunofluorescence microscopy with a p27 gag monoclonal antibody. Corresponding to the values for reverse transcriptase activity in culture supernatnants (see Figures 4a and 4b ), SIV CP-MAC can infect both CD4-positive and -negative cells; SIVmac239 can only infect the CD4-positive SupT1/Hu-CCR5 cells, with only background fluorescence detectable on BC7/Rh-CCR5 cells. (2.59 MB TIF) Click here for additional data file. Video S1 Tomographic reconstruction of SIVmneE11S virions displaying envelope glycoproteins. (8.95 MB WMV) Click here for additional data file. Video S2 Tomographic reconstruction of SIVmac239 virions displaying envelope glycoproteins (Env). (10.70 MB WMV) Click here for additional data file.
📊 Figures
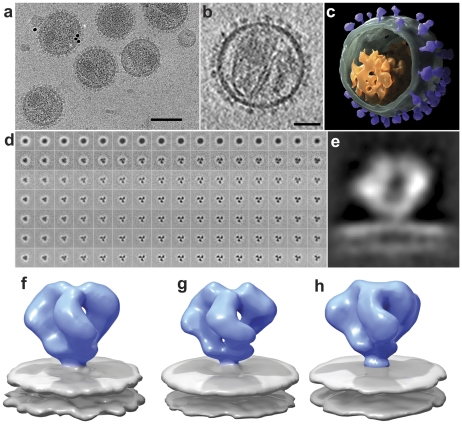
Figure 1
Cryo-electron tomography and molecular architecture of trimeric SIV Env.
(a) Low-dose (12 electrons/u00c5 2 ) projection image recorded from purified SIVmneE11S virions plunge-frozen directly in physiological buffer. The dark spots are 10 nm-sized gold particles that serve...
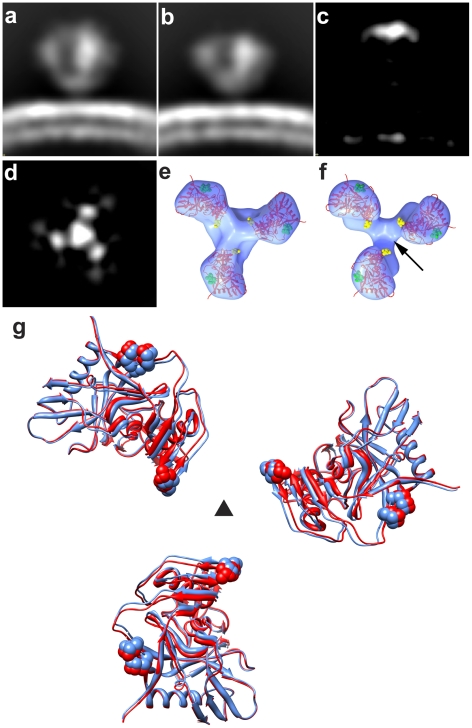
Figure 2
Structural analysis of full-length and V1/V2 loop-deleted HIV-1 R3A trimeric Env.
(a, b) Side view of raw density projections for full-length trimeric HIV-1 R3A Env (a) and the V1/V2-loop deleted HIV-1 R3A mutant (b) showing the loss of density at the apex in the mutant. This is co...
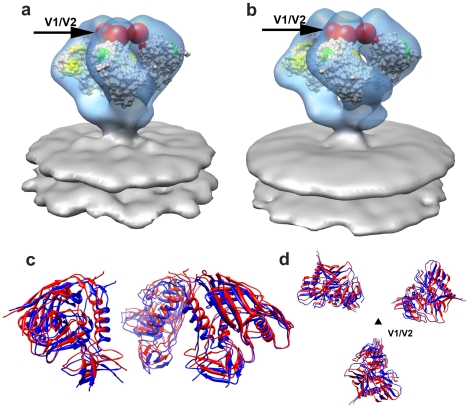
Figure 3
Molecular architecture of trimeric SIV Env.
(a, b) Perspective views of gp120 monomer coordinates (1GC1) fit into the Env density maps obtained from SIVmneE11S (a) and SIVmac239 (b) using automated procedures. Maps are rendered as transparent i...
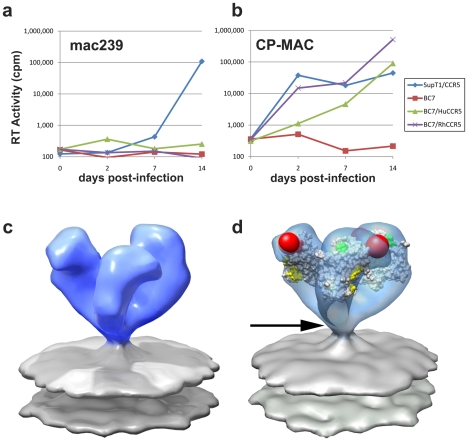
Figure 4
Molecular architecture of constitutively open trimeric SIV Env from the CD4-independent CP-MAC strain.
(a,b) Demonstration of CD4-independent viral entry by SIV CP-MAC virus based on infectivity as determined on CD4 + (SupT1) or CD4 u2212 (BC7) cells bearing human or rhesus CCR5 for SIVmac239 (a) or SI...
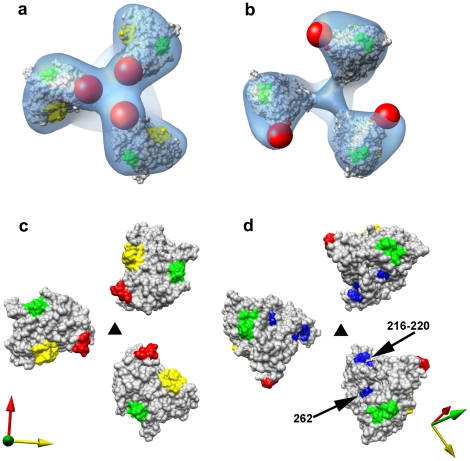
Figure 5
Closed and open states of trimeric SIV Env.
(a, b) Top views of the density maps of (a) closed (SIVmneE11S) and (b) open (SIV CP-MAC) states fitted with gp120 coordinates. The missing V1/V2 loop is represented by the red sphere to highlight the...
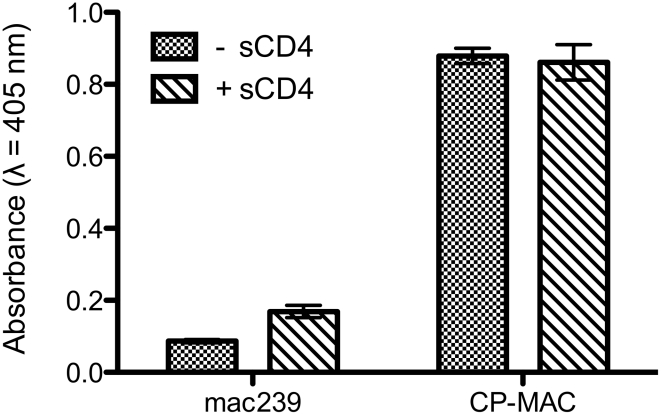
Figure 6
ELISA analysis comparing the binding of 7D3 to either SIVmac239 or SIV CP-MAC viruses.
The binding analyses, carried out under the same conditions as the tomographic experiments, show that in contrast to SIVmac239, SIV CP-MAC binds efficiently to 7D3 in the absence and presence of added...
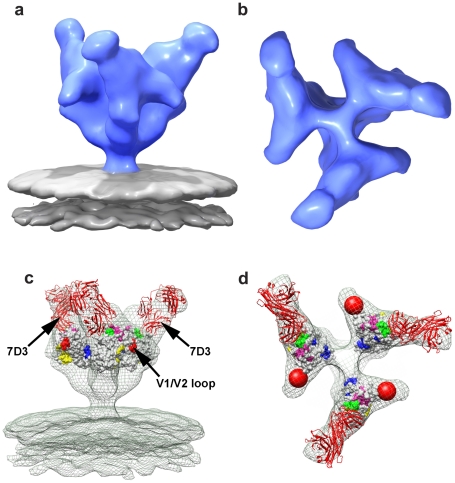
Figure 7
Molecular architecture of co-receptor-binding site antibody (7D3) complexes on SIV CP-MAC Env and fitted gp120 coordinates.
(a, b) Perspective (a) and top (b) views of 7D3-bound SIV CP-MAC Env rendered as isosurfaces. (c, d) Fit of gp120 coordinates shown as isosurfaces to the density maps (green mesh) for 7D3-bound SIV CP...
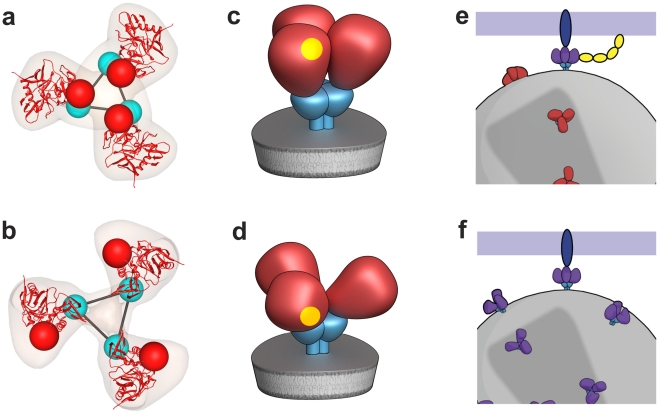
Figure 8
Distinct quaternary conformational states of trimeric Env.
(a,b) Top views of fitted density maps for experimentally derived maps of trimeric Env representing the u201cclosedu201d states of SIVmneE11S (a), and the u201copenu201d state of SIV CP-MAC (b). Coord...
Figure images are served from the NIH/NLM PubMed Central Open Access Subset or Europe PMC; copyright remains with the publishers and authors.
💬 Discussion
0 commentsNo comments yet. Be the first to start a discussion!
Leave a Comment