Abstract
Prokaryotic mechanosensitive (MS) channels open by sensing the physical state of the membrane. As such, lipid-protein interactions represent the defining molecular process underlying mechanotransduction. Here, we describe cryo-electron microscopy (cryo-EM) structures of the E. coli small-conductance mechanosensitive channel (MscS) in nanodiscs (ND). They reveal a novel membrane-anchoring fold that plays a significant role in channel activation and establish a new location for the lipid bilayer, shifted ~14 Å from previous consensus placements. Two types of lipid densities are explicitly observed. A phospholipid that 'hooks' the top of each TM2-TM3 hairpin and likely plays a role in force sensing, and a bundle of acyl chains occluding the permeation path above the L105 cuff. These observations reshape our understanding of force-from-lipids gating in MscS and highlight the key role of allosteric interactions between TM segments and phospholipids bound to key dynamic components of the channel.
🔬 Techniques
🧬 Organisms
✨ Fluorophores
🧪 Sample Preparation
🔬 Cell Lines
🏭 Microscope Brands
🧪 Reagent Suppliers
📷 Detectors
💻 Software Details
💻 Code & Software
💾 Data Repositories
🏛️ Research Organizations (ROR)
Affiliated research institutions:
📋 Methods
Key resources table
Reagent type (species) or resource Designation Source or reference Identifiers Additional information Gene ( E. coli Addgene# 7855 6x N-Terminal His-Tag Gene ( E. coli) Addgene# 20066 Strain, strain background (E. coli) MJF465 Ian Booth and Samantha Miller, University of Aberdeen Other POPC Avanti Polar Lipids 850457C Other POPG Avanti Polar Lipids 840457C Other E. coli Polar Lipids Avanti Polar Lipids 100600C Other Bio-Beads SM-2 Resin Bio Rad 1523920 Other Quantifoil 2/2 Mesh 200 Quantifoil Other Quantifoil 1.2/1.3 Mesh 300 Quantifoil Other Octyl Maltoside, Fluorinated Anatrace O310F Other n-Dodecyl-β-D-Maltopyranoside Anatrace D310A Other Fos-Choline-14 Anatrace F312S Strain, strain background (E. coli) Rosetta 2 Millipore Sigma 71400-3 Other Thrombin MP Biomedicals 154163 Bovine MscS expression purification Full-length E. coli MscS was expressed and purified as previously described ( Vásquez et al., 2007 ). In brief, MscS was sub-cloned into pET28a containing a His 6 tag and a thrombin cleavage site on the N-termini. Rosetta 2 (Millipore Sigma) E. coli cells were transformed with MscS-pET28a vector and grown overnight in the presences of kanamycin and chloramphenicol. The cells were diluted 1:100 in LB medium and grown at 37°C to an OD 600 of 0.8-1.0. Before induction, the cell culture was supplemented to a final concentration of 0.4% glycerol and allowed to cool to 26°C, and protein expression was induced with 0.8mM IPTG. The cells were grown for 4h at 26°C and were harvested, and either were frozen at -80°C for later use or immediately resuspended in PBS pH 7.4 (Sigma), 10% glycerol, protease inhibitors, and homogenized (high-pressure homogenizer, EmulsiFlex-C3). The membranes were isolated via centrifugation at 100,000g for 30 min, and the pellet was resuspended in PBS and 10% glycerol. Solubilization was carried out in 1% Fos-Choline (Anatrace) 14 for 4-16h at 4°C. This resuspension was spun down at 100,000g for 30 min, and the supernatant supplemented with a final concentration of 5mM imidazole (Fisher) was incubated with cobalt resin(Clonetech) for 2-4h at 4 °C. The resin was washed with 20-bed volumes of 1 mM DDM(Anatrace), 10mM imidazole and 10% glycerol in PBS buffer. MscS was eluted in 1 mM DDM, 300mM imidazole, and 10% glycerol in PBS buffer. Unless explicitly stated MscS His, thrombin was added to cleave the his tag and incubated overnight. The final purification step was to run the protein on a Superdex 200 Increase 10/30 column (GE Healthcare) with 1 mM DDM and PBS buffer. The removal of glycerol is critical for EM grid preparation. The typical yield of MscS is about 5-8mg per liter of E. coli . For the MscS-Cryst construct, residues 2-26 residues were removed and subcloned into pQE70 and grown in MJF465 E. coli cells (to avoid co-assembly with chromosomal wt-MscS), a gift from Ian Booth ( Levina et al., 1999 ). Typical yield of MscS-Cryst is less than 0.1mg per liter of MJF465 E. coli . Otherwise, the purification steps were the same. The MscS structure solved in DDM was solubilized in 1% DDM instead of Fos-Choline 14.
Show full methods section
Key resources table
Reagent type (species) or resource Designation Source or reference Identifiers Additional information Gene ( E. coli Addgene# 7855 6x N-Terminal His-Tag Gene ( E. coli) Addgene# 20066 Strain, strain background (E. coli) MJF465 Ian Booth and Samantha Miller, University of Aberdeen Other POPC Avanti Polar Lipids 850457C Other POPG Avanti Polar Lipids 840457C Other E. coli Polar Lipids Avanti Polar Lipids 100600C Other Bio-Beads SM-2 Resin Bio Rad 1523920 Other Quantifoil 2/2 Mesh 200 Quantifoil Other Quantifoil 1.2/1.3 Mesh 300 Quantifoil Other Octyl Maltoside, Fluorinated Anatrace O310F Other n-Dodecyl-β-D-Maltopyranoside Anatrace D310A Other Fos-Choline-14 Anatrace F312S Strain, strain background (E. coli) Rosetta 2 Millipore Sigma 71400-3 Other Thrombin MP Biomedicals 154163 Bovine MscS expression purification Full-length E. coli MscS was expressed and purified as previously described ( Vásquez et al., 2007 ). In brief, MscS was sub-cloned into pET28a containing a His 6 tag and a thrombin cleavage site on the N-termini. Rosetta 2 (Millipore Sigma) E. coli cells were transformed with MscS-pET28a vector and grown overnight in the presences of kanamycin and chloramphenicol. The cells were diluted 1:100 in LB medium and grown at 37°C to an OD 600 of 0.8-1.0. Before induction, the cell culture was supplemented to a final concentration of 0.4% glycerol and allowed to cool to 26°C, and protein expression was induced with 0.8mM IPTG. The cells were grown for 4h at 26°C and were harvested, and either were frozen at -80°C for later use or immediately resuspended in PBS pH 7.4 (Sigma), 10% glycerol, protease inhibitors, and homogenized (high-pressure homogenizer, EmulsiFlex-C3). The membranes were isolated via centrifugation at 100,000g for 30 min, and the pellet was resuspended in PBS and 10% glycerol. Solubilization was carried out in 1% Fos-Choline (Anatrace) 14 for 4-16h at 4°C. This resuspension was spun down at 100,000g for 30 min, and the supernatant supplemented with a final concentration of 5mM imidazole (Fisher) was incubated with cobalt resin(Clonetech) for 2-4h at 4 °C. The resin was washed with 20-bed volumes of 1 mM DDM(Anatrace), 10mM imidazole and 10% glycerol in PBS buffer. MscS was eluted in 1 mM DDM, 300mM imidazole, and 10% glycerol in PBS buffer. Unless explicitly stated MscS His, thrombin was added to cleave the his tag and incubated overnight. The final purification step was to run the protein on a Superdex 200 Increase 10/30 column (GE Healthcare) with 1 mM DDM and PBS buffer. The removal of glycerol is critical for EM grid preparation. The typical yield of MscS is about 5-8mg per liter of E. coli . For the MscS-Cryst construct, residues 2-26 residues were removed and subcloned into pQE70 and grown in MJF465 E. coli cells (to avoid co-assembly with chromosomal wt-MscS), a gift from Ian Booth ( Levina et al., 1999 ). Typical yield of MscS-Cryst is less than 0.1mg per liter of MJF465 E. coli . Otherwise, the purification steps were the same. The MscS structure solved in DDM was solubilized in 1% DDM instead of Fos-Choline 14.
MscS nanodisc preparation
MscS nanodiscs (ND) were prepared following previously described protocol ( Ritchie et al., 2009 ). Several variants of ND scaffold proteins were tested, and Msp1 E3D1 was deemed the most homogenous by size exclusion. The molar ratio of MscS:MSP1 E3D1:Lipids was 7:10:650, respectively, after extensive optimizations. Each lipid solution of mixed micelles contained 30-50mM DDM with a final lipid concentration of 10-17mM. The compositions of the mixed micelles were either (1-palmitoyl-2-oleoyl-sn-glycero-3-phosphocholine) POPC and (1-palmitoyl-2-oleoylglycero-3-phosphoglycerol) POPG (4:1) or E. coli Polar Lipids (EPL). Nanodiscs were made by adding mix micelles to protein for 20 minutes on ice. MSP was added to the solution and incubated on ice for 5 minutes. The reconstitution mixture was incubated in activated bio beads (Biorad) overnight at 4°C. The detergent free mixture was run on a Superdex 200 Increase 10/30 column to separate the empty ND peak. The MscS ND peak was concentrated to ~2mg/ml and stored at 4°C. EM data collection and structure determination To help with orientation preferences and ice thickness, MscS ND was supplemented with Octyl Maltoside, Fluorinated (Anatrace) to a final concentration of 0.01%. MscS and was applied twice, with a filter paper blotting between each application, onto Mesh 200 2/1 or Mesh 300 1.2/1.3 Quantifoli holey carbon grids and flash frozen in a Vitrobot (Thermofisher) set at 3 seconds with a force of 3 with 100% humidity at 22°C. MscS His ND POPC:POPG, MscS No His ND POPC:POPG, and MscS DDM were collected on a Titan Krios with a K2 detector in counting mode with a GIF energy filter using Latitude S (Thermofisher). Movies were acquired at 1e - /A 2 per frame for 50 frames. MscS ND EPL was collected on Titan Krios with a Falcon 3 detector in counting mode. MscS-Cryst ND POPC:POPG was collected on Talos Artica with a Falcon 3 detector in counting mode. Movies were acquired at 1e - /A 2 per frame for 50 frames. Motion correction was performed using Motioncor2 ( Zheng et al., 2017 ), and K2 movies were binned by 2. CTF estimation was done using CTFFIND4.1 ( Rohou and Grigorieff, 2015 ). Initial particle picking was done using Eman’s ( Tang et al., 2007 ) neural net particle picker or Relion’s built-in reference based auto picker and the coordinates were fed into Relion ( Scheres, 2012 ) for particle extraction. Subsequent structure determination steps were done in Relion. An initial 2D refinement was done to remove non-particles and poor-quality classes, which were fed into 3D classification. 3D classification was performed using the MscS crystal structure as an initial model. After a subset of particles were identified for the final refinement, the particles underwent per particle CTF refinement followed by Bayesian polishing. The final 3D reconstruction used the classes with both top and side views and refined using a tight mask excluding the membrane and his-tag (when necessary) and C7 symmetry. Model building was based on the MscS crystal structure (PDBID: 2OAU) and used coot to build the remaining TM1, N-terminal domain, and the hook and pore lipids. EM density maps used in subsequent steps were not were not postprocessed or sharpened. While postprocessing and sharpening did improve the density for the most part, the N-terminal domain became much noiser. The initially built model was iteratively refined using Coot ( Emsley et al., 2010 ), Chimera ( Pettersen et al., 2004 ), MDFF ( McGreevy et al., 2014 ) using VMD ( Humphrey et al., 1996 ) and NAMD ( Phillips et al., 2005 ) or ChimeraX ( Goddard et al., 2018 ) with the ISOLDE ( Croll, 2018 ) plugin, Arp/Warp ( Langer et al., 2008 ), and Phenix’s ( Adams et al., 2010 ) real space refine.
Downshock assay
Downshock assays were performed from a modified protocol from what was previously described ( Batiza et al., 2002 ; Vásquez et al., 2007 ). MJF465 cells transformed with various MscS mutants in pEQ70 were grown modified Luria-Bertani (LB) medium with 500mM NaCl and 100µg/ml ampicillin(Fisher), 50 µg/ml kanamycin(Fisher), and 25 µg/ml chloramphenicol(Fisher) at 37°C to an OD 600 of 0.6. The cells were cooled to room temperature and induced with 1 mM IPTG (Fisher) for 2 hours at 25°C. The OD 600 was measured and downshocks were performed by diluting cells 1:50 into a modified LB medium at 50mM NaCl and 1:100 was plated on standard LB agar plates overnight at 37°C. The colonies on the LB agar plates were imaged and counted and normalized by the OD 600 readings. Additionally, to assess the expression of each mutant, a western blot was performed. The western blot of each MscS expressing mutant was from a pellet from the downshock experiment and resuspended in PBS and SDS to a final 1% solution. The lysate was then sonicated, ran on a 4-20% SDS-PAGE gel (Biorad), transferred to PVDF and probed with the Penta-HIS(Qiagen) primary and anti-mouse conjugated to Alexa 488 secondary.
Phylogeny analyses
Enterobacteriales and Vibrionales MscS protein sequences were extracted from the complete proteomes in the NCBI Assembly database. From each proteome, only one protein showing the highest BLAST bit score ( Camacho et al., 2009 ) to the E. coli MscS protein query was extracted. Sequences were aligned using MUSCLE (v.3.5) ( Edgar, 2004 ), and the ML phylogeny was inferred using RAxML (v.8.2.11) ( Stamatakis, 2014 ) (best-fit model of evolution: LG+G+X). The schematic representation of the phylogeny was generated using iTOL ( Letunic and Bork, 2019 ). The relative rate of evolution for each site was inferred from an alignment of Enterobacteriales MscS proteins using RAxML (v.8.2.11) ( Stamatakis, 2014 ).The rate of evolution was mapped on protein structure using Chimera ( Pettersen et al., 2004 ). The sequence logo was generated from an alignment of Enterobacteriales MscS proteins using WebLogo 3 ( Crooks et al., 2004 ).
Proteoliposome preparation and patch clamp electrophysiology
Proto-liposomes were prepared using Dehydration Rehydration (D/R) method as fully described in previous studies ( Nomura et al., 2015 ). Briefly, Avanti soybean lipid dissolved in chloroform were dried with nitrogen flow to create a thin lipid film on a glass tube. The film was suspended and vortexed with D/R buffer (200 mM KCl, 5 mM HEPES, adjusted to pH 7.2 with KOH) and was subjected to 15 min of sonication. MscS was added to the lipid at a protein to lipid ratio of 1:200 (w/w) and incubated at 4°C for 1 h. to remove detergent, Biobeads (BioRad,Hercules,CA, USA) were added and incubated at 4°C overnight (minimum 3 h). The proteoliposomes were collected by ultracentrifugation and resuspended in 50 ml of D/R buffer. Small aliquots were spotted onto the glass cover slips and dehydrated overnight under vacuum conditions and at 4°C. The dried proteoliposomes were then rehydrated with 20-25 µl D/R buffer. After 6 h incubation at 4°C, they are ready for electrophysiological experimentation. The channel activity was examined in excised (inside-out) configuration. An isotonic recording solution were used in the bath and pipette (200 mM KCl, 40 mM MgCl2, and 5 mM HEPES adjusted to pH 7.2 with KOH). Borosilicate glass pipettes were pulled using Sutter micropipette puller (P-1000, Flaming/Brown). The resistance of the capillary pipettes was from 2 to 4 mOhm. The current was amplified with an Axopatch 200B amplifier (Molecular Devices, Sunnyvale, CA, USA), filtered at 2 kHz and the data acquired at 5 kHz with a Digidata 1322A (Axon instruments) interface using pCLAMP 10 acquisition software (Molecular Devices). Negative pressure was applied using High Speed Pressure Clamp-1 apparatus (ALA Scientific Instruments, Farmingdale, NY, USA). All-atom molecular dynamics (MD) simulation CHARMM GUI was used to embed MscS structure into a POPC:POPG (4:1) bilayer mix (to mimic our nanodisc lipid composition) ( Jo et al., 2008 ). Different computational models have been generated as listed in Supplementary file 1 The equilibration steps were performed similarly to our previous MD simulation of EcMscL ( Bavi et al., 2016a ). TIP3P water molecule was used to solvate the system. The lipid and water molecules in close proximity to the channel (
📊 Figures
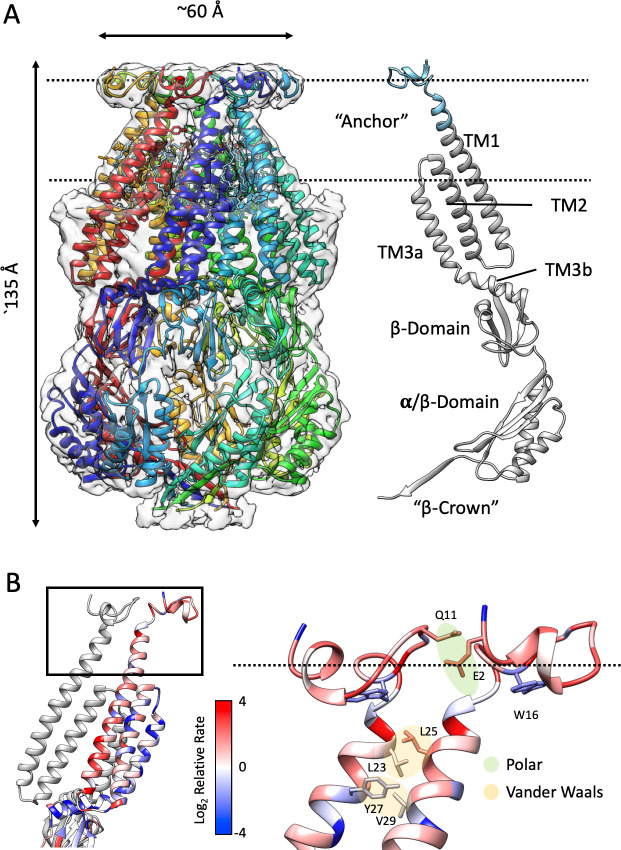
Figure 1.
Structure of membrane-embedded MscS (MscS-ND) and its anchor domain.
( A ) Left, the 3.1 u00c5 resolution structure of the nanodisc-reconstituted (E3D1) MscS heptamer, shown in cartoon representation. Each subunit is shown in a different color. Bound lipids are shown a...
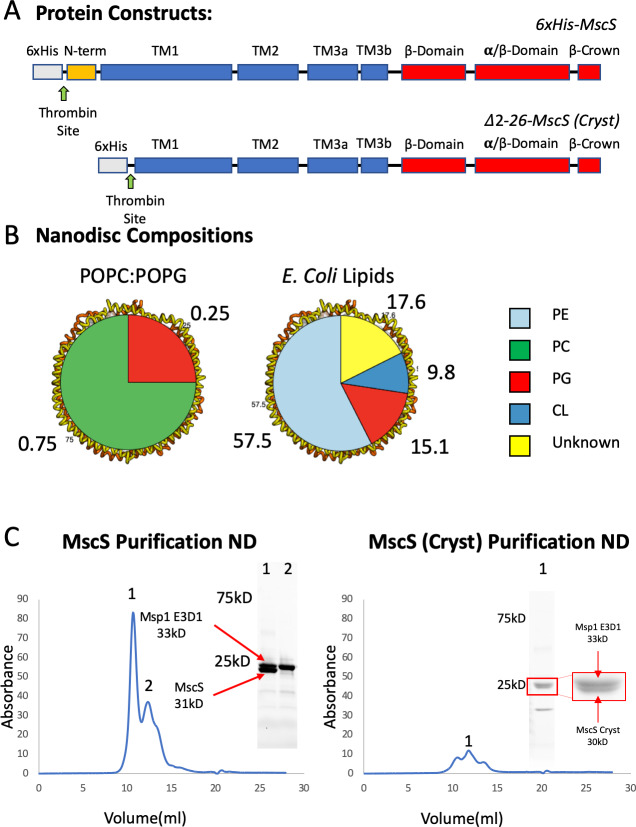
Figure 1u2014figure supplement 1.
MscS Constructs, Nanodisc Composition, and Purification MscS Nanodiscs.
( A ) Overall construction design of wt MscS and MscS-Cryst (u0394 2u201326). ( B ) Nanodisc (ND) lipid compositions. ( C ) Left. A Superdex 200 size exclusion chromatography trace of wt MscS reconsti...
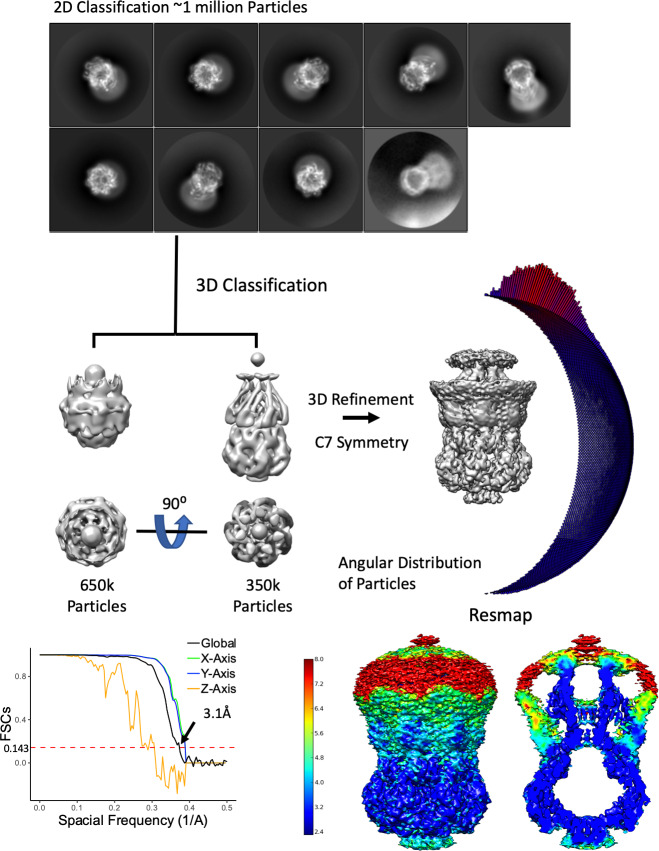
Figure 1u2014figure supplement 2.
Overview of MscS ND Density Refinement Workflow.
From 4403 movies, about 1 million particles were picked and 2D classified. The selected 2D classes were subjected to multiple rounds of 3D classification were truncated (possibly denatured due to the ...
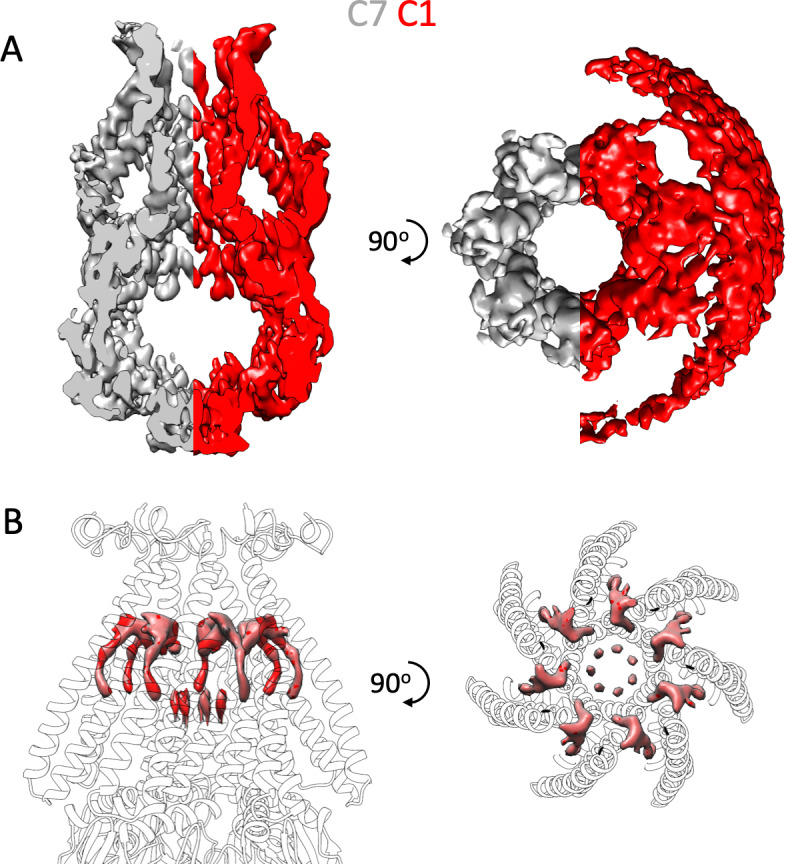
Figure 1u2014figure supplement 3.
Symmetry Free Processing of MscS ND.
The 3D refined model from Figure S2 was processed without symmetry (C1) in Relion. The C1 processed data were aligned with the C7 processed density. Shown is the full model of MscS contorted at the sa...
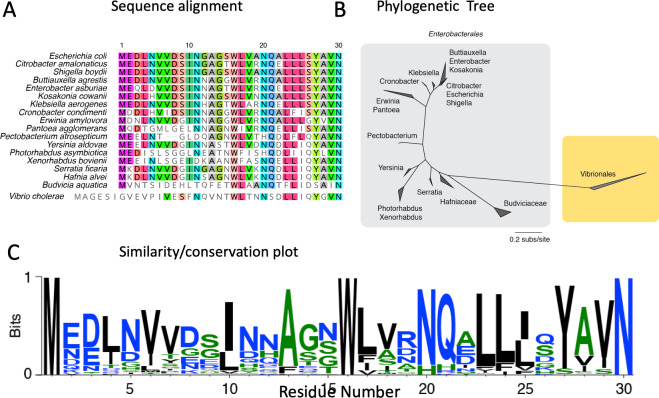
Figure 1u2014figure supplement 4.
Bioinformatics of the MscS N-terminal Anchor Domain.
Sequence from the N-terminus and first three turns of TM1 for MscS orthologs with equivalently predicted TM segments as E. coli . ( A ) Alignment from Enterobacterales and Vibrionales MscS proteins se...
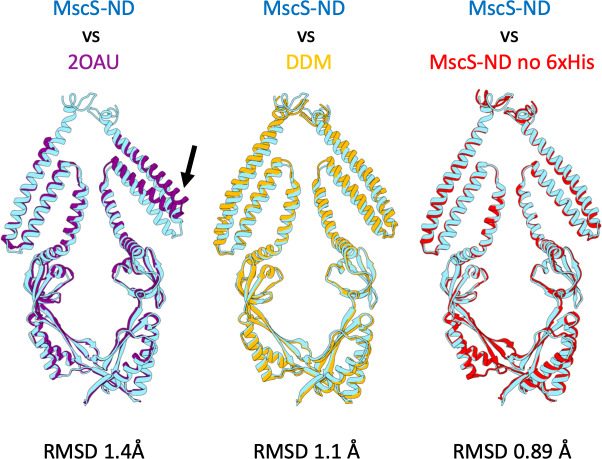
Figure 1u2014figure supplement 5.
MscS-ND vs.other Models.
MscS-ND aligned using backbone atoms. ( A )u00a02OAU is the deposited MscS crystal structure. ( B ) MscS in a DDM micelle. ( C ) MscS-ND with the His-tag cleaved with Thrombin. RMSD was calculated usi...
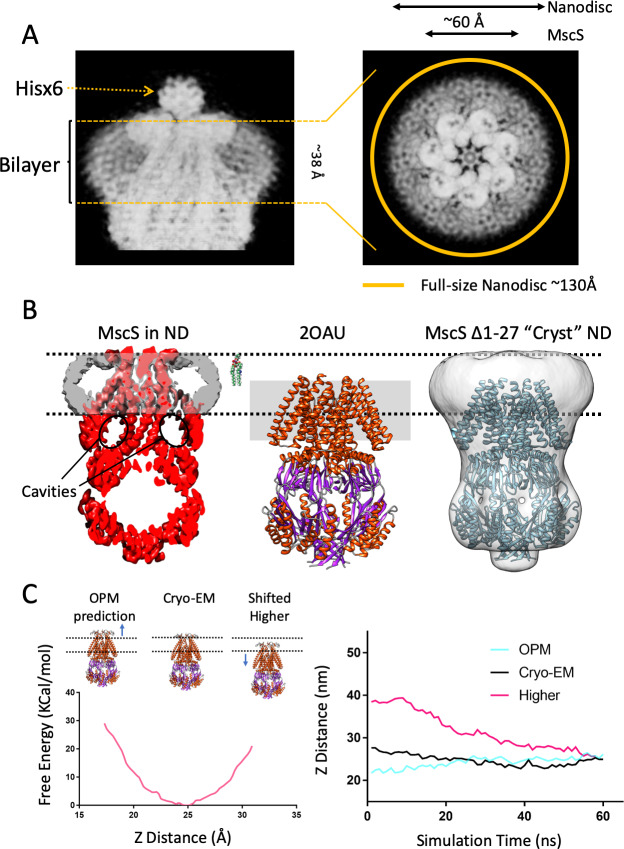
Figure 2.
A new lipid-protein interface for membrane-embedded MscS.
( A ) Close-up of MscS-ND EM density (in Chimerau2019s u2018solidu2019 representation). Left, Side view. The location of the bilayer in the nanodisc in indicated by dashed yellow likes (approximately ...
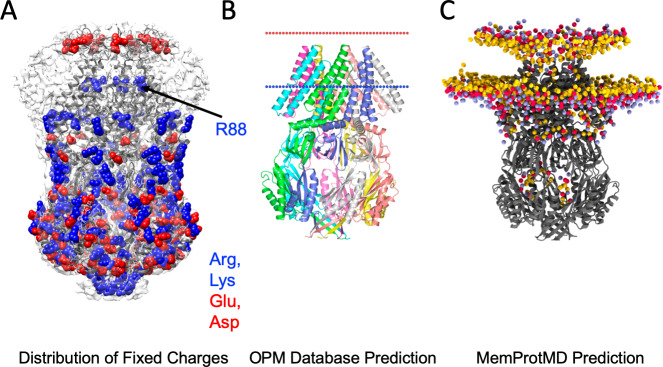
Figure 2u2014figure supplement 1.
MscS bilayer footprint is compatible with bilayer predictions and surface charge distribution.
( A ) A map of all surface-exposed charged residues (in VDW sphere representation) fully agrees with the location of membrane interface based on the MscS-ND EM density. With the exception of Arginine ...
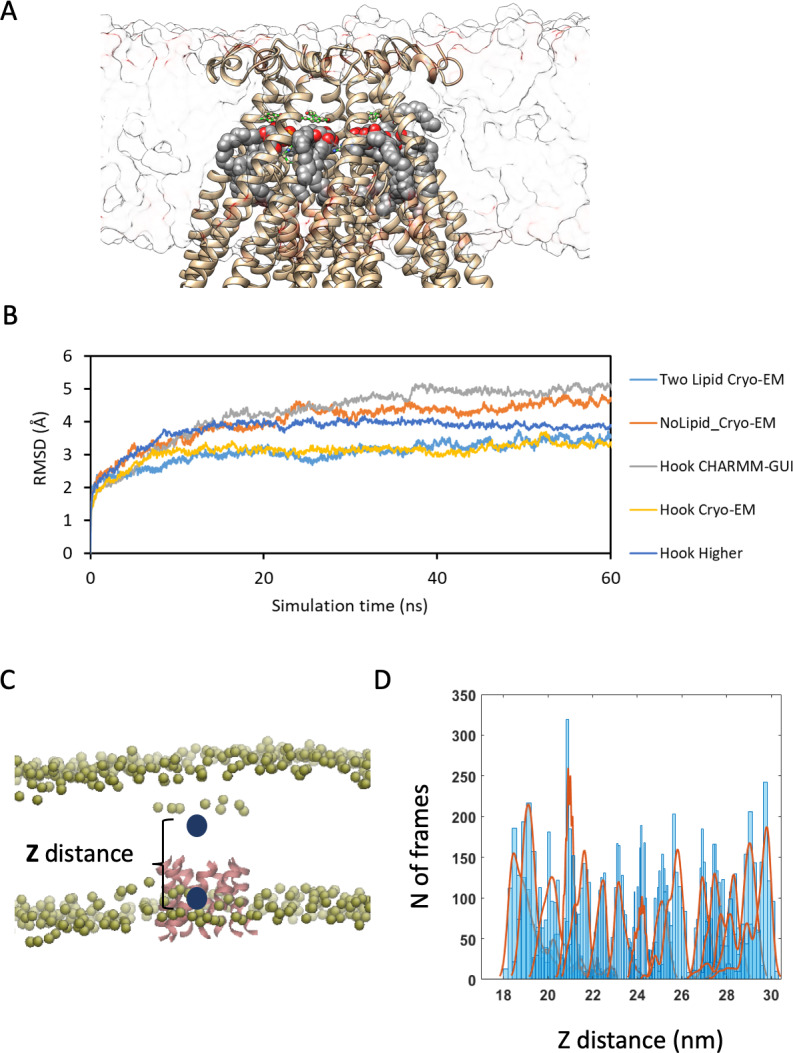
Figure 2u2014figure supplement 2.
Details of MD simulations and PMF calculated from umbrella sampling for determining the optimum position of MscS with respect to the bilayer.
( A ) Example of MscS (MscS Cryo-EM) embedded in a membrane for MD simulation. ( B ) Root mean square deviation (RMSD) of different MD models used in this study. ( C ) The reaction coordinate for the ...
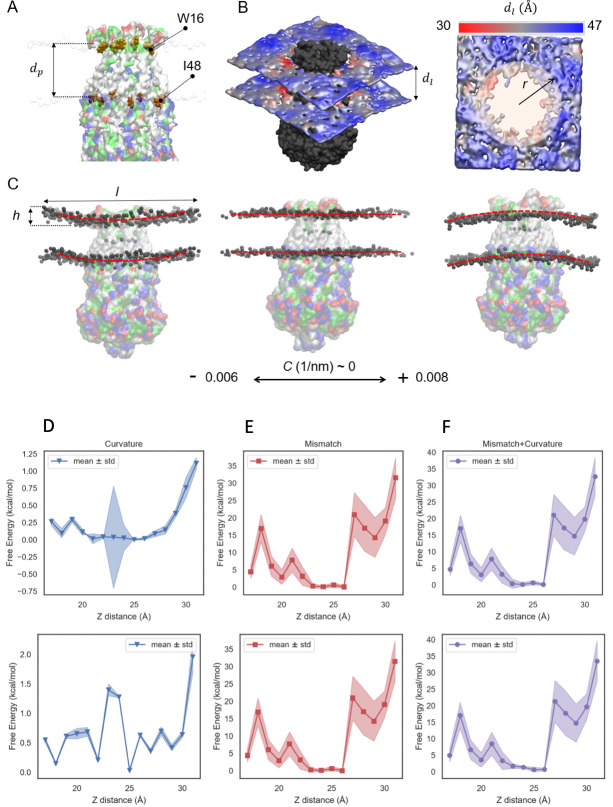
Figure 2u2014figure supplement 3.
Geometrical properties of MscS embedded in a lipid bilayer for PMF calculations.
( A ) Surface representation of MscS with residue-type color map. Red color shows negatively charged residues, blue shows positively charged residues, green hydrophilic and grey hydrophobic residues o...
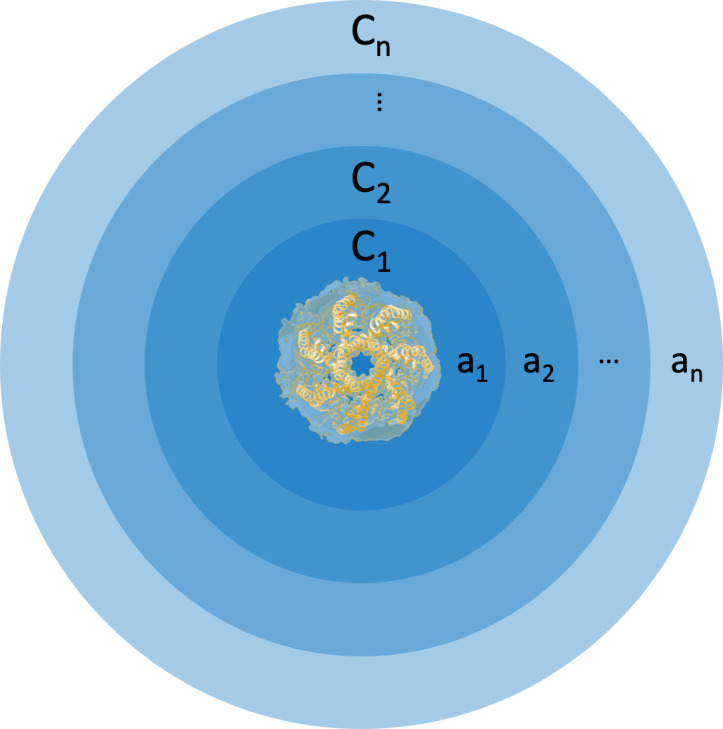
Figure 2u2014figure supplement 4.
Cartoon representation of concentric areas and associated curvatures around membrane-embedded MscS.
The membrane is discretized into concentric ribbons of areas a 1 to a n with curvatures c 1 to c n .
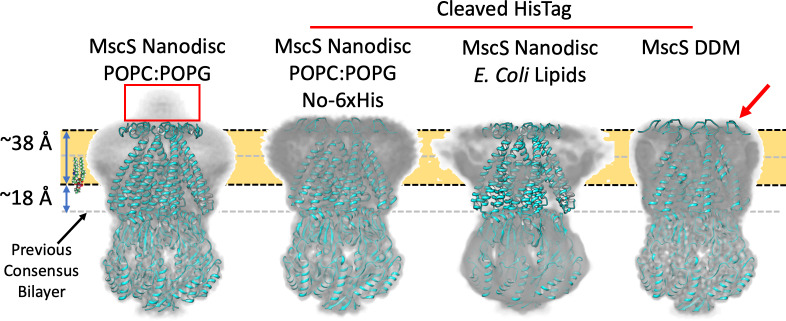
Figure 3.
Membrane interface location in nanodisc-reconstituted MscS is independent of lipid composition.
CryoEM structures for three additional lipid reconstitution/detergent conditions show a common membrane interface. Four independently determined structures are shown: Left, MscS-ND (in POPC:POPG 4:1) ...
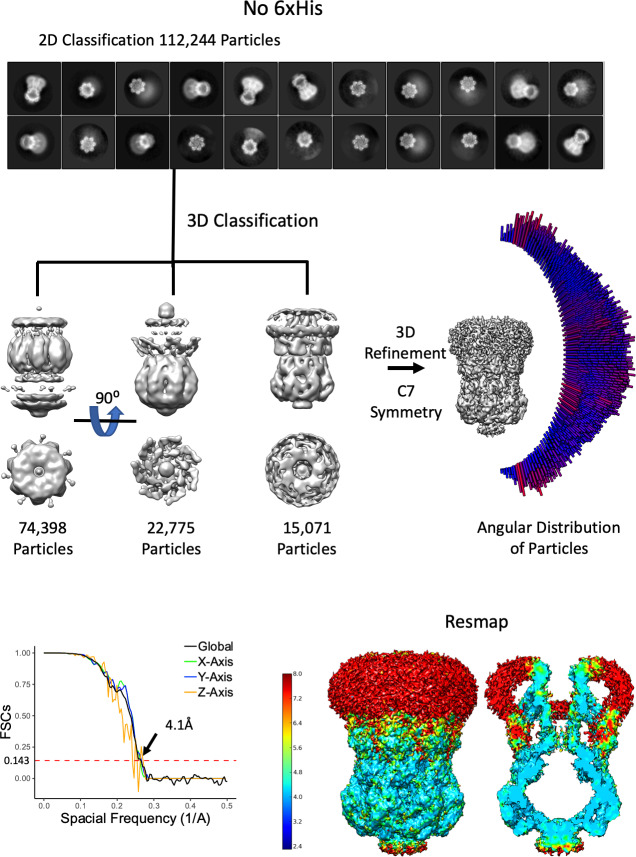
Figure 3u2014figure supplement 1.
Overview of MscS ND No His-Tag Density Refinement Workflow.
From 2110 movies, 111,244 particles were used after 2D classification. The selected 2D classes were subjected to a 3D classification where truncated (possibly denatured due to the air-water interface)...
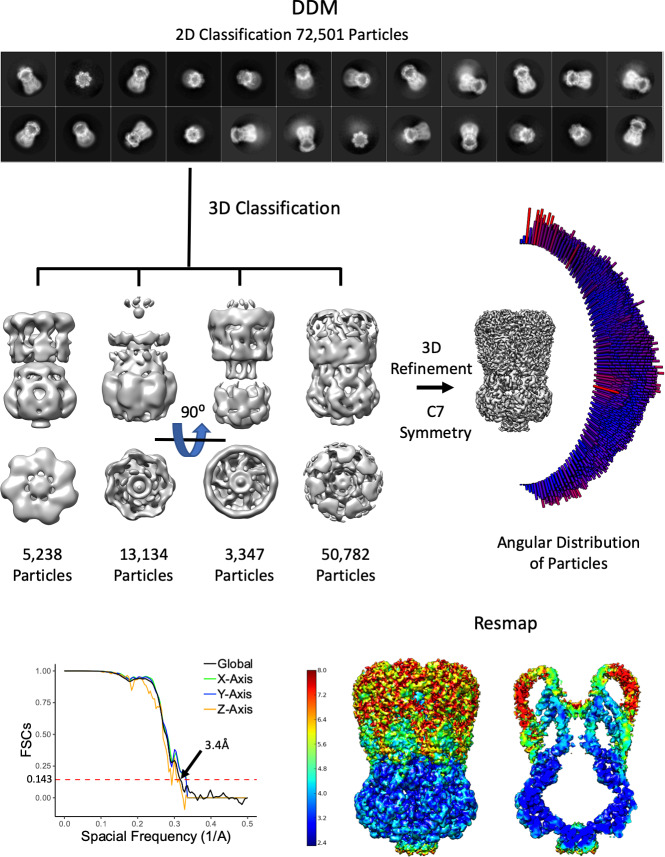
Figure 3u2014figure supplement 2.
Overview of MscS DDM Density Refinement.
From 1328 movies, 72,501 particles were used after 2D classification. The selected 2D classes were subjected to a 3D classification where truncated (possibly denatured due to the air-water interface) ...
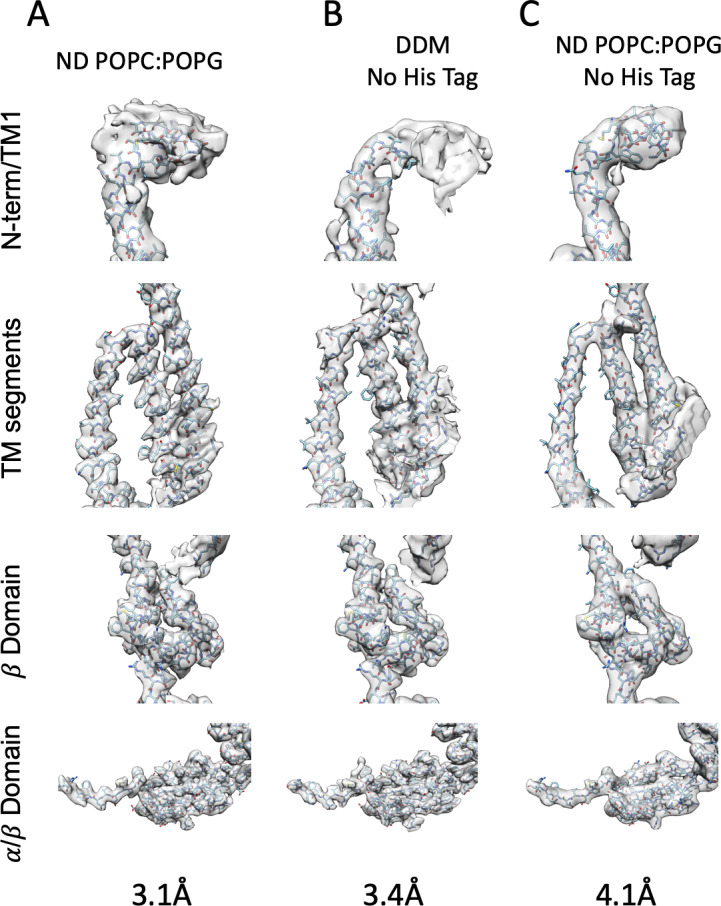
Figure 3u2014figure supplement 3.
Model Fit to Density.
( A ) MscS ND ( B ) DDM ( C ) MscS ND No His-Tag.
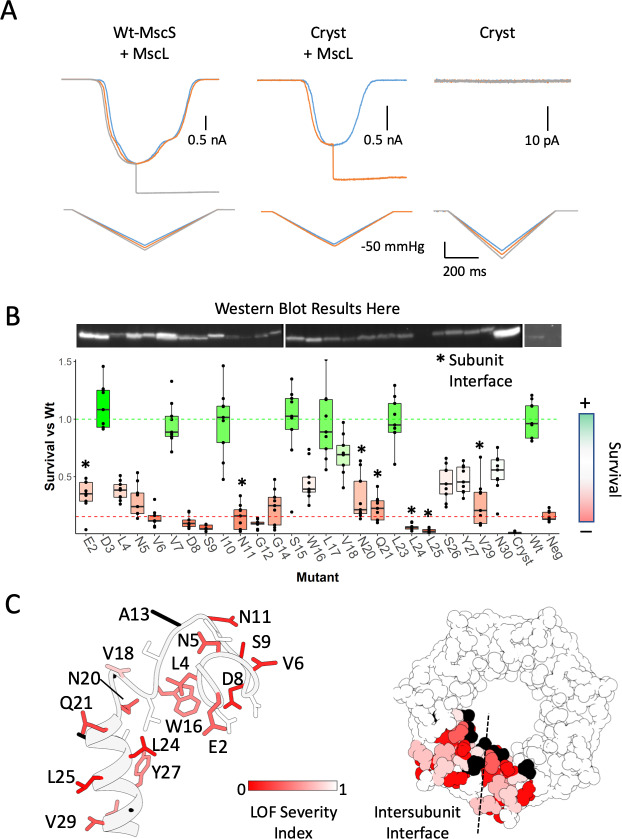
Figure 4.
Functional significance of the anchor domain.
( A ) Functional consequences of deleting the anchor domain (MscS u22061u201327). High-speed pressure clamp recordings of co-expressed MscS and MscL in HEK296 cells under voltage clamp conditions. A f...
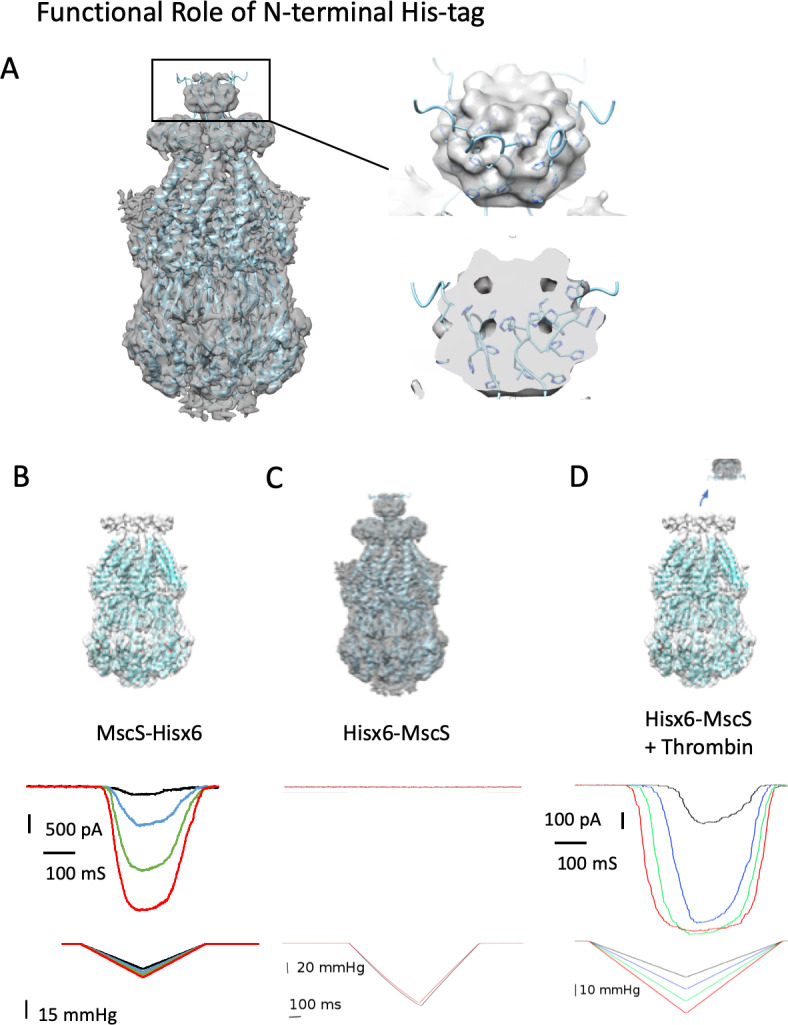
Figure 4u2014figure supplement 1.
Functional consequences of an N-terminal 6xHis-Tag.
( A ) 3D refined model from Figure S2 without masking the His-tag region. Insets show a 45-degree view of the 6xHis tag density (top) and a center section (bottom). The his-tag residues were modeled u...
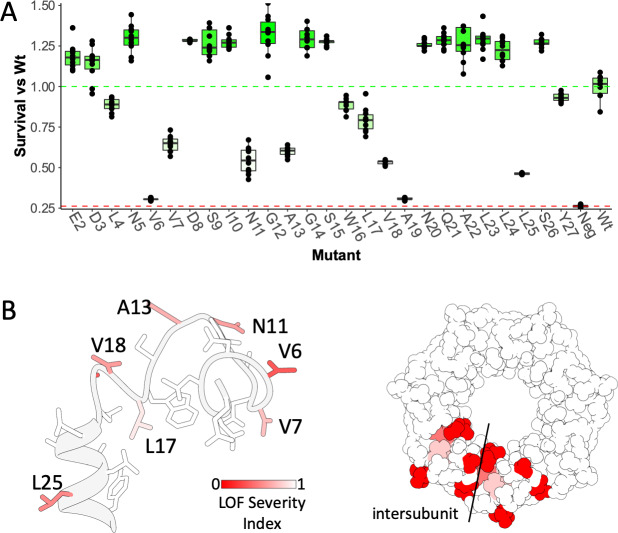
Figure 4u2014figure supplement 2.
Osmotic downshock assays of N-terminal Cystine Scan Mutants.
( A ) Influence of cysteine substitutions in the anchor domain, estimated from downshock assays. Box plots are shown for nine independent experiments, replotted form Vasquez et al. (2008) , where the ...
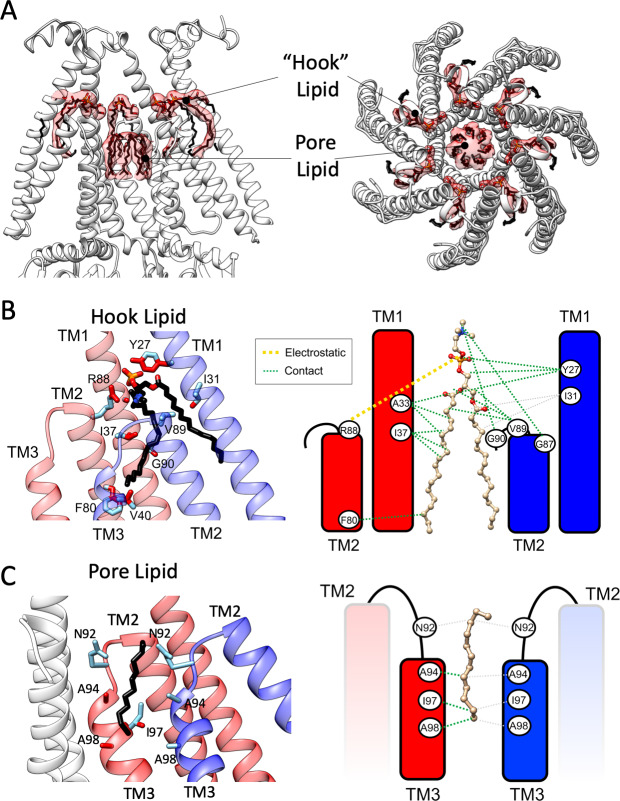
Figure 5.
Bound lipid at the inner gate and the permeation pathway.
( A ) Side (left) and top (right) views of EM density (transparent red surface) associated with putative lipid molecules bound to MscS-ND (shown in white cartoon representation). A u2018hooku2019 phos...
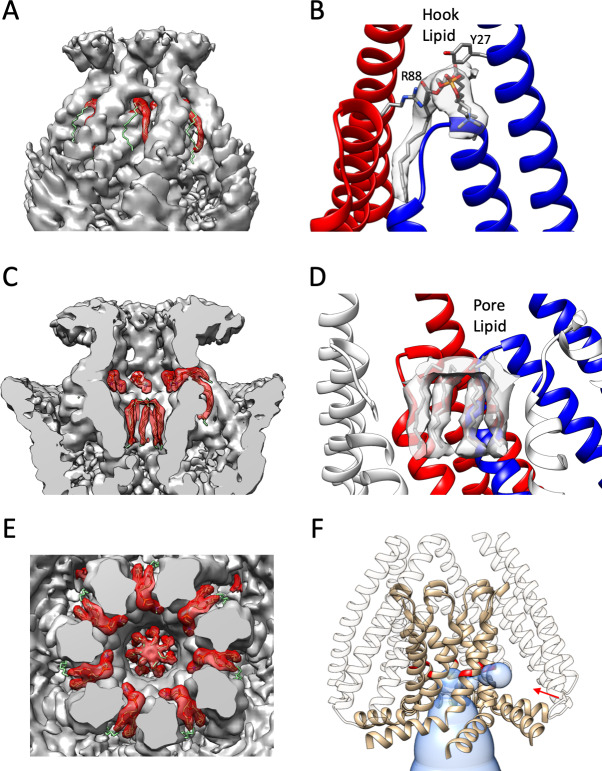
Figure 5u2014figure supplement 1.
Bound Lipids in MscS.
Close up of the hook lipid density fitted to a POPC molecule and pore lipid density fitted as a hexadecane. ( A ), Hook lipid density highlighted in red showing the insertion into a cavity formed by t...
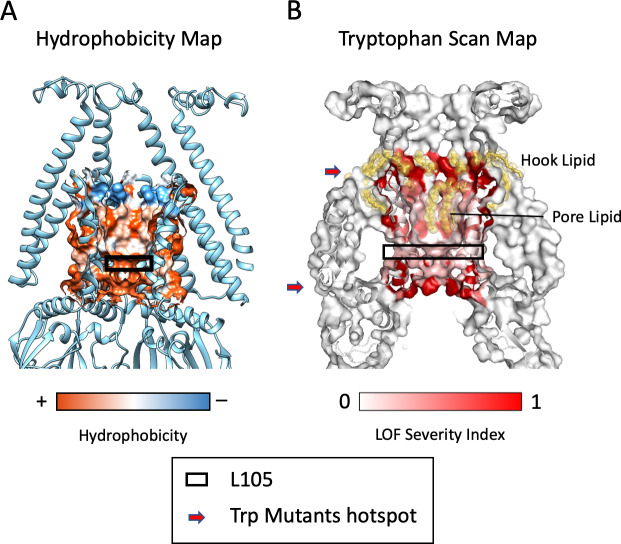
Figure 5u2014figure supplement 2.
Properties of the MscS Permeation Pathway.
( A ) Hydrophobicity map of the residues lining the pore (Chimera, Pettersen et al., 2004 ). Pore lining lipids ( Figure 3C ) are located in the hydrophobic region just above the L105 u2018gateu2019 r...
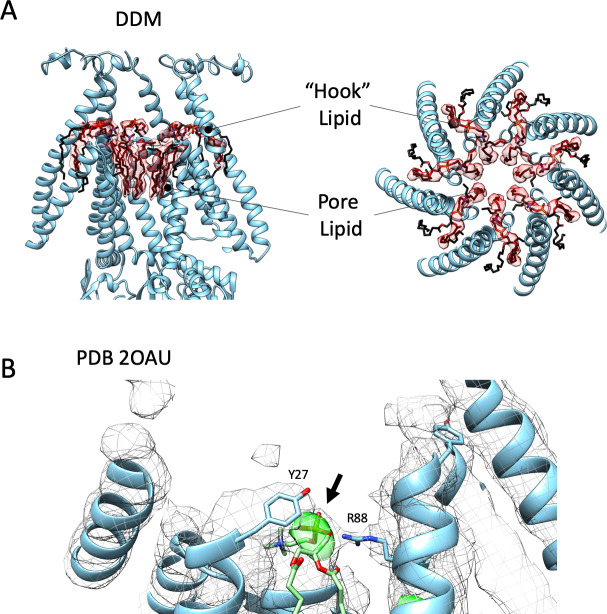
Figure 5u2014figure supplement 3.
Bound Lipids are also found in Detergent-Based Structures.
( A ) Lipid density in MscS DDM cryo-EM structure. Like in Figure 3A , Side (left) and top (right) views of EM density (transparent red surface) associated with the putative lipid molecules bound to M...
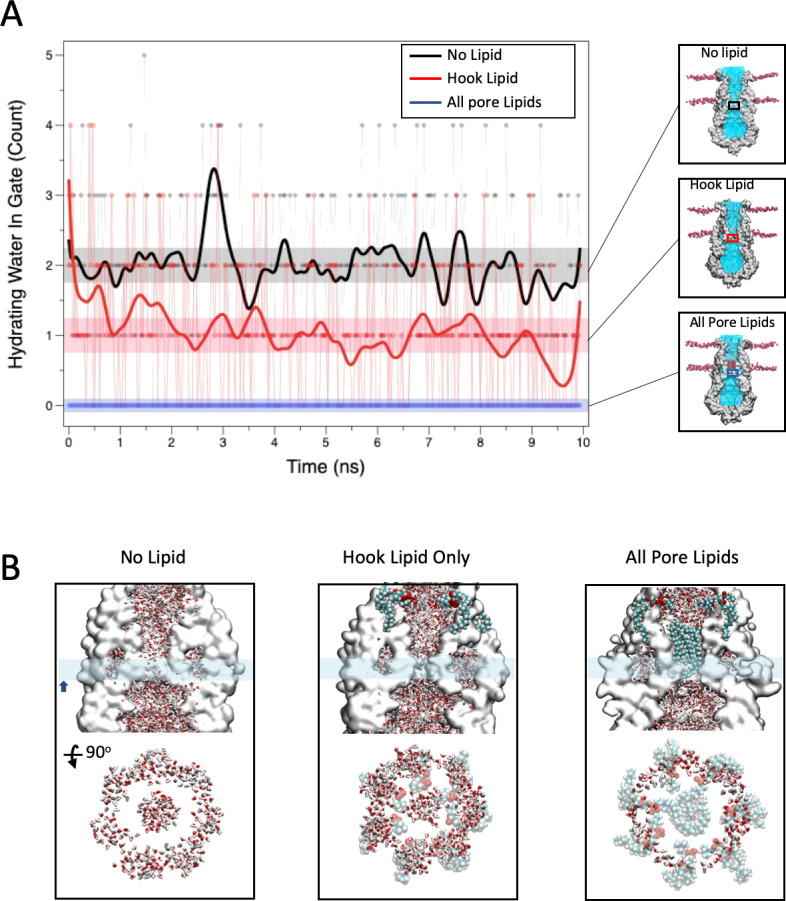
Figure 6.
Role of bound lipids on the permeation pathway.
( A ) MD simulation of water permeation during 10 ns of equilibration under three lipid occupancy conditions: In the absence of bound lipids (black trace), with the hook lipid-bound (red trace) and wi...
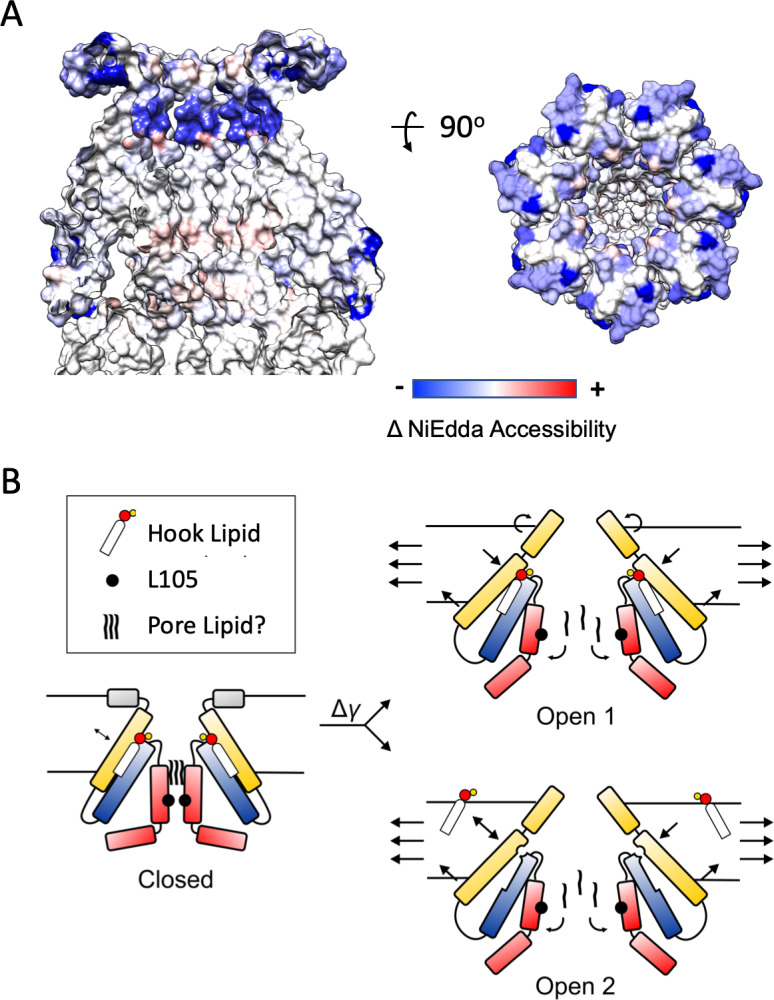
Figure 7.
Mechanisms of Force-from-Lipid gating in MscS.
( A ) Extent and direction of environmental parameter changes upon MscS opening. Left, NiEdda accessibility (u03a0NiEdda) mapped on MscS-ND transmembrane segments. Right, Changes in NiEdda accessibili...
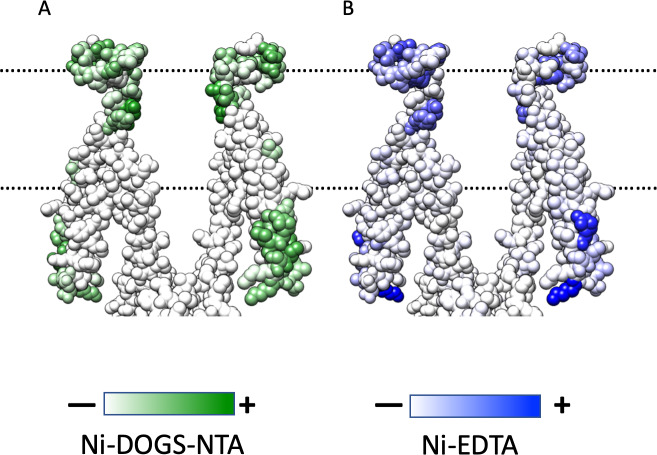
Figure 7u2014figure supplement 1.
Mapping of EPR Data.
( A ) Ni-DOGS-NTA accessibility mapped on MscS-ND transmembrane segments at rest. ( B ) NiEdda accessibility mapped on MscS-ND transmembrane segments. Data from Vasquez et al. (2008) .
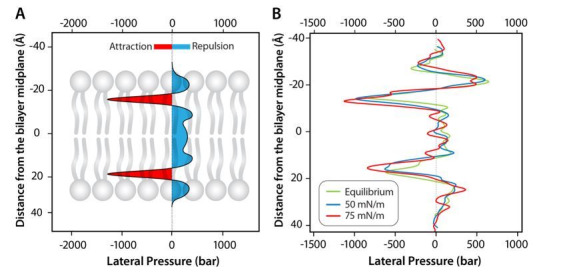
Author response image 1.
Difference between the surface tension and overall membrane tension based on the lateral pressure profile of the bilayer.
( A ) The area shaded with red shows where regarded as u201csurface tensionu201d, and blue the repulsive forces at the tail region of the bilayer and between the headgroups. ( B ) Illustration of how ...
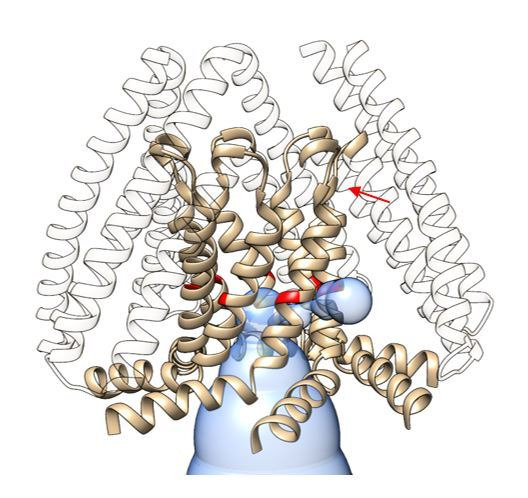
Author response image 2.
Predicted pathway connecting the location of the putative pore lipids in the permeation path with the intracellular TM2/TM3a cavity.
Volume predicted by MOLEonline (https://mole.upol.cz) is depicted as a blue transparent envelope. The tan ribbon corresponds to the TM3 a and TM3b helices, with G104 colored red. An arrow points to th...
Figure images are served from the NIH/NLM PubMed Central Open Access Subset or Europe PMC; copyright remains with the publishers and authors.
💬 Discussion
0 commentsNo comments yet. Be the first to start a discussion!
Leave a Comment