Abstract
Lipid droplets (LDs) are dynamic cellular organelles responsible for the storage of neutral lipids, and are associated with a multitude of metabolic syndromes. Here we report monodansylpentane (MDH) as a high contrast blue-fluorescent marker for LDs. The unique spectral properties make MDH easily combinable with other green and red fluorescent reporters for multicolor fluorescence imaging. MDH staining does not apparently affect LD trafficking, and the dye is extraordinarily photo-stable. Taken together MDH represents a reliable tool to use for the investigation of dynamic LD regulation within living cells using fluorescence microscopy.
🔬 Techniques
🔭 Microscopes
🧬 Organisms
✨ Fluorophores
🧪 Sample Preparation
🔬 Cell Lines
🏭 Microscope Brands
🧪 Reagent Suppliers
🔴 Lasers
📷 Detectors
💻 Software Details
🏛️ Research Organizations (ROR)
Affiliated research institutions:
📋 Methods
Materials Methanol (#1060074000) was obtained from Merck. 2-propanol (#9084-03) was obtained from J.T. Baker. 100% sunflower seed oil was obtained from Quaker (Taiwan). BODIPY 493/503 (#D-3922) was obtained from Invitrogen. The EGFP-tubulin plasmid (#6117-1) was obtained Clonetech. The TagRFP-ADRP plasmid was constructed by inserting the human ADRP gene into the pTagRFP-C vector (#FP-141) from Evrogen. The mEos2-GABARAPL2 plasmid was constructed by combining mEos2 (Addgene, #20341) and the human GABARAPL2 gene in the pEGFP-C1 vector backbone (Clonetech).
Cell culture and transfection HeLa cells
(CCL-2) were acquired from American Type Culture Collection (ATCC, Manassas, VA, USA) and maintained at 37°C, 5 % CO 2 in Dulbecco's Modified Eagle Medium (Gibco, #11965) supplemented with 10% Fetal Bovine Serum (Gibco, #10437) and 1% P/S (Gibco, #15140).
HepG2 cells
(HB-8065) were acquired from American Type Culture Collection (ATCC, Manassas, VA, USA) and cultured in Minimum Essential Medium (MEM) (Gibco, #10370) supplemented with 10% Fetal Bovine Serum (Gibco, #10437) and 1% P/S (Gibco, #15140). HepG2 cells were transfected using the trans IT-LT1 transfection reagent (Mirus, #MIR 2300). 3T3-L1 preadipocytes were maintained at 37°C, 5 % CO 2 in Dulbecco's Modified Eagle Medium (Gibco, #11965) supplemented with 10% Calf Serum (JRH, #12138C) and 1% P/S (Gibco, #15140).
Protocol for MDH staining of LDs in living cells
To stain LDs in live cells with MDH (Abgent, #SM1000a), cells need to be first washed once with PBS, and incubated with 100 µM of MDH-containing PBS (37°C, 15 minutes). Cells should then be washed three times with PBS and transferred into phenol-red free medium for imaging. LDs can then be imaged using 405 nm excitation and 420–480 nm emission.
Show full methods section
Materials Methanol (#1060074000) was obtained from Merck. 2-propanol (#9084-03) was obtained from J.T. Baker. 100% sunflower seed oil was obtained from Quaker (Taiwan). BODIPY 493/503 (#D-3922) was obtained from Invitrogen. The EGFP-tubulin plasmid (#6117-1) was obtained Clonetech. The TagRFP-ADRP plasmid was constructed by inserting the human ADRP gene into the pTagRFP-C vector (#FP-141) from Evrogen. The mEos2-GABARAPL2 plasmid was constructed by combining mEos2 (Addgene, #20341) and the human GABARAPL2 gene in the pEGFP-C1 vector backbone (Clonetech).
Cell culture and transfection HeLa cells
(CCL-2) were acquired from American Type Culture Collection (ATCC, Manassas, VA, USA) and maintained at 37°C, 5 % CO 2 in Dulbecco's Modified Eagle Medium (Gibco, #11965) supplemented with 10% Fetal Bovine Serum (Gibco, #10437) and 1% P/S (Gibco, #15140).
HepG2 cells
(HB-8065) were acquired from American Type Culture Collection (ATCC, Manassas, VA, USA) and cultured in Minimum Essential Medium (MEM) (Gibco, #10370) supplemented with 10% Fetal Bovine Serum (Gibco, #10437) and 1% P/S (Gibco, #15140). HepG2 cells were transfected using the trans IT-LT1 transfection reagent (Mirus, #MIR 2300). 3T3-L1 preadipocytes were maintained at 37°C, 5 % CO 2 in Dulbecco's Modified Eagle Medium (Gibco, #11965) supplemented with 10% Calf Serum (JRH, #12138C) and 1% P/S (Gibco, #15140).
Protocol for MDH staining of LDs in living cells
To stain LDs in live cells with MDH (Abgent, #SM1000a), cells need to be first washed once with PBS, and incubated with 100 µM of MDH-containing PBS (37°C, 15 minutes). Cells should then be washed three times with PBS and transferred into phenol-red free medium for imaging. LDs can then be imaged using 405 nm excitation and 420–480 nm emission.
3T3-L1 Differentiation
In adipocyte differentiation, the preadipocytes were grown to confluency in 10% calf serum/DMEM. Two days (DAY 0) post confluency, the maintaining medium was switched to MDI induction medium (10% FBS/DMEM supplemented with 1.15×10 −4 g/ml IBMX, 1 µg/ml Insulin and 1 µM Dexamethasone). The medium was further changed to insulin medium (10% FBS/DMEM with 1 µg/ml Insulin) on DAY 2, and returned to 10% FBS/DMEM from DAY 4 onwards. Fluorescence Spectroscopy The MDH fluorescent emission spectrum in H 2 O, methanol, isopropanol, and sunflower seed oil were recorded on a Fluoromax-4 spectrofluorometer. MDH was excited with 405 nm, and its fluorescence between 420–670 nm was measured.
Live Cell Imaging
Cells were imaged on an Olympus FV1000 confocal microscope under 5% CO 2 at 37°C. MDH was excited with 405 nm, and its fluorescence between 420–480 nm was collected. BODIPY 493/503 (stained with 1 µg/ml in PBS for 15 min at room temperature; stocked at 1 mg/ml in methanol), was excited with 488 nm, and its fluorescence between 500–550 nm was collected. NileRed (stained with 100 ng/ml in PBS for 15 min at room temperature; stocked at 25 µg/ml in DMSO), was excited with 488 nm, and its fluorescence between 530–600 nm was collected. EGFP and mEos2 fluorescence were collected using 488 nm excitation (collecting 500–550 nm emission), and TagRFP fluorescence was obtained using 559 nm excitation (collecting 570–670 nm emission).
Two-photon Fluorescence Imaging
Cells were imaged on a Zeiss LSM 510 confocal microscope under 5% CO 2 at 37°C. Images were collected using a 40×1.2 W Zeiss C-Apochromat objective. MDH was excited with 760 nm light (Coherent Chameleon), and its fluorescence between 435–485 nm was collected. Tracking LDs HeLa cells stained with MDH or BODIPY 493/503 were imaged at 2-second time intervals for a total of 40 seconds, and the movements of LDs were tracked using the ImageJ particle tracker plugin. LDs trajectories that displayed continuous active transport throughout the entire movie were collected and analyzed.
Materials Methanol (#1060074000) was obtained from Merck. 2-propanol (#9084-03) was obtained from J.T. Baker. 100% sunflower seed oil was obtained from Quaker (Taiwan). BODIPY 493/503 (#D-3922) was obtained from Invitrogen. The EGFP-tubulin plasmid (#6117-1) was obtained Clonetech. The TagRFP-ADRP plasmid was constructed by inserting the human ADRP gene into the pTagRFP-C vector (#FP-141) from Evrogen. The mEos2-GABARAPL2 plasmid was constructed by combining mEos2 (Addgene, #20341) and the human GABARAPL2 gene in the pEGFP-C1 vector backbone (Clonetech).
Protocol for MDH staining of LDs in living cells
To stain LDs in live cells with MDH (Abgent, #SM1000a), cells need to be first washed once with PBS, and incubated with 100 µM of MDH-containing PBS (37°C, 15 minutes). Cells should then be washed three times with PBS and transferred into phenol-red free medium for imaging. LDs can then be imaged using 405 nm excitation and 420–480 nm emission.
Supporting Information Figure S1 Lack of colocalization between EGFP-LC3 and MDH-stained puncta in starved (EBSS, 1 hour) HeLa cells. Scale bar, 10 µm. (TIF) Click here for additional data file. Figure S2 Translocation of Tip47 onto MDH puncta upon oleic acid supplementation. In HepG2 cells, EGFP-TIP47 resided in the cytosol when cultured in MEM+10% FBS ( A ), but translocated onto MDH stained puncta upon eight hours of oleic acid supplementation (0.4 mM oleic acid complexed with 0.25 mM BSA in MEM/FBS, B ). Scale bars, 10 µm. (TIF) Click here for additional data file. Figure S3 Image quality adjustment for LD dye comparison. Using the same detector (PMT) and scan settings, we varied the respective laser excitation powers to achieve similar image quality for MDH-, BODIPY 493/503-, and NileRed-stained LD images in differentiated 3T3-L1 cells (8 days) for performance comparison. For example, MDH stained 3T3-L1 cells were imaged at various excitation powers (in this figure 1 × represents the final excitation power we chose for MDH imaging; 0.5× = 50% of the laser intensity used in our performance test; 2× = 200% of the laser intensity used in the performance test), and the emission intensity profile for large (>5 µm), immobile LDs were analyzed ( right , cross-section of the white bar indicated in the 0.5× image). The excitation powers that produced an S/N = 5 on these large LDs for the respective dyes were selected as the laser intensity to use for further performance evaluation. (TIF) Click here for additional data file. Movie S1 2-color live-cell imaging with MDH in HepG2 cells. HepG2 cells transfected with EGFP-tubulin (shown in green) were stained with MDH (shown in cyan) and imaged every 30 seconds for 15 frames. (AVI) Click here for additional data file. Movie S2 LD active transport in HeLa cells. HeLa cells was imaged every 0.14 seconds for 20 frames and analyzed for LD trajectories (corresponding movie file for figure 5 ). (AVI) Click here for additional data file.
📊 Figures
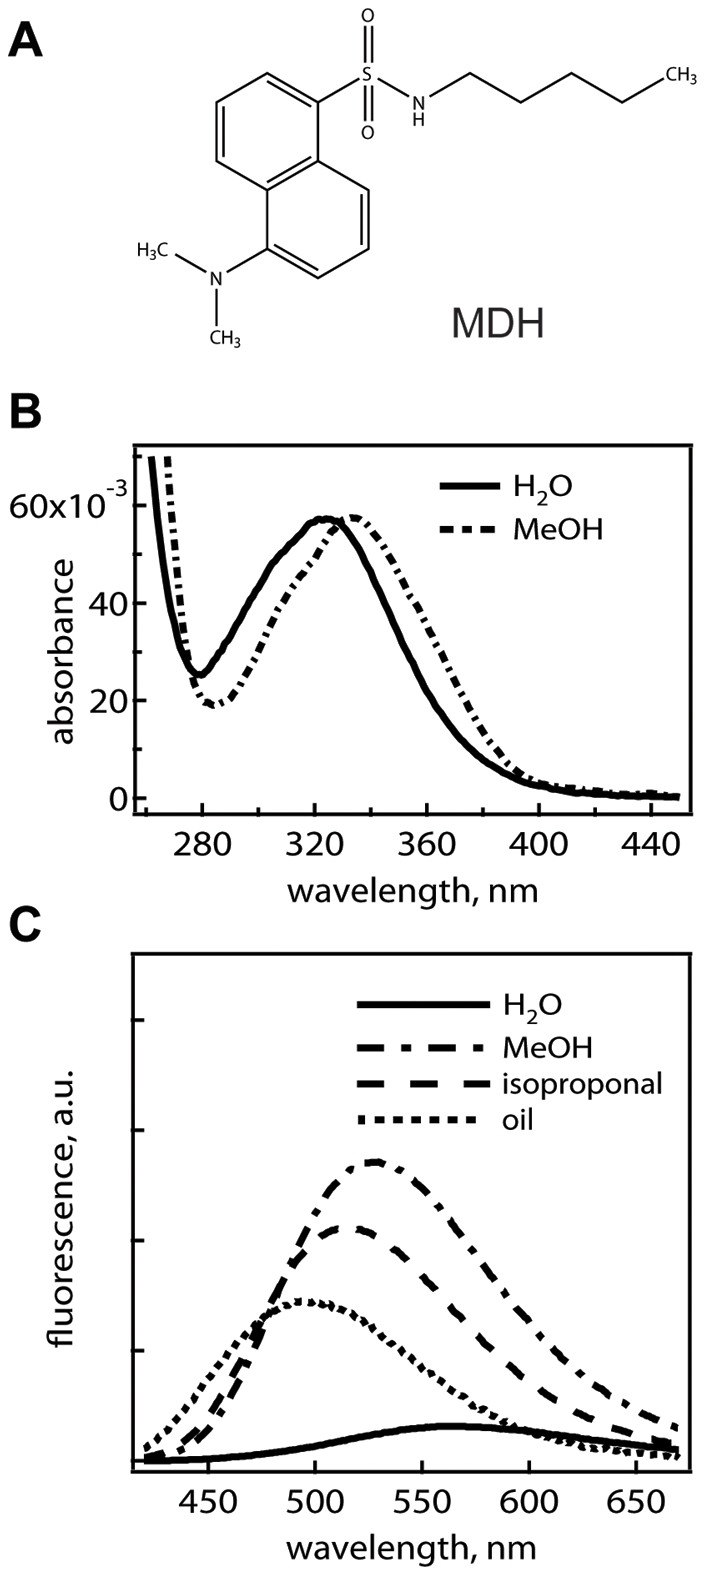
Figure 1
The Solvatochromatic properties of MDH.
(A) MDH contains a fluorescent dansyl moiety that displays strong solvatochromatic properties. (B) MDH absorption spectrum in water and methanol. (C) MDH emission in different solvents (H 2 O/methanol...
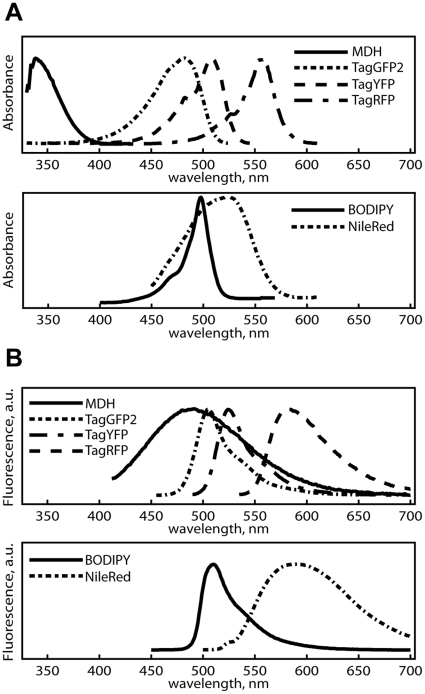
Figure 2
A comparison between the spectral properties of commercially available LD dyes and fluorescent proteins.
The absorbance (A) and emission spectra (B) of LD dyes in sunflower seed oil, overlaid with fluorescent proteins' respective curves in water (the TagGFP2, TagYFP, and TagRFP spectra were obtained from...
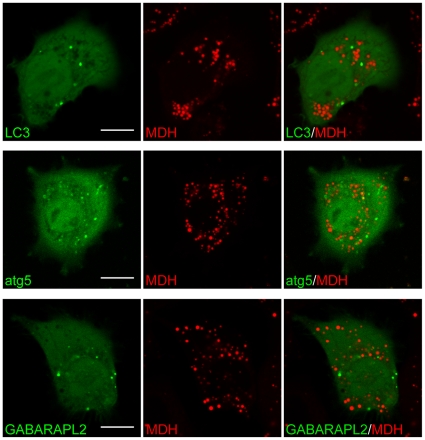
Figure 3
MDH staining patterns are separated from known molecular markers for autophagic structures.
HepG2 cells transiently transfected with either EGFP-LC3B ( top row ), mcherry-atg5 ( middle row ), or mEos2-GABARAPL2 ( bottom row ) were stained with MDH and imaged. Under normal (not shown) and sta...
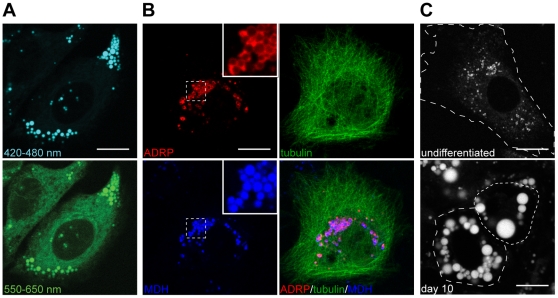
Figure 4
MDH stains LDs.
(A) MDH staining patterns in HepG2 cells mimicked cytosolic LDs. Fluorescence emission between 420u2013480 nm resulted in a high contrast, low background staining of round spots in HepG2 ( top ; 405 n...
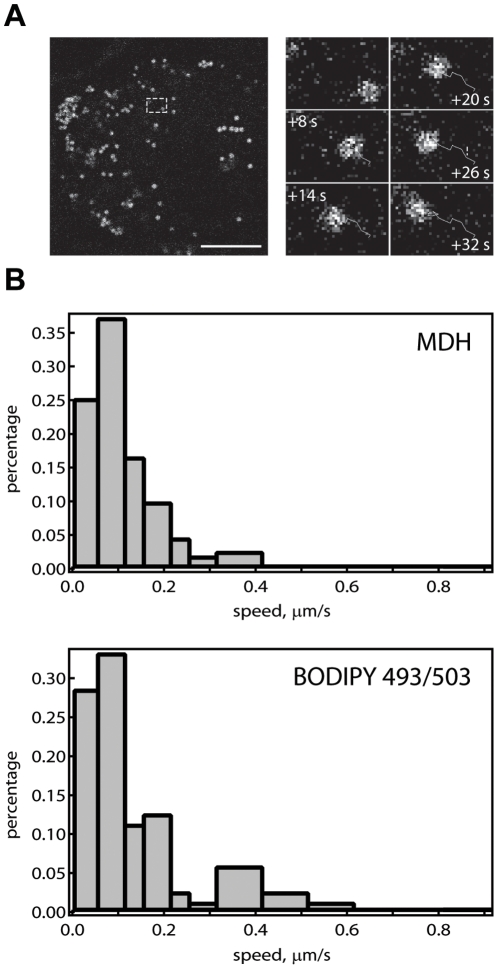
Figure 5
LD trafficking monitored in living cells using MDH.
HeLa cells stained with MDH (A, left ) were imaged every 2 seconds for 20 frames. Single LD trajectories (A, right , showing the movement of the LD in the white dotted rectangle) were then individuall...
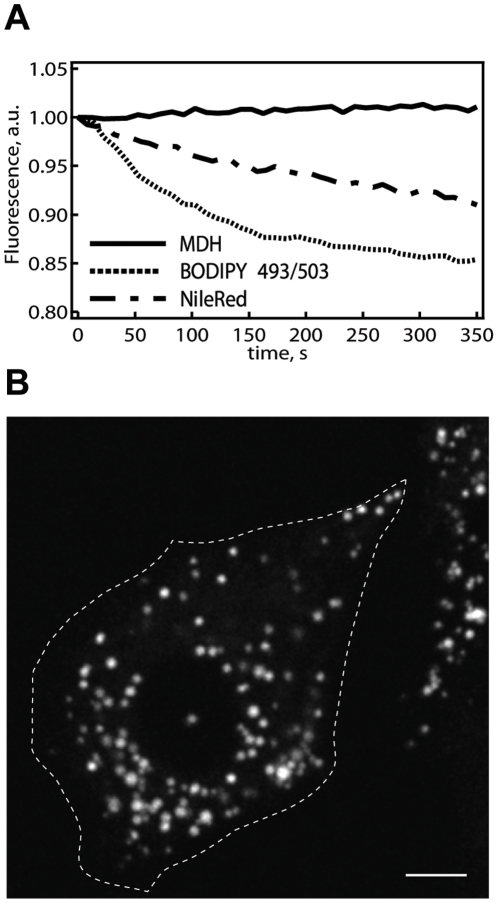
Figure 6
Superior MDH properties for live cell imaging.
(A) The performance of MDH for long-term imaging was benchmarked against that of NileRed and BODIPY 493/503 directly in living cells. We tracked the fluorescence from MDH, NileRed, or BODIPY 493/503 s...
Figure images are served from the NIH/NLM PubMed Central Open Access Subset or Europe PMC; copyright remains with the publishers and authors.
💬 Discussion
0 commentsNo comments yet. Be the first to start a discussion!
Leave a Comment