Abstract
Electron tomography provides three-dimensional structural information about supramolecular assemblies and organelles in a cellular context, but image degradation, caused by scattering of transmitted electrons, limits applicability in specimens thicker than 300 nm. We found that scanning transmission electron tomography of 1,000-nm-thick samples using axial detection provided resolution comparable to that of conventional electron tomography. We demonstrated the method by reconstructing a human erythrocyte infected with the malaria parasite Plasmodium falciparum.
🔬 Techniques
🔭 Microscopes
🧬 Organisms
💻 Software
🧪 Sample Preparation
🏭 Microscope Brands
📷 Detectors
💻 Software Details
🏛️ Research Organizations (ROR)
Affiliated research institutions:
📋 Methods
Specimen preparation
We grew Chlamydomonas reinhartii under 70 μmol photons/(m 2 · s) incandescent illumination at 23 °C on inorganic growth medium (Carolina Scientific, USA). Cells in logarithmic growth phase were harvested by centrifugation. We cultured Plasmodium falciparum strain 3D7 (American Type Culture Collection, USA) in human erythrocyte and isolated late-stage infected cells from synchronized cultures using a Percoll-enrichment procedure as described before 16 . C. reinhardtii and P. falciparum -infected erythrocytes that had been briefly pre-fixed with 0.16% paraformaldehyde for biosafety were frozen using a HPM-010 high-pressure freezing machine (Bal-Tec, Liechtenstein). Although some nanoscale alteration in structure possibly occurs during pre-fixation, other structural changes due to dehydration are minimized by subsequent cryofixation. We freeze-substituted frozen cells in 1% osmium tetroxide for 48–72 hours before warming up to room temperature over the course of 48 hours. Upon reaching room temperature we infiltrated the samples with Spurr's resin using a decreasing acetone-resin gradient (10%, 20%, 40%, 80%, 100% resin) followed by a second 100% resin infiltration step and subsequent polymerization at 65 °C. We sectioned the plastic-embedded samples to a nominal thickness of 1 μm using a Leica Ultracut E ultramicrotome (Leica Microsystems, Germany), and picked up serial thick sections with a loop. The loop containing the sections was then used to pick up a copper slot grid of 1 mm slot width, such that the sections were oriented side by side along the length of the hole in the slot grid ( Supplementary Fig. 9 ). We left the loop with the slot grid plus sections under the warm light of a dissecting microscope until the water evaporated. We then affixed the serial sections to the copper slot grid by gently touching the edges of each section with a pipette tip that contained acrylate glue. This procedure generated very stable samples that easily withstood further handling for staining and application of fiducial gold markers. Next, we stained sections containing infected erythrocytes with 0.5 wt% uranyl acetate and 0.5 wt% lead citrate (SPI Supplies, USA) in water for 15–20 minutes each. Finally, we applied gold fiducial markers of 20 nm in diameter (SPI Supplies) to both sides of all plastic sections, followed by deposition of a 10 nm-thick layer of amorphous carbon.
Show full methods section
Specimen preparation
We grew Chlamydomonas reinhartii under 70 μmol photons/(m 2 · s) incandescent illumination at 23 °C on inorganic growth medium (Carolina Scientific, USA). Cells in logarithmic growth phase were harvested by centrifugation. We cultured Plasmodium falciparum strain 3D7 (American Type Culture Collection, USA) in human erythrocyte and isolated late-stage infected cells from synchronized cultures using a Percoll-enrichment procedure as described before 16 . C. reinhardtii and P. falciparum -infected erythrocytes that had been briefly pre-fixed with 0.16% paraformaldehyde for biosafety were frozen using a HPM-010 high-pressure freezing machine (Bal-Tec, Liechtenstein). Although some nanoscale alteration in structure possibly occurs during pre-fixation, other structural changes due to dehydration are minimized by subsequent cryofixation. We freeze-substituted frozen cells in 1% osmium tetroxide for 48–72 hours before warming up to room temperature over the course of 48 hours. Upon reaching room temperature we infiltrated the samples with Spurr's resin using a decreasing acetone-resin gradient (10%, 20%, 40%, 80%, 100% resin) followed by a second 100% resin infiltration step and subsequent polymerization at 65 °C. We sectioned the plastic-embedded samples to a nominal thickness of 1 μm using a Leica Ultracut E ultramicrotome (Leica Microsystems, Germany), and picked up serial thick sections with a loop. The loop containing the sections was then used to pick up a copper slot grid of 1 mm slot width, such that the sections were oriented side by side along the length of the hole in the slot grid ( Supplementary Fig. 9 ). We left the loop with the slot grid plus sections under the warm light of a dissecting microscope until the water evaporated. We then affixed the serial sections to the copper slot grid by gently touching the edges of each section with a pipette tip that contained acrylate glue. This procedure generated very stable samples that easily withstood further handling for staining and application of fiducial gold markers. Next, we stained sections containing infected erythrocytes with 0.5 wt% uranyl acetate and 0.5 wt% lead citrate (SPI Supplies, USA) in water for 15–20 minutes each. Finally, we applied gold fiducial markers of 20 nm in diameter (SPI Supplies) to both sides of all plastic sections, followed by deposition of a 10 nm-thick layer of amorphous carbon.
Electron microscopy instrumentation
For electron microscopy we used a Tecnai TF30 transmission electron microscope (FEI Company, USA) operating at an acceleration voltage of 300 kV and equipped with a Schottky field-emission gun. This microscope is fitted with a Gatan STEM bright-field detector (Gatan, USA) situated after the viewing screen, as well as with a Model 3000 in-column high angle annular dark-field detector (Fischione, USA) situated after the projection-lens system and above the viewing screen. In addition, this instrument is equipped with a Tridiem post-column imaging filter (Gatan) and a 2048 × 2048 pixel Ultrascan CCD detector (Gatan) situated after the post-column filter.
Image acquisition
We recorded unfiltered transmission electron microscopy (TEM) images ( Fig. 1d ; Supplementary Fig. 5c ) and most probable energy-loss (MPEL) TEM images ( Fig. 1e,f ; Supplementary Fig. 2a ; Supplementary Fig. 5d,e ) using DigitalMicrograph (Gatan) with 2048 × 2048 pixels, 32-bit grayscale, and pixel size of 2.4 nm. For MPEL TEM imaging we used an energy window of 30 eV centered at the maximum in the energy-loss spectrum ( Supplementary Fig. 1 ). Because the imaged sections were thick, and because of beam spreading, there was no single defocus that would be optimum along the entire specimen thickness 17 . We thus selected a value of defocus near the z-center of the section that led to the best overall image quality. Images were slightly adjusted for brightness and contrast. We recorded scanning transmission electron microscopy (STEM) images ( Fig. 1b,c ; Fig. 2a ; Supplementary Fig. 2b ; Supplementary Fig. 5a,b,f ; Supplementary Fig. 7a ) using the Tecnai Imaging and Analysis (TIA) software (FEI Company) with 2048 × 2048 pixels, 16-bit grayscale, and pixel size of 2.8 nm. We adjusted images slightly for brightness and contrast. The incident electron probe had a convergence semi-angle of 1.6 mrad, which was obtained by inserting the smallest probe-forming condenser aperture in the microscope in addition to interactively adjusting the second condenser and objective lens currents 10 , 18 . Bright-field (BF) STEM imaging was performed with a 15 mrad detector outer semi-angle, and high angle annular dark-field (HAADF) STEM was carried out with an inner semi-angle of 40 mrad (outer semi-angle was around 200 mrad). We achieved control over these collection angles by varying the magnification of the diffraction pattern (camera length). For acquisition of the series of images displayed in Figure 1 and Supplementary Figure 5 , the plastic sections were first pre-irradiated and stabilized under the electron beam. We recorded images following the same order as shown in the figures, namely, BF STEM and HAADF STEM (recorded simultaneously), unfiltered TEM, MPEL TEM (low dose) and MPEL TEM (high dose). The electron doses were 10 3 e/nm 2 , except for the second MPEL TEM image for which the dose was 10 4 e/nm 2 . To confirm that the sections had been properly stabilized prior to collecting the series of images, a final BF STEM image was recorded and checked against the first image ( Supplementary Fig. 5f ).
STEM tomography
To perform STEM tomography, we employed automatic sample tilting, focusing and image shift correction using Xplore3D (FEI Company). Beam convergence semi-angle and detector collection semi-angles were as stated above. We obtained tomographic image tilt series of both C. reinhardtii and P. falciparum at two different magnifications with pixel sizes of 2.8 nm and 1 nm, and corresponding total electron doses of 2.0 × 10 4 and 1.6 × 10 5 e/nm 2 , respectively. Images contained 2048 × 2048 pixels providing scanned specimen areas of 5.7 × 5.7 μm 2 and 2 × 2 μm 2 . The STEM tomograms were calculated from single-axis tilt series ranging from −60° to 60° with increments of 1.5°. Where BF and HAADF STEM reconstructions are presented from the same specimen region ( Supplementary Fig. 6 ), we acquired BF and HAADF STEM tilt series simultaneously allowing for an unambiguous comparison between the tomograms obtained with each technique. 3D reconstructions 19 , 20 were computed from the tilt series using a weighted back-projection algorithm in the IMOD software package (University of Colorado, USA) 21 . The tomograms were generated after binning images by 2 and post-processed with a 3D median filter of size 2. We created 3D models in Amira (Visage Imaging, Germany) by guided segmentation.
Supplementary Material 1
📊 Figures
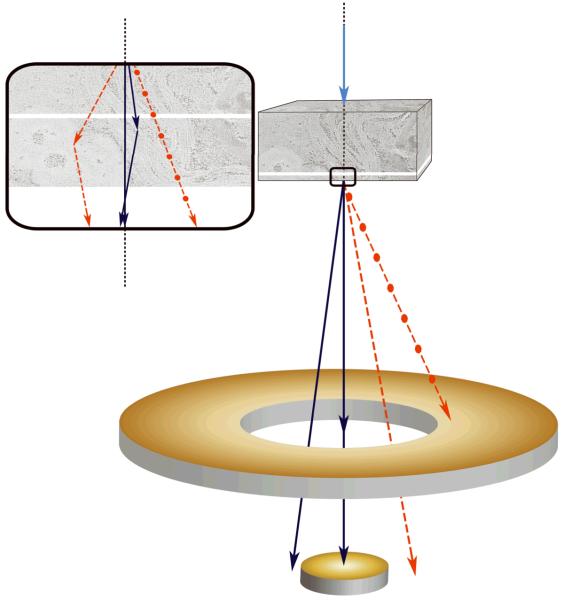
Figure 1
Scanning transmission electron microscopy using axial detection. ( a ) Schematic diagram depicting the influence of STEM detector configuration on the spatial resolution of specimen features situated ...
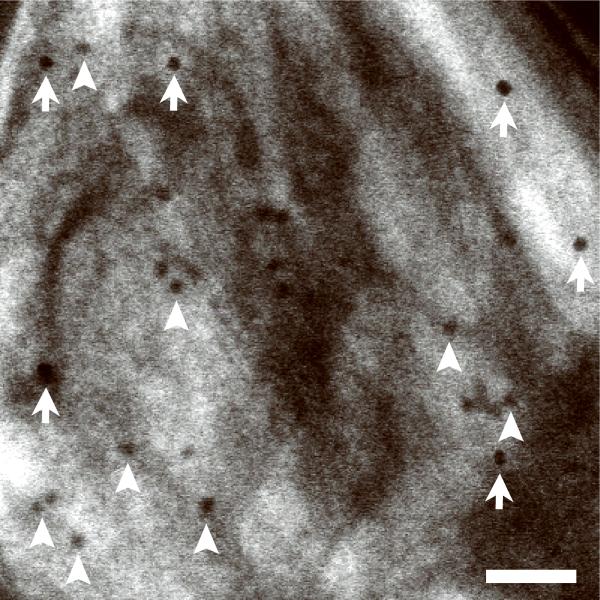
Figure 2
Bright-field STEM tomography of 1 u03bcm-thick C. reinhardtii . ( a ) 2D projection image of entire C. reinhardtii in the xy plane. ( b ) 25-nm thick slices across the xy (top panel) and xz (bottom pa...
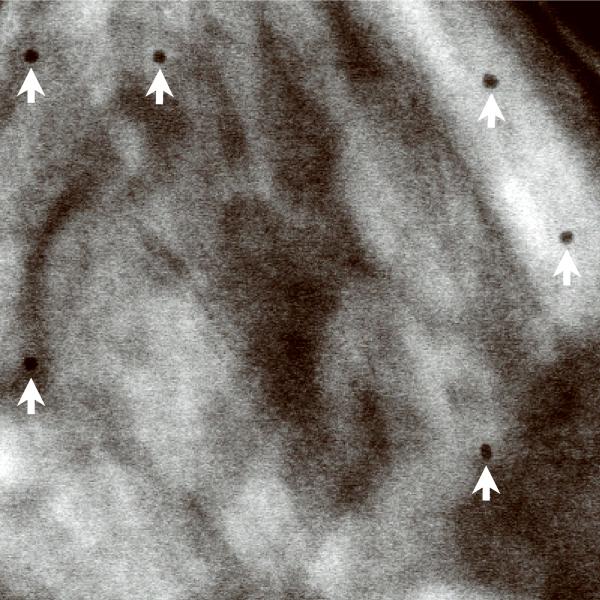
Figure 3
3D ultrastructure of human erythrocyte infected with malaria parasite P. falciparum . ( a ) 20-nm thick slice across BF STEM tomogram obtained from a 1 u03bcm-thick section (see also Supplementary Fig...
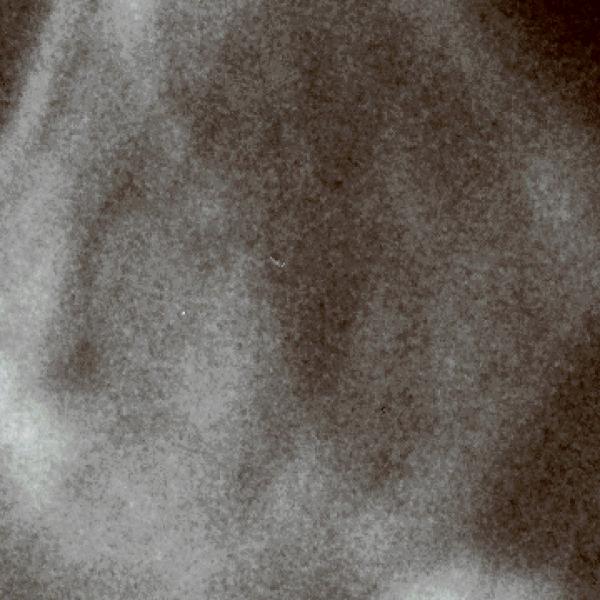
Figure 4
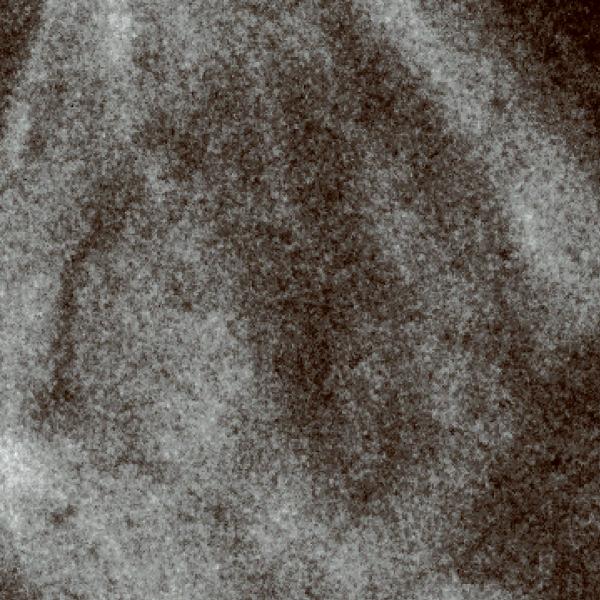
Figure 5
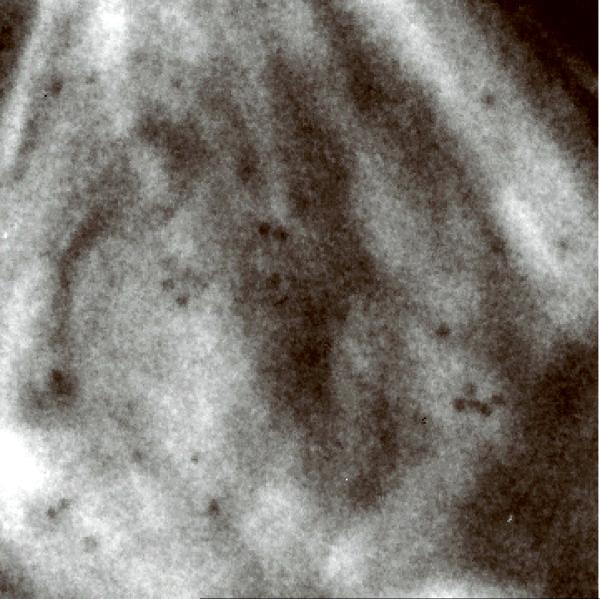
Figure 6
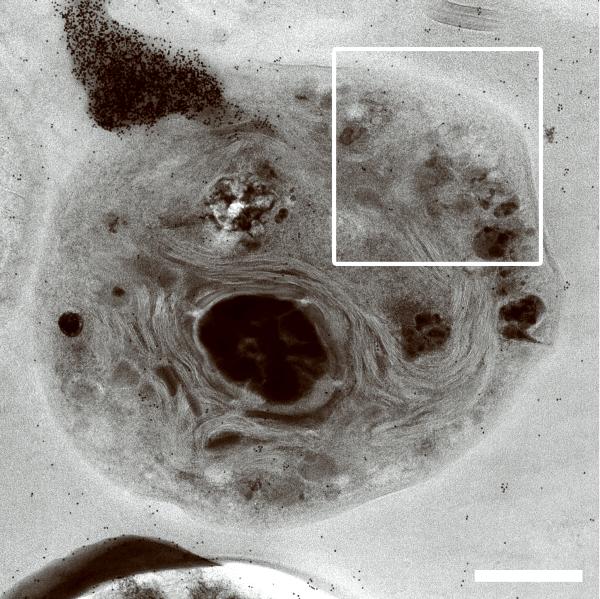
Figure 7
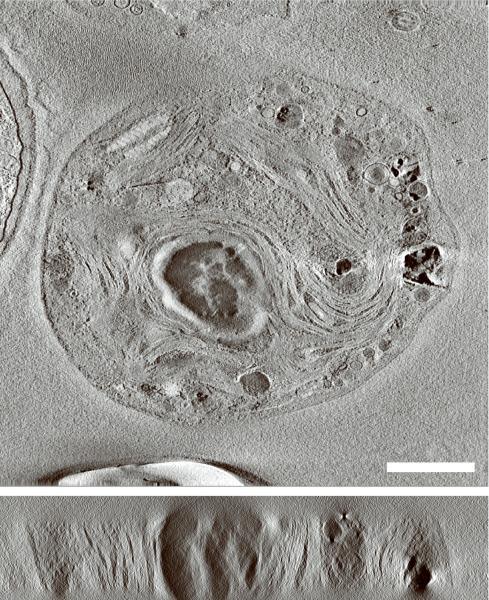
Figure 8
Figure 9
Figure 10
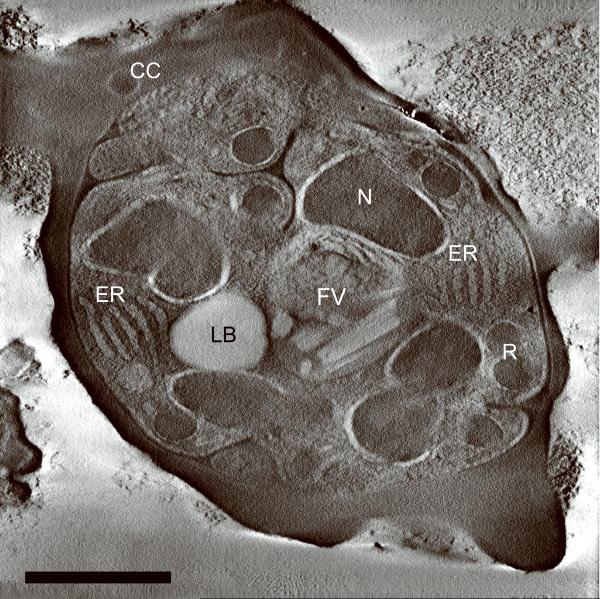
Figure 11
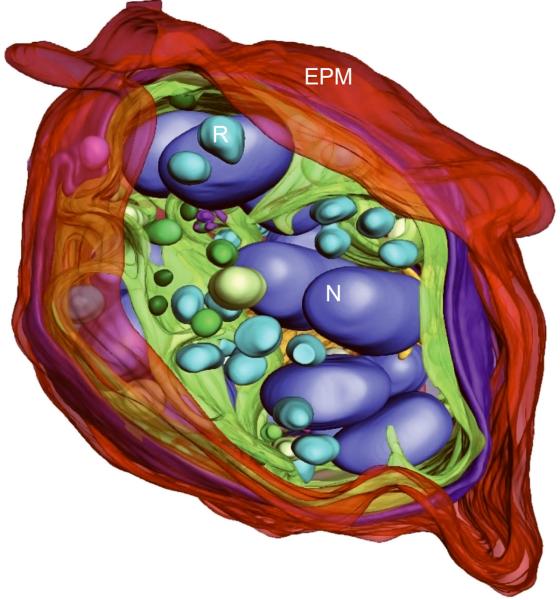
Figure 12
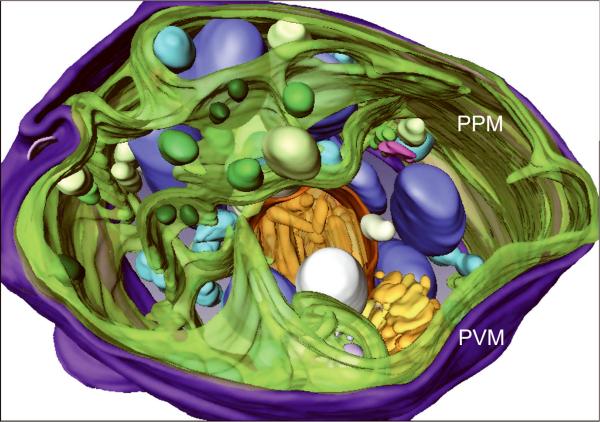
Figure 13
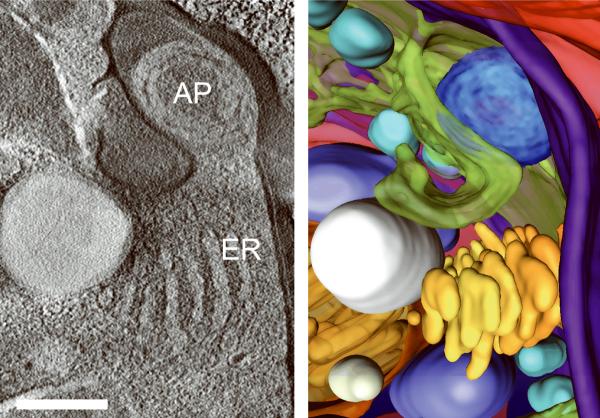
Figure 14
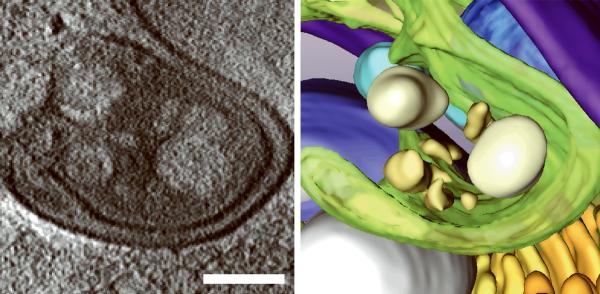
Figure 15
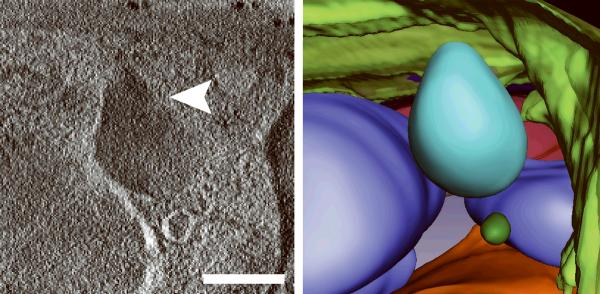
Figure 16
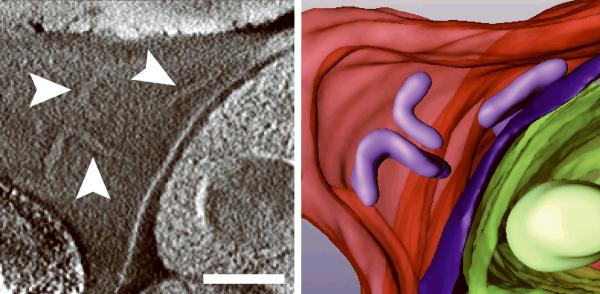
Figure 17
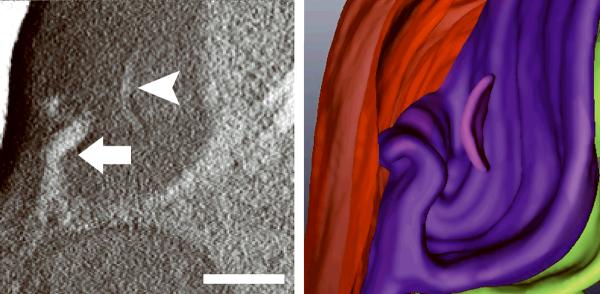
Figure 18
Figure images are served from the NIH/NLM PubMed Central Open Access Subset or Europe PMC; copyright remains with the publishers and authors.
💬 Discussion
0 commentsNo comments yet. Be the first to start a discussion!
Leave a Comment