Abstract
In multicellular organisms, proteins of the extracellular matrix (ECM) play structural and functional roles in essentially all organs, so understanding ECM protein organization in health and disease remains an important goal. Here, we used sub-diffraction resolution stochastic optical reconstruction microscopy (STORM) to resolve the in situ molecular organization of proteins within the kidney glomerular basement membrane (GBM), an essential mediator of glomerular ultrafiltration. Using multichannel STORM and STORM-electron microscopy correlation, we constructed a molecular reference frame that revealed a laminar organization of ECM proteins within the GBM. Separate analyses of domains near the N- and C-termini of agrin, laminin, and collagen IV in mouse and human GBM revealed a highly oriented macromolecular organization. Our analysis also revealed disruptions in this GBM architecture in a mouse model of Alport syndrome. These results provide the first nanoscopic glimpse into the organization of a complex ECM. DOI:http://dx.doi.org/10.7554/eLife.01149.001.
🔬 Techniques
🔭 Microscopes
🧬 Organisms
💻 Software
✨ Fluorophores
🧪 Sample Preparation
🔬 Cell Lines
🏭 Microscope Brands
🧪 Reagent Suppliers
📷 Detectors
🔎 Objectives
🎨 Filters
💻 Software Details
📋 Protocols
💾 Data Repositories
🏛️ Research Organizations (ROR)
Affiliated research institutions:
📋 Methods
Tissue handling and genetically altered mice
Kidneys were isolated from mice after transcardial perfusion with phosphate buffered saline (PBS) containing 4% (wt/vol) Paraformaldeyde (PFA; EM Sciences, Hatfield, PA). After dissection, kidneys were cut into smaller pieces and fixed overnight with 4% PFA, followed by washing off excess PFA with PBS. Kidney pieces were immersed overnight at 4°C in a cryoprotectant solution of 2.3 M sucrose + 10% polyvinylpyrrolidone (PVP) in 0.1 M PIPES (pH = 7.2). Cryoprotected tissues were mounted on a metal sectioning pin and frozen by immersion in liquid nitrogen. All transgenic and knockout mice used have been previously described. These included tetO 7 -regulated human Laminin α5 cDNA ( Goldberg et al., 2010 ), Nphs2-rtTA ( Shigehara et al., 2003 ), Tie2-Cre ( Koni et al., 2001 ), Rosa26 -LoxP-neo-LoxP-rtTA ( Belteki et al., 2005 ), and Col4a3 null ( Miner and Sanes, 1996 ) mice. Induction of human laminin α5 expression was achieved by feeding pregnant females doxycycline chow (0.15%) beginning when pregnancy was apparent and continuing after birth and after weaning. De-identified human kidney samples from individuals with no known history of kidney disease were obtained through the Washington University George O’Brien Center for Kidney Disease Research. Samples were fixed overnight in 4% paraformaldehyde and cryoprotected as described above.
Sectioning and immunohistochemistry
To capture tissue sections, acid cleaned and air-dried No. 1.0 coverglass were carbon coated for 1 min at a pressure of 2 × 10 −6 mbar. Carbon coated coverglass were glow discharged at 2 × 10 −2 mbar immediately before collecting tissue sections. Frozen tissues were sectioned at ∼200-nm thickness on a Leica EM-FC6 ultracryomicrotome equipped with a diamond knife and sections were collected on the carbon coated coverslips. Sections were re-fixed for 20 min at room temperature (RT) with 4% PFA, followed by three washes in PBS and excess PFA was quenched using 50 mM glycine in PBS. Sections were further processed for immunolabeling in the following manner: (1) blocked overnight at 4°C using 2% bovine serum albumin (BSA) in PBS, (2) primary antibodies diluted in 2% BSA-PBS were applied overnight at 4°C followed by 3 × 20 min PBS washes at RT, (3) secondary antibodies diluted 3% BSA-PBS were applied at RT for 2–3 hr followed by PBS washes. (4) Immunolabeled sections were post-fixed using 3% PFA+ 0.05% Glutaraldehyde (EM Sciences) in PBS, washed in PBS in used for STORM.
Show full methods section
Tissue handling and genetically altered mice
Kidneys were isolated from mice after transcardial perfusion with phosphate buffered saline (PBS) containing 4% (wt/vol) Paraformaldeyde (PFA; EM Sciences, Hatfield, PA). After dissection, kidneys were cut into smaller pieces and fixed overnight with 4% PFA, followed by washing off excess PFA with PBS. Kidney pieces were immersed overnight at 4°C in a cryoprotectant solution of 2.3 M sucrose + 10% polyvinylpyrrolidone (PVP) in 0.1 M PIPES (pH = 7.2). Cryoprotected tissues were mounted on a metal sectioning pin and frozen by immersion in liquid nitrogen. All transgenic and knockout mice used have been previously described. These included tetO 7 -regulated human Laminin α5 cDNA ( Goldberg et al., 2010 ), Nphs2-rtTA ( Shigehara et al., 2003 ), Tie2-Cre ( Koni et al., 2001 ), Rosa26 -LoxP-neo-LoxP-rtTA ( Belteki et al., 2005 ), and Col4a3 null ( Miner and Sanes, 1996 ) mice. Induction of human laminin α5 expression was achieved by feeding pregnant females doxycycline chow (0.15%) beginning when pregnancy was apparent and continuing after birth and after weaning. De-identified human kidney samples from individuals with no known history of kidney disease were obtained through the Washington University George O’Brien Center for Kidney Disease Research. Samples were fixed overnight in 4% paraformaldehyde and cryoprotected as described above.
Sectioning and immunohistochemistry
To capture tissue sections, acid cleaned and air-dried No. 1.0 coverglass were carbon coated for 1 min at a pressure of 2 × 10 −6 mbar. Carbon coated coverglass were glow discharged at 2 × 10 −2 mbar immediately before collecting tissue sections. Frozen tissues were sectioned at ∼200-nm thickness on a Leica EM-FC6 ultracryomicrotome equipped with a diamond knife and sections were collected on the carbon coated coverslips. Sections were re-fixed for 20 min at room temperature (RT) with 4% PFA, followed by three washes in PBS and excess PFA was quenched using 50 mM glycine in PBS. Sections were further processed for immunolabeling in the following manner: (1) blocked overnight at 4°C using 2% bovine serum albumin (BSA) in PBS, (2) primary antibodies diluted in 2% BSA-PBS were applied overnight at 4°C followed by 3 × 20 min PBS washes at RT, (3) secondary antibodies diluted 3% BSA-PBS were applied at RT for 2–3 hr followed by PBS washes. (4) Immunolabeled sections were post-fixed using 3% PFA+ 0.05% Glutaraldehyde (EM Sciences) in PBS, washed in PBS in used for STORM.
Antibodies
The primary antibodies used in this study and their approximate concentrations/dilutions used are shown in Supplementary file 1 . Secondary antibodies for STORM were purchased from Jackson Immunoresearch and were custom conjugated to Alexa647 reporter dye and either Alexa405, Cy2 or Cy3 activator dyes as described before ( Bates et al., 2007 ).
STORM microscope setup and image acquisition
STORM setup and image acquisition scheme were similar to that described before ( Dani et al., 2010 ), with the following modifications. Briefly, the STORM rig was constructed around a Nikon Eclipse TiE inverted microscope fitted with the Nikon perfect focus system for focus stabilization, a motorized stage (Marzhauser) and a 100X 1.4NA objective (Olympus UPLSAPO). Illumination lasers, 642 nm (Vortran), 561 nm, 488 nm (Coherent, Sapphire) and 405 nm (Coherent, Cube) were shuttered using an acousto-optical tunable filter (AOTF, Crystal technologies). Laser beams were combined, expanded, collimated and focused at the back focal plane of the 100X objective. Total internal reflection fluorescence (TIRF) illumination was achieved with an objective type TIRF geometry using a custom-built translation stage. Sections immunolabeled on carbon coverglass were inverted onto a slide containing a drop of imaging buffer containing mercaptoethylamine along with an oxygen scavenger system, and coverglass edges were sealed with nail polish. In all experiments described here, we performed single reporter (Alexa647)-multiple activator STORM as described before ( Bates et al., 2007 ; Dani et al., 2010 ). Alexa647 images (∼10,000 images per channel) acquired by the same objective were separated using a quad band dichroic ZT405/488/561/640rpc and filtered using ET705/72m emission filter (Chroma). Images were captured on an EM-CCD camera (iXon+ DU897, Andor) and analyzed using custom software. Image stacks were fitted with an elliptical Gaussian function to determine the centroid positions of fluorescent pixel intensity peaks. These positions termed ‘STORM localizations’ were rendered as STORM images or analyzed further quantitatively.
Quantification of STORM localizations and molecule positions
To quantify STORM localizations and to estimate molecule positions with high precision, multiple GBM regions, each as a ∼800 nm wide window, were selected towards the most peripheral aspect of circular capillary loops, to avoid the mesangial regions where the mesangial matrix meets the GBM. Selected regions were rotated to uniformly orient the podocyte and endothelial sides. STORM localizations from agrinC and a co-labeled molecule, were projected onto the perpendicular axis for each region and fitted with Gaussian functions to identify the centroid positions of the STORM localizations. The midpoint between the two agrinC centroid positions was set as zero and the position of the second molecule of interest was identified by the distance of its centroid position with respect to the zero. This procedure was iterated over multiple regions to estimate the mean position, standard error of the mean and standard deviation for each molecule. To view the quantitative profile of STORM localizations, a histogram was generated from each region by projecting localization points onto a line perpendicular to the long axis of the capillary loop. Each histogram was shifted to align them by their zero position and an accumulated histogram from several regions was constructed by adding up all localizations. The number of regions used to generate the histograms, the mean position of each molecule, standard error of the mean and standard deviation are reported as Figure 4—source data 1 and Figure 5—source data 1 . All quantifications were performed using custom scripts in Matlab and the data were plotted in Origin software. Quick-freeze, deep-etch electron microscopy and STORM-EM correlation Quick-freeze deep-etch EM was performed according to published protocol, with minor modifications ( Heuser, 1980 ). After STORM, nail polish from the coverglass was carefully removed by immersing in PBS, and the tissue sections were fixed in 2% glutaraldehyde in100 mM NaCl, 30 mM HEPES and 2 mM CaCl, pH 7.2 (NaHCaCl) at room temperature. 3 × 3 mm areas of the coverglass containing STORM imaged sections were cut, rinsed in dH 2 O and frozen by abrupt application of the sample against a liquid helium cooled copper block with a Cryopress freezing machine. Frozen samples were transferred to a liquid nitrogen cooled Balzers 400 vacuum evaporator, etched for 20 min at −80 ° C and rotary replicated with ∼ 2 nm platinum deposited from a 20 ° angle above the horizontal, followed by an immediate ∼10 nm stabilization film of pure carbon deposited from an 85 ° angle. Replicas were floated onto a dish of concentrated hydrofluoric acid and transferred through several rinses of dH20 with a loopful of Photo-flo, picked up on Luxel grids (Luxel, Friday Harbor, WA), and photographed on a JEOL 1400 microscope with attached AMT digital camera. The glomeruli imaged by EM were matched with the corresponding STORM images, and the two images were superimposed using Adobe Photoshop. The STORM–EM correlation procedure is illustrated in Figure 1—figure supplement 2 . Immunogold labeling was done on cryosections collected on a 3 × 3 mm coverglass followed by detection with 12 nm colloidal gold affinity purified secondary antibodies (Jackson Immuno Research) diluted 1: 15 in PBS/2% BSA over 2 hr at RT, rinsed with three 10 min washes of PBS, followed by fixation in 2% glutaraldehyde in NaHCaCl. Prior to freezing, coverglass was rinsed in dH 2 0, frozen and platinum replicas made as described above.
Additional files 10.7554/eLife.01149.019 Supplementary file 1. List of antibodies used in this study. DOI: http://dx.doi.org/10.7554/eLife.01149.019
📊 Figures
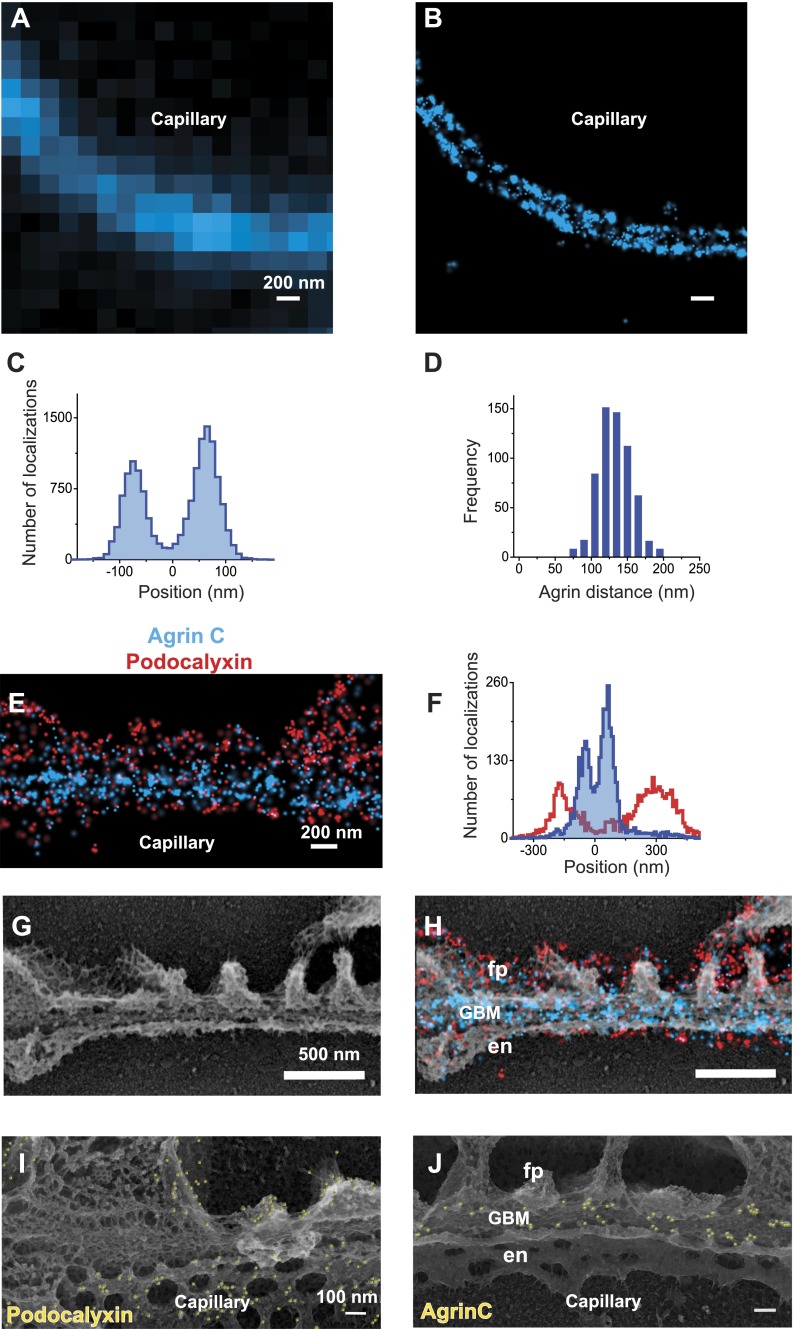
Figure 1.
STORM and STORM-EM image correlation of the mouse GBM.
Conventional fluorescence ( A ) and STORM ( B ) images of a kidney glomerular capillary loop labeled with an antibody to agrin. ( C ) Projection histogram of agrin STORM localizations accumulated from...
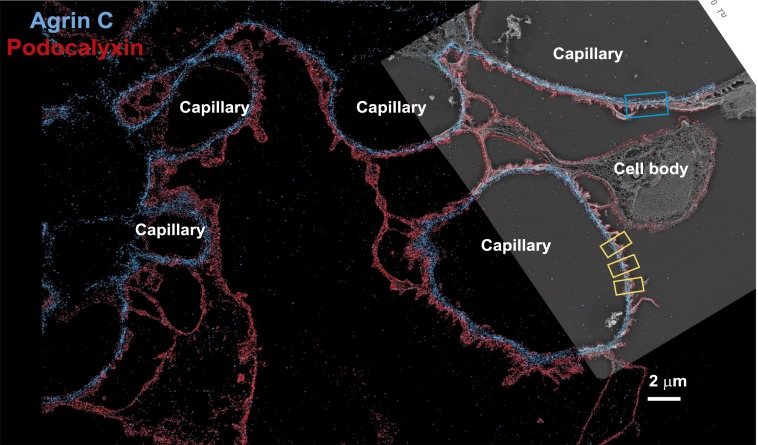
Figure 1u2014figure supplement 1.
Low magnification image of EM/STORM correlation.
Wide-field STORM image of a kidney section labeled with podocalyxin and agrinC, overlaid with a platinum deep etch replica EM image obtained from the same section. Podocyte cell bodies and capillary l...
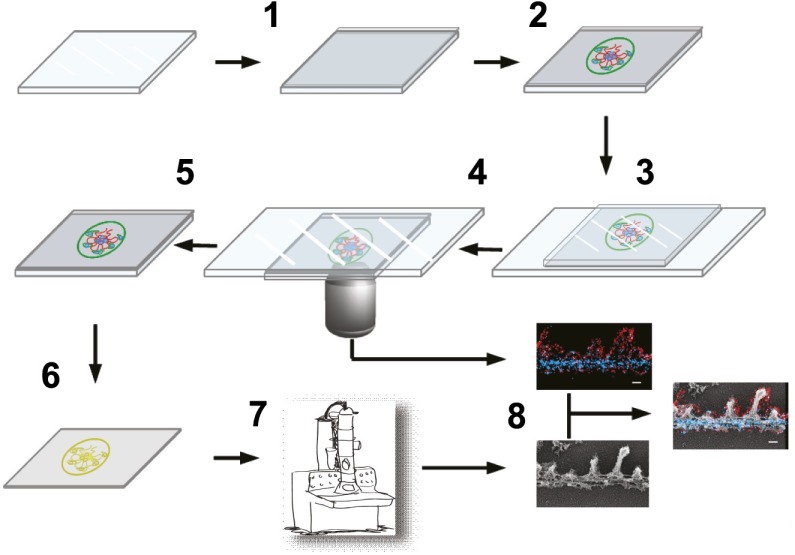
Figure 1u2014figure supplement 2.
Schematic showing steps involved in processing of samples.
Schematic of the STORMu2013EM correlation procedure consisting of the following steps: (1) glass coverslip is coated with carbon and glow discharged, (2) Tokuyasu cryo-sections are collected on the ca...
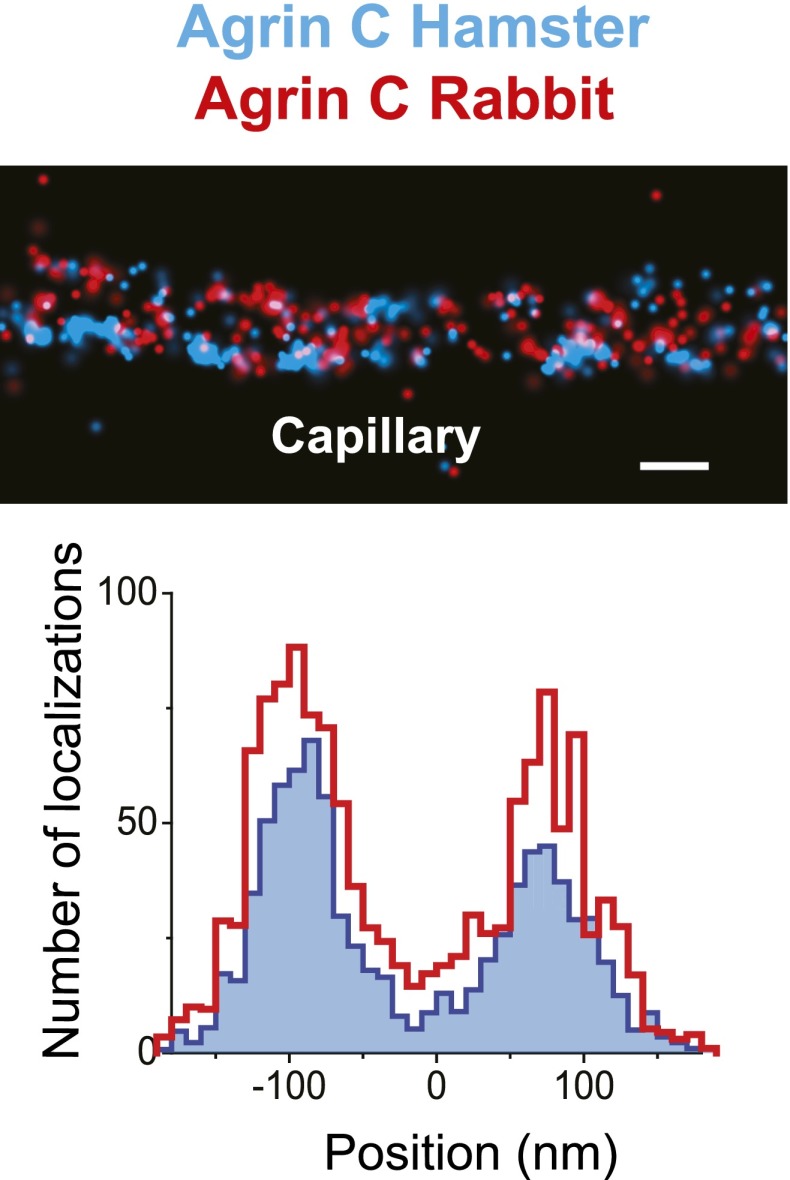
Figure 1u2014figure supplement 3.
Similar pattern of staining from two different agrin antibodies.
STORM image and projection histogram of two separate antibodies labeling the C-terminus end of agrin. Scale bar: 200 nm. DOI: http://dx.doi.org/10.7554/eLife.01149.006
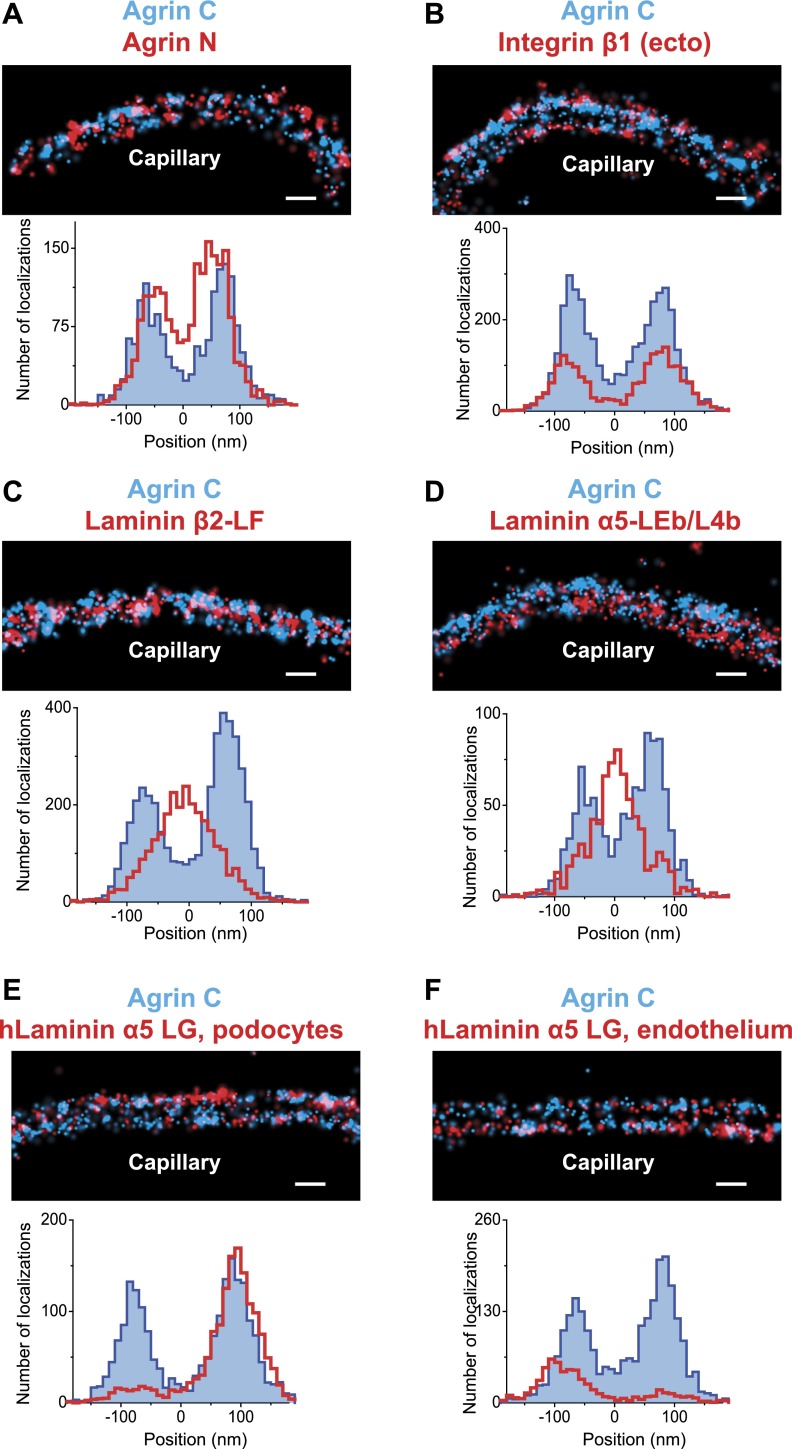
Figure 2.
Positioning molecular domains within the GBM.
Two channel STORM of agrinC along with antibodies to agrinN ( A ), the integrin u03b21 extracellular domain ( B ), laminin u03b22-LF domain ( C ) and laminin u03b15-LEb/L4b domain ( D ). Sections from...
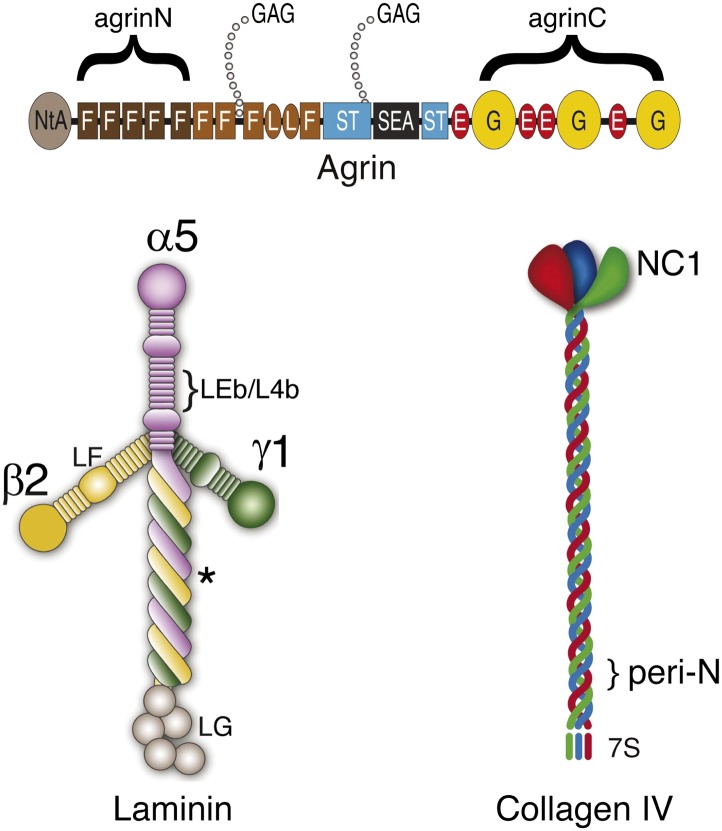
Figure 2u2014figure supplement 1.
Cartoon showing the relationship between antigenic epitopes and the structure of Agrin, Laminin and Collagen IV.
Illustration of ECM molecule epitopes mapped by antibodies used in this study. Glycosaminoglycan (GAG) chains attached to agrin are shown. The asterisk indicates the approximate binding site for the a...
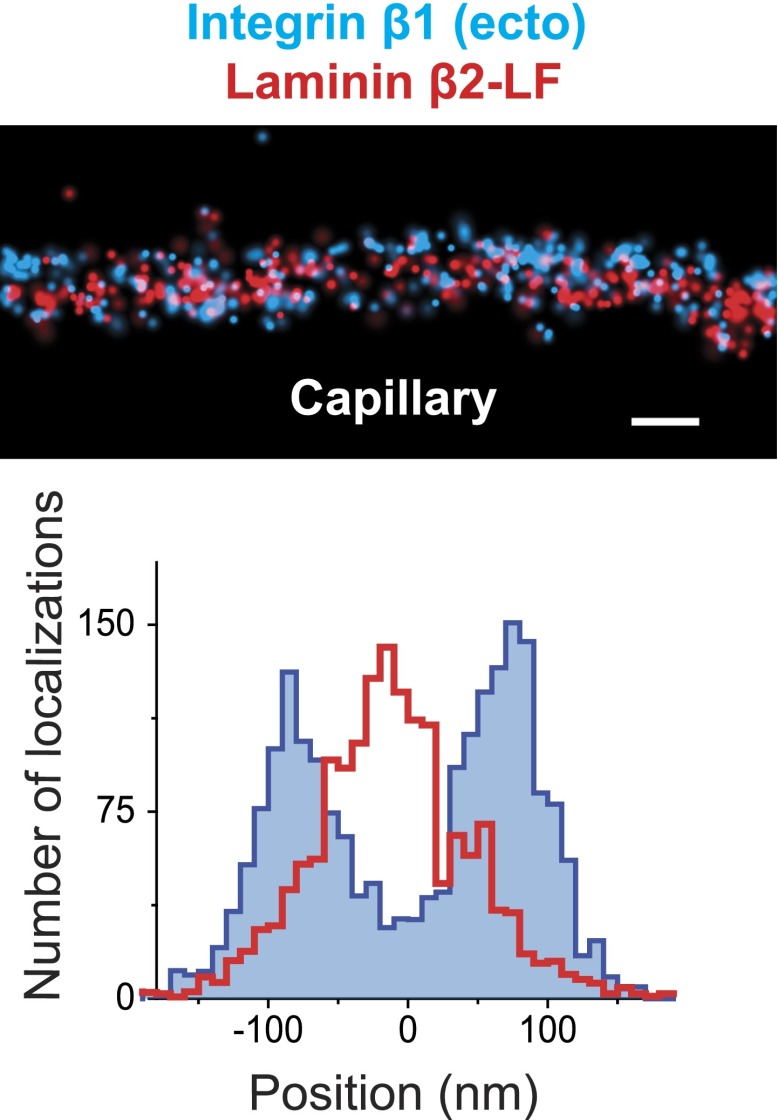
Figure 2u2014figure supplement 2.
STORM image of Integrin u03b21 and Laminin u03b22 confirms the central localization of Laminin.
STORM image and projection histogram of laminin u03b22 along with integrin u03b21 antibody. Scale bar: 200 nm. DOI: http://dx.doi.org/10.7554/eLife.01149.009
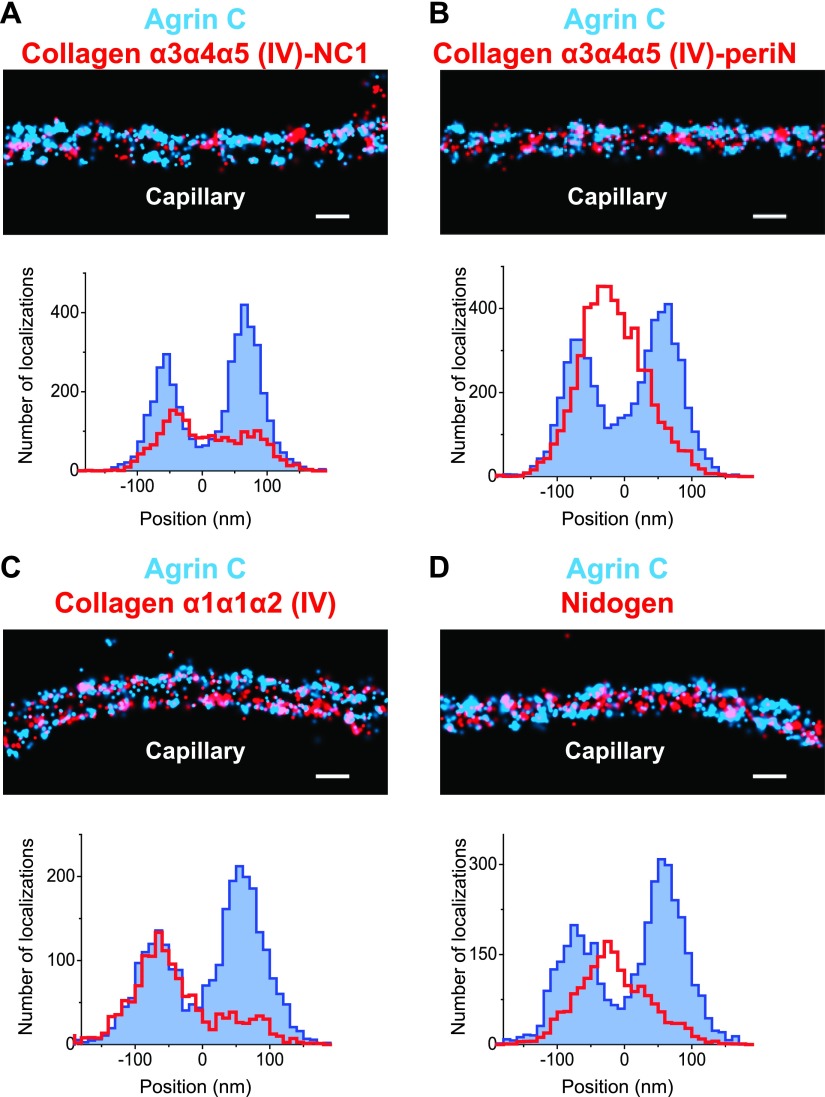
Figure 3.
Collagen IV distribution in the GBM.
STORM localization of collagen u03b13u03b14u03b15 (IV)-NC1 ( A ) and collagen u03b13u03b14u03b15 (IV)-periN ( B ) domains along with agrinC show the position of the collagen u03b13u03b14u03b15 (IV) ne...
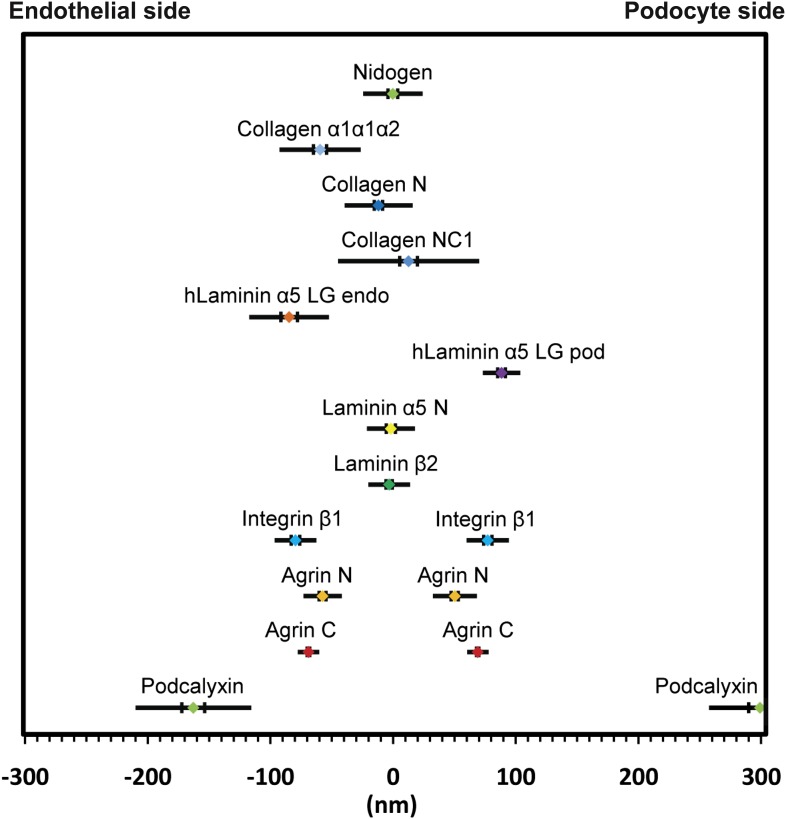
Figure 4.
Positions of molecular epitopes within the GBM.
A map of axial positions of various GBM protein domains obtained from STORM imaging in this study. For each protein, the colored dot specifies the mean axial position; the two vertical lines represent...
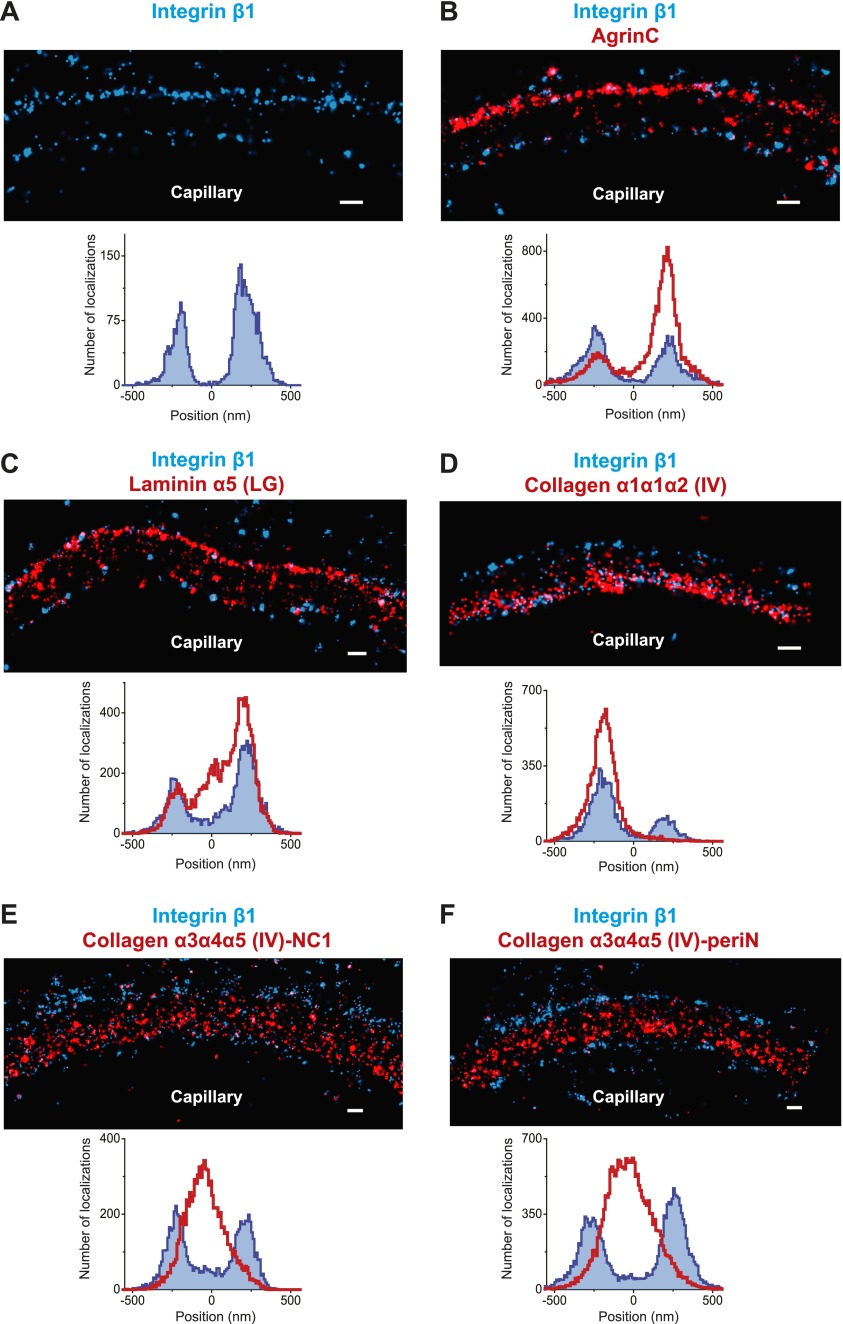
Figure 5.
Molecular organization of the human GBM.
( A ) Single channel STORM of integrin u03b21-labeled human GBM sections. Figure 5u2014figure supplement 1 shows two channel STORM using two different integrin u03b21 antibodies. Human kidney sections...
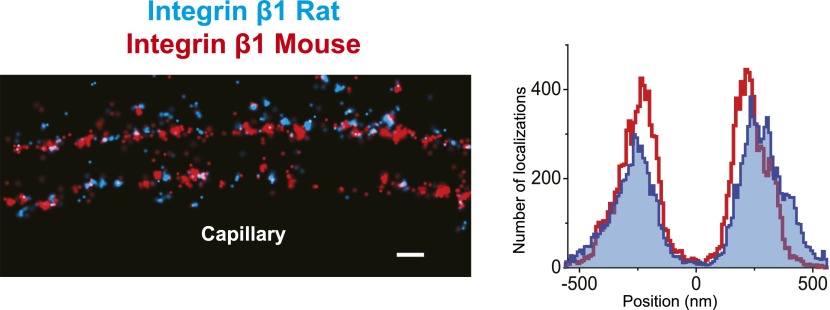
Figure 5u2014figure supplement 1.
Similar pattern of staining obtained with two different human integrin u03b21 antibodies.
Double channel STORM using two different integrin u03b21 antibodies to label human GBM sections (MAB13: blue, TS2/16: red). The projection histogram reveals a peak-to-peak distance of u223c400 nm. Sca...
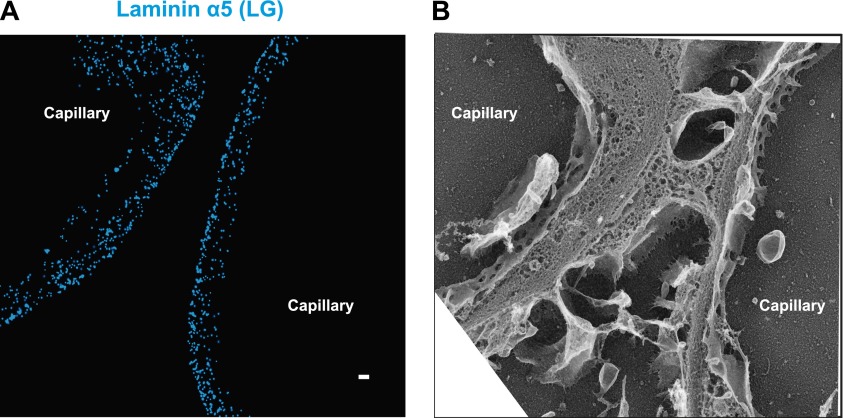
Figure 5u2014figure supplement 2.
Laminin a5 stains multiple layers in normal human GBM.
( A and B ) STORM image of laminin u03b15-LG labeling of the human GBM and a replica EM image of the same section. Scale bar: 200 nm. DOI: http://dx.doi.org/10.7554/eLife.01149.016
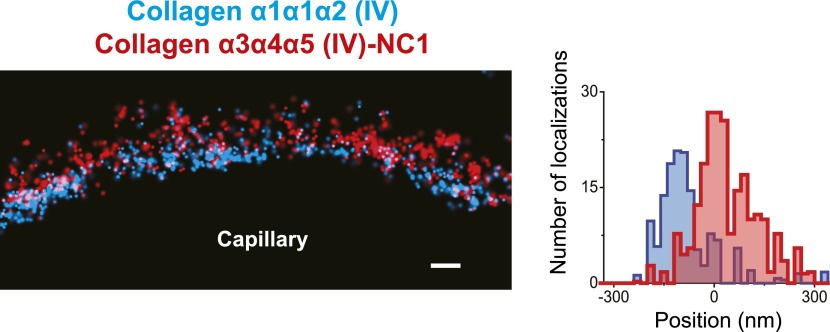
Figure 5u2014figure supplement 3.
Distinct localization of Collagen u03b11u03b11u03b12 (IV) and Collagen u03b13u03b14u03b15 (IV) in human GBM.
Collagen u03b11u03b11u03b12(IV) and collagen u03b13u03b14u03b15 (IV)-NC1 labeling of a human GBM region. Since agrin or integrin were not used for orientation, the localizations from the region depict...
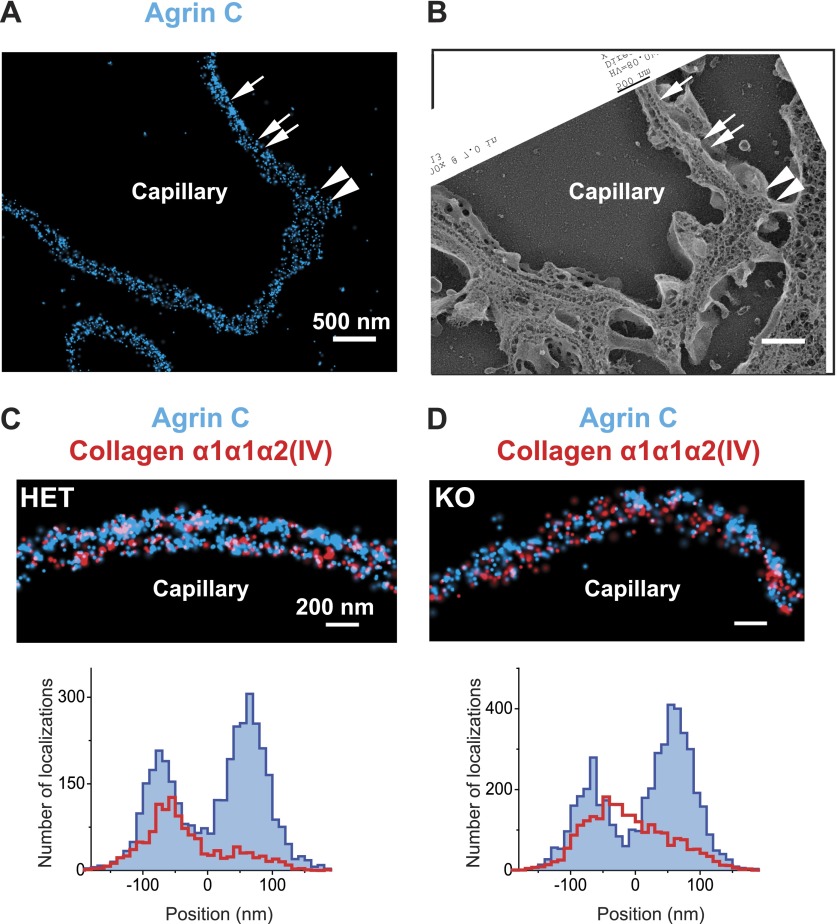
Figure 6.
Breakdown of the GBM molecular architecture in a mouse model of Alport syndrome.
( A and B ) STORM and EM images of a capillary loop from a collagen u03b13(IV) knockout (KO) mouse kidney labeled with agrinC shows a thin GBM with 2-layered agrin (single arrow) as well as a breakdow...
Figure images are served from the NIH/NLM PubMed Central Open Access Subset or Europe PMC; copyright remains with the publishers and authors.
💬 Discussion
0 commentsNo comments yet. Be the first to start a discussion!
Leave a Comment