Abstract
Abstract Inhibition of VEGF signalling effectively suppresses localized tumour growth but accelerates tumour invasiveness and micrometastasis by unknown mechanisms. To study the dynamic and reciprocal interactions between tumour cells and their microenvironment during these processes, we established a xenograft model by injecting tumour cells into the blood circulation of transparent zebrafish embryos. This reproducibly results in rapid simultaneous formation of a localized tumour and experimental micrometastasis, allowing time‐resolved imaging of both processes at single‐cell resolution within 1 week. The tumour vasculature was initiated de novo by remodelling of primitive endothelial cells into a functional network. Roles of myeloid cells in critical tumourigenesis steps such as vascularization and invasion were revealed by genetic and pharmaceutical approaches. We discovered that the physiological migration of neutrophils controlled tumour invasion by conditioning the collagen matrix and forming the metastatic niche, as detected by two‐photon confocal microscopy and second harmonic generation. Administration of VEGFR inhibitors blocked tumour vascularization and a localized tumour growth but enhanced migration of neutrophils, which in turn promoted tumour invasion and formation of micrometastasis. This demonstrates the in vivo cooperation between VEGF signalling and myeloid cells in metastasis and provides a new mechanism underlying the recent findings that VEGFR targeting can promote tumour invasiveness. Copyright © 2012 Pathological Society of Great Britain and Ireland. Published by John Wiley & Sons, Ltd.
🔬 Techniques
🔭 Microscopes
🧬 Organisms
💻 Software
✨ Fluorophores
🧪 Sample Preparation
🔬 Cell Lines
🏭 Microscope Brands
🧪 Reagent Suppliers
💻 Software Details
🏛️ Research Organizations (ROR)
Affiliated research institutions:
📋 Methods
Zebrafish maintenance, morpholino injection and pharmacological treatment Zebrafish and embryos were raised, staged and maintained according to standard procedures in compliance with the local animal welfare regulations. The transgenic lines Tg(fli1:GFP) and Tg(mpx:GFP) were used in this study 25 , 26 . 0.2 m m N -phenylthiourea (PTU; Sigma) was applied to prevent pigment formation from 1 day post-fertilization (dpf). For Pu.1 knockdown as previously published, Pu.1 MO (1 m m for partial knockdown and 2 m m for complete knockdown 32 was injected into the yolk at the one-cell stage, as described 33 . For pharmacological inhibition, the VEGFR tyrosine kinase inhibitors KRN633 (0.1–1.0 µ m ; Santa Cruz) or Sunitinib (0.1–1.0 µ m ; Sigma), beclomethasone (25 µ m ; Sigma) and β-amino- proprionitrile (βAPN, 500 µ m ; Sigma) were applied directly to the egg water and refreshed every 2 days.
Cell lines Murine aortic endothelial
(MAE) cells and tumourigenic FGF2-over-expressing FGF2-T-MAE cells 34 (provided by M. Presta, University of Brescia, Italy) and the human breast carcinoma cell line MDA-MB-231 35 (provided by P. ten Dijke, Leiden University Medical Centre, The Netherlands) were cultured as previously described. 4T1 (CRL-2539, ATCC) and PC3 (CRL-1435, ATCC) cells were cultured in RPMI 1640 supplemented with 10% fetal bovine serum (FBS; Invitrogen). Stable fluorescent cell lines were generated using lentiviral vectors expressing dsRed or mCherry (provided by R. C. Hoeben, Leiden University Medical Centre, The Netherlands). The virus-infected cells were used for experiments without FACS sorting and the fluorescence was stable in vitro for > 10 passages.
Show full methods section
Zebrafish maintenance, morpholino injection and pharmacological treatment Zebrafish and embryos were raised, staged and maintained according to standard procedures in compliance with the local animal welfare regulations. The transgenic lines Tg(fli1:GFP) and Tg(mpx:GFP) were used in this study 25 , 26 . 0.2 m m N -phenylthiourea (PTU; Sigma) was applied to prevent pigment formation from 1 day post-fertilization (dpf). For Pu.1 knockdown as previously published, Pu.1 MO (1 m m for partial knockdown and 2 m m for complete knockdown 32 was injected into the yolk at the one-cell stage, as described 33 . For pharmacological inhibition, the VEGFR tyrosine kinase inhibitors KRN633 (0.1–1.0 µ m ; Santa Cruz) or Sunitinib (0.1–1.0 µ m ; Sigma), beclomethasone (25 µ m ; Sigma) and β-amino- proprionitrile (βAPN, 500 µ m ; Sigma) were applied directly to the egg water and refreshed every 2 days.
Cell lines Murine aortic endothelial
(MAE) cells and tumourigenic FGF2-over-expressing FGF2-T-MAE cells 34 (provided by M. Presta, University of Brescia, Italy) and the human breast carcinoma cell line MDA-MB-231 35 (provided by P. ten Dijke, Leiden University Medical Centre, The Netherlands) were cultured as previously described. 4T1 (CRL-2539, ATCC) and PC3 (CRL-1435, ATCC) cells were cultured in RPMI 1640 supplemented with 10% fetal bovine serum (FBS; Invitrogen). Stable fluorescent cell lines were generated using lentiviral vectors expressing dsRed or mCherry (provided by R. C. Hoeben, Leiden University Medical Centre, The Netherlands). The virus-infected cells were used for experiments without FACS sorting and the fluorescence was stable in vitro for > 10 passages.
Zebrafish fibroblast cell lines
ZF4 and PAC2 were cultured as previously described 36 . Embryo preparation and tumour cell implantation Dechorionized 2dpf zebrafish embryos were anaesthetized with 0.003% tricaine (Sigma) and positioned on a 10 cm Petri dish coated with 1% agarose. Mammalian cells were trypsinized into single cell suspensions, resuspended in phosphate-buffered saline (PBS; Invitrogen), kept at room temperature before implantation and implanted within 3 h. Non-fluorescent cells were labelled with the fluorescent cell tracker CM-DiI (Invitrogen) according to the manufacturer's instructions. The cell suspension was loaded into borosilicate glass capillary needles (1 mm o.d. × 0.78 mm i.d.; Harvard Apparatus) and the injections were performed using a Pneumatic Pico pump and a manipulator (WPI). 50–400 cells, manually counted, were injected at approximately 60 µ m above the ventral end of the duct of Cuvier where it opens into the heart. After implantation with mammalian cells, zebrafish embryos (including non-implanted controls) were maintained at 34 °C to compromise between the optimal temperature requirements for fish and mammalian cells 37 . Up to 600 implantations were manually achieved per h, with survival rates of > 90% until 6 days post-implantation (dpi). For pharmacological inhibition, beclomethasone was applied to the embryos 4 h before implantation and KRN633, Sunitinib and βAPN were applied 4–6 h post-implantation. For each cell line or condition, data are representative of ≥ three independent experiments, with ≥ 30 embryos/group. Experiments were discarded when the survival rate of the control group was < 90%.
Microscopy and analysis
For live imaging, embryos were anaesthetized using 0.016% tricaine (Sigma) and mounted in 0.6% low-melting agarose. Fixed embryos were imaged in PBST. Fluorescent image acquisition was performed using a Leica MZ16FA stereo microscope, a Leica TCS SPE confocal microscope or a Zeiss LSM exciter on an Axio Observer confocal microscope. Confocal stacks were processed for maximum intensity projections with Zeiss ZEN2009 software or ImageJ software. Images were adjusted for brightness and contrast using ImageJ. Overlays were created using Adobe Photoshop CS4 or ImageJ. 3D reconstructions and movies were assembled using ImageJ.
Second-harmonic generation and two-photon microscopy
Second-harmonic generation
(SHG) was used to image the helical structures of collagen fibres, which are capable of combining two photons into one 38 . The two-photon microscopy was performed on a Zeiss 710 NLO upright confocal microscope equipped with a Spectraphysiscs Deep See MP laser. The images were obtained with an excitation wavelength of 750 nm and only emitted light with a wavelength in the range 371–467 nm was detected.
Myeloid cell detection
In the Tg(fli1:GFP) line, the neutrophils in fixed embryos were detected using the Peroxidase/ Myeloperoxidase Leukocyte Kit (Sigma), as described previously 39 . The embryos were imaged with transmitted light and the black-stained cells were extracted using the Threshold function of ImageJ and subsequently converted into a selected colour for overlay with fluorescence images. For macrophage detection, immunohistochemistry for L -plastin was performed after the myeloperoxidase activity assay and the Mpx − / L -plastin + cells were counted as macrophages 31 . The Tg(mpx:GFP) line was used to monitor neutrophil migration in vivo 26 . Time-lapse imaging (1 min intervals, ≥ 30 min) was performed using a Leica stereofluorescence microscope. The migration tracks were generated by maximum intensity projections of the time stacks, using ImageJ. For individual neutrophil tracking, the first 20 GFP + cells from the posterior end of the tail fin in each embryo, which exhibited consistent intensity for at least 15 min, were tracked and analysed using the Manual Tracking plugin of ImageJ.
Immunohistochemistry
Whole-mount immunohistochemistry was carried out as described 40 . Primary antibodies and dilutions were used as follows: L -plastin (rabbit anti-zebrafish, 1:500; provided by A Huttenlocher 31 ), ZO-1 (mouse anti-human, 1:300; Invitrogen), phosphohistone H3 (rabbit anti-human, 1:500; Santa Cruz). A 1:200 dilution of the secondary antibodies (Alexa 405 anti-mouse, Alexa 568 anti-mouse or Alexa 568 anti-rabbit; Invitrogen) was used for detection. Tail fin wounding Zebrafish embryos at 2–3 dpf were anaesthetized using 0.016% tricaine (Sigma) and then wounded on the ventral side of the tail fin with the tip of a glass capillary needle, as described 39 . Wounded embryos were fixed in 4% paraformaldehyde/PBS at various time points after the wounding and stored in PBS containing 0.01% Tween-20 (PBST) at 4 °C for myeloid cell detection. Microangiography Tetramethylrhodamine dextran was injected into the sinus venosus of anaesthetized zebrafish embryos, as described 41 . Images were acquired within 10 min after injection.
Statistical analysis
Statistical analysis was performed using Prism 4 software (GraphPad), two- or one-tailed unpaired t -tests with confidence intervals of 90% or 95%: ns, not significant ( p > 0.05); *0.01 < p < 0.05; **0.0001 < p < 0.01; *** p < 0.0001.
📊 Figures
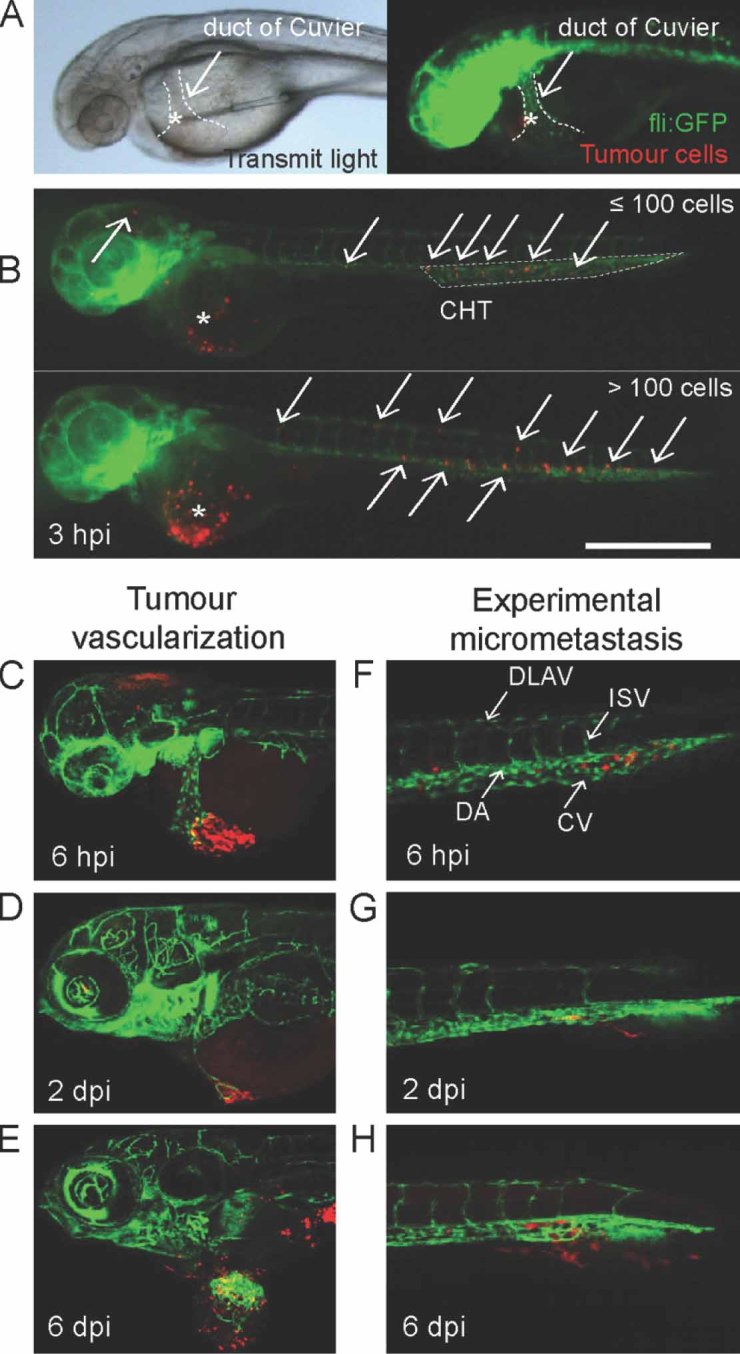
Figure 1
Intravascular injection of tumour cells into zebrafish embryos resulted in localized tumour growth and micrometastasis within 6 days. (A) Bright-field (left) and fluorescence (right) images showing th...
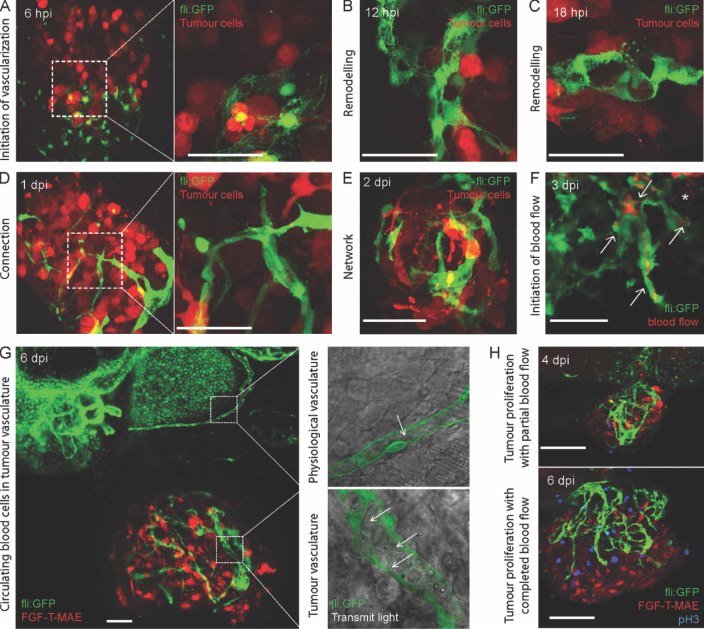
Figure 2
Tumour vascularization and localized tumour growth. (Au2013E) Initiation of tumour-induced neovasculature. Fli: GFP embryos were imaged from the ventral side to achieve a top view of dsRed-labelled FG...
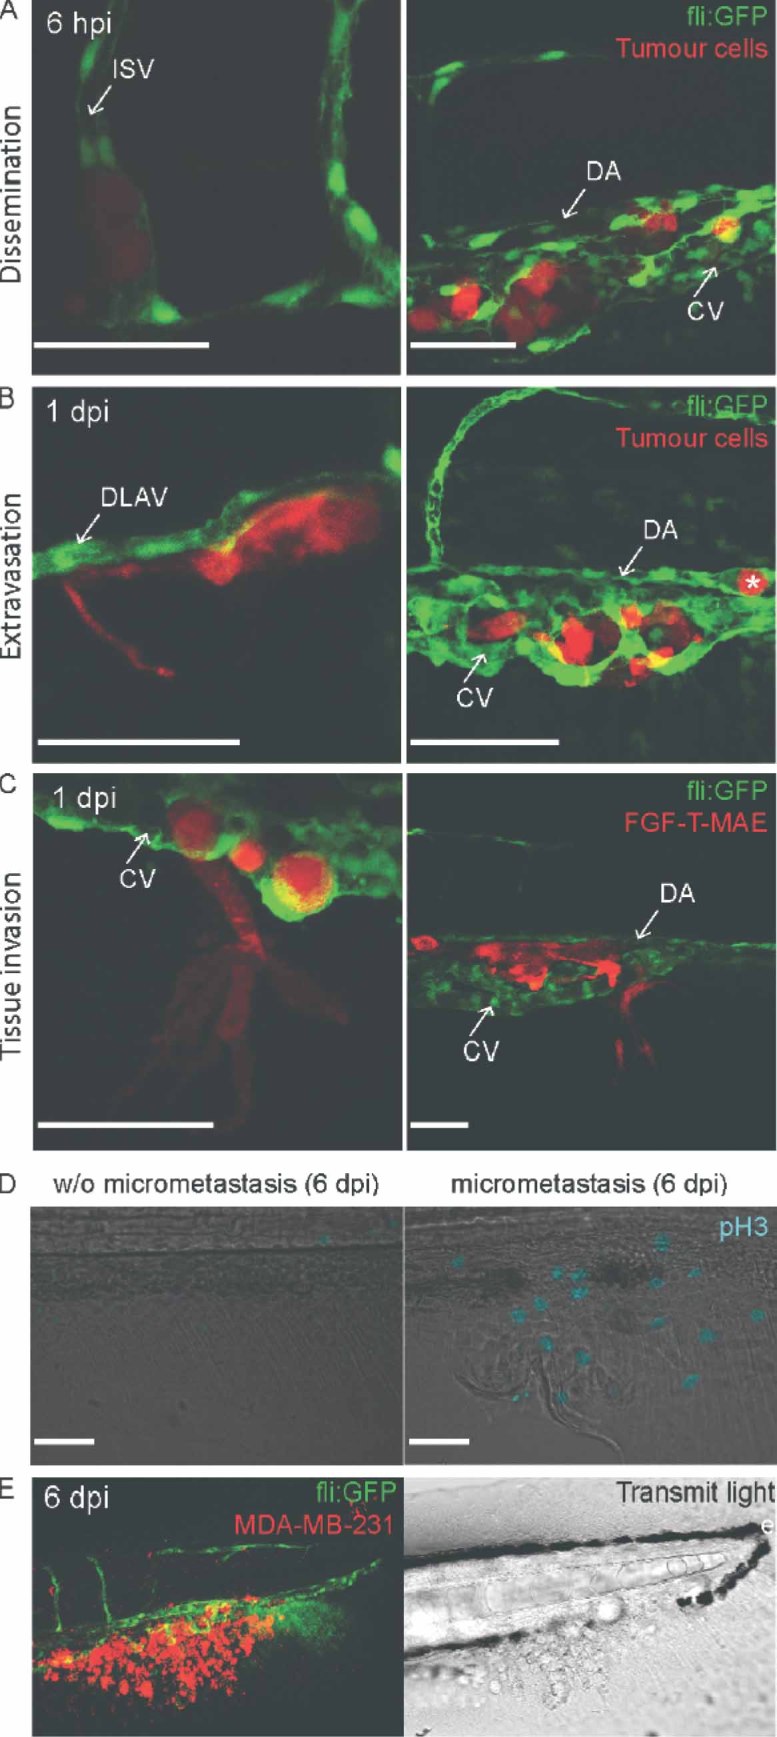
Figure 3
Tumour cell extravasation, invasion and formation of micrometastases. (A) DsRed-labelled FGF-T-MAE cells detected at 6 hpi within the intersegmental vessel (ISV, left), the dorsal aorta (DA, right) an...
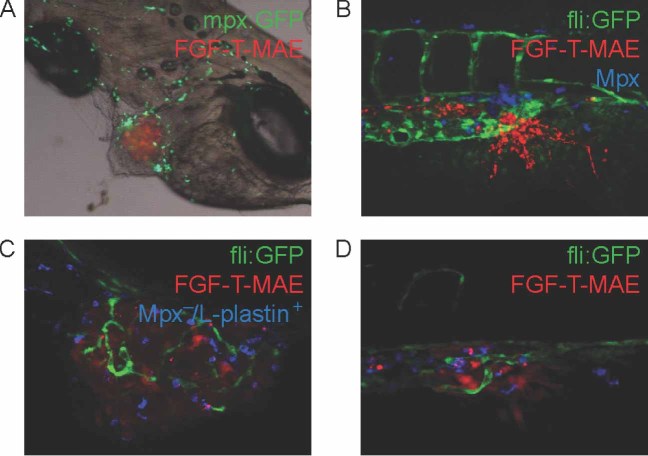
Figure 4
Myeloid cells associated with tumour cells at the localized tumour and micrometastasis sites. (A) Neutrophils [green; Tg(mpx:GFP) ] associated with FGF-T-MAE tumour cells (red) at the localized tumour...
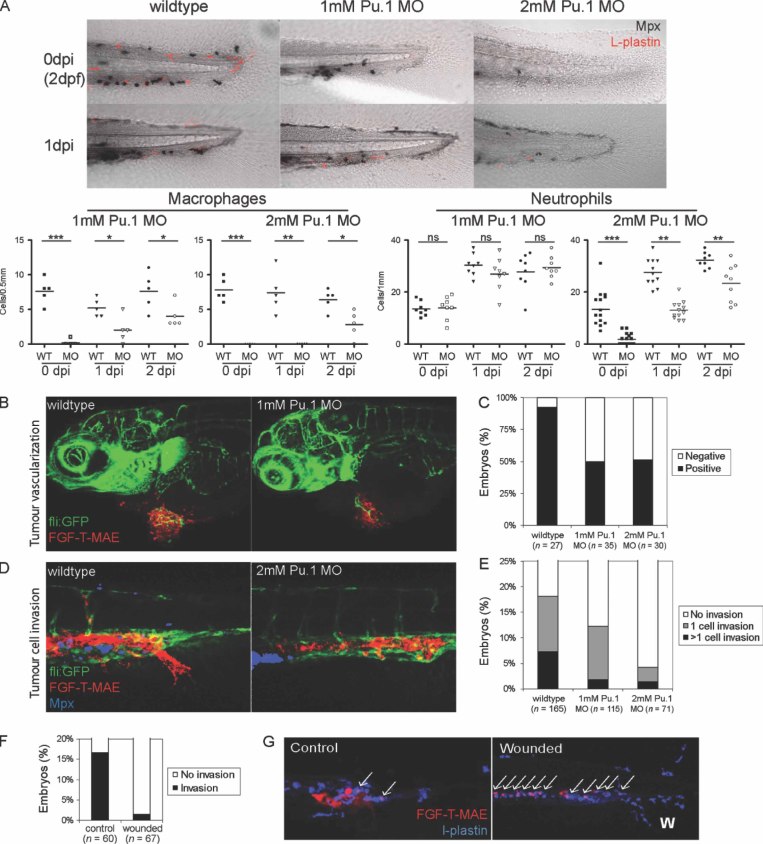
Figure 5
Myeloid cells contribute to tumour vascularization and invasion. (A) Lineage-specific depletion of macrophages and neutrophils by dose-dependent morpholino-mediated knockdown of Pu.1. Neutrophils are ...
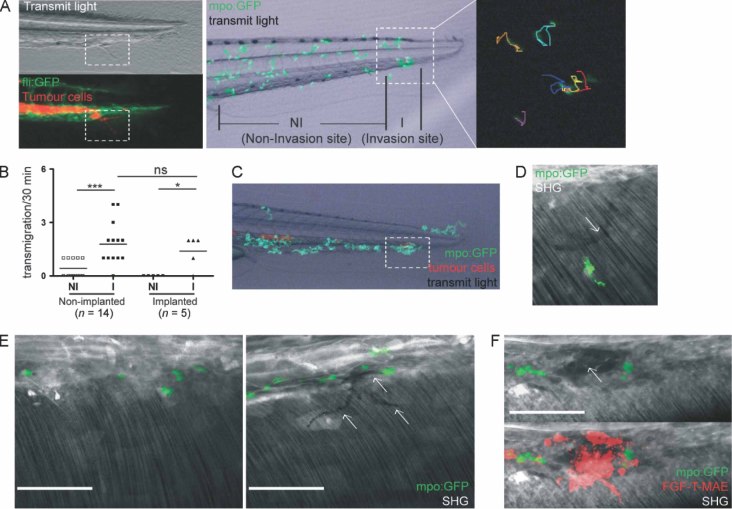
Figure 6
Physiological migration of neutrophils between the caudal haematopoietic tissue and the tail fin at the tumour invasion site conditions the collagen matrix for tumour cell invasion. (A) Migration trac...
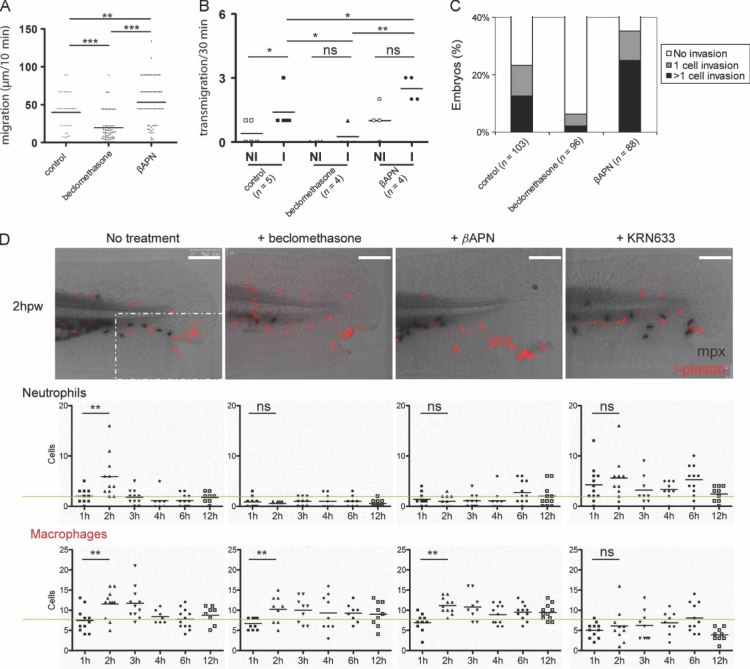
Figure 7
Tumour cell invasion is controlled by non-pathological neutrophil migration. (A) The random non-pathological migration of neutrophils was suppressed by beclomethasone (25 u00b5 m ) and promoted by u03...
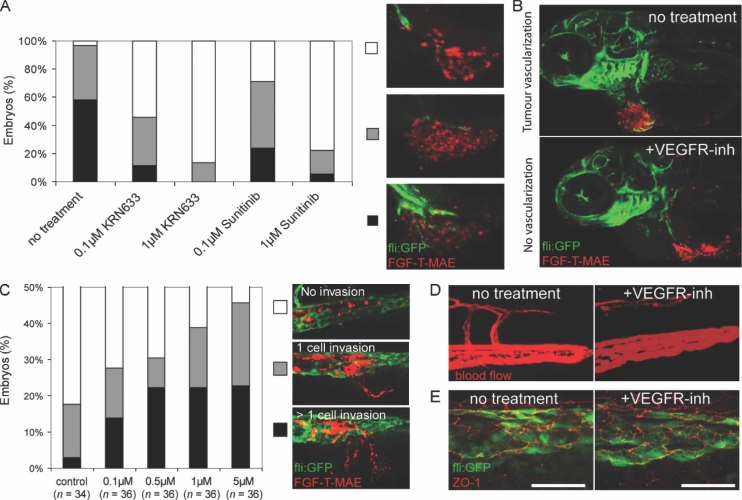
Figure 8
VEGFR inhibitors suppress tumour vascularization but promote tumour cell invasion. (A) Tumour vascularization was significantly suppressed by VEGFR inhibitors KRN633 or Sunitinib at both concentration...
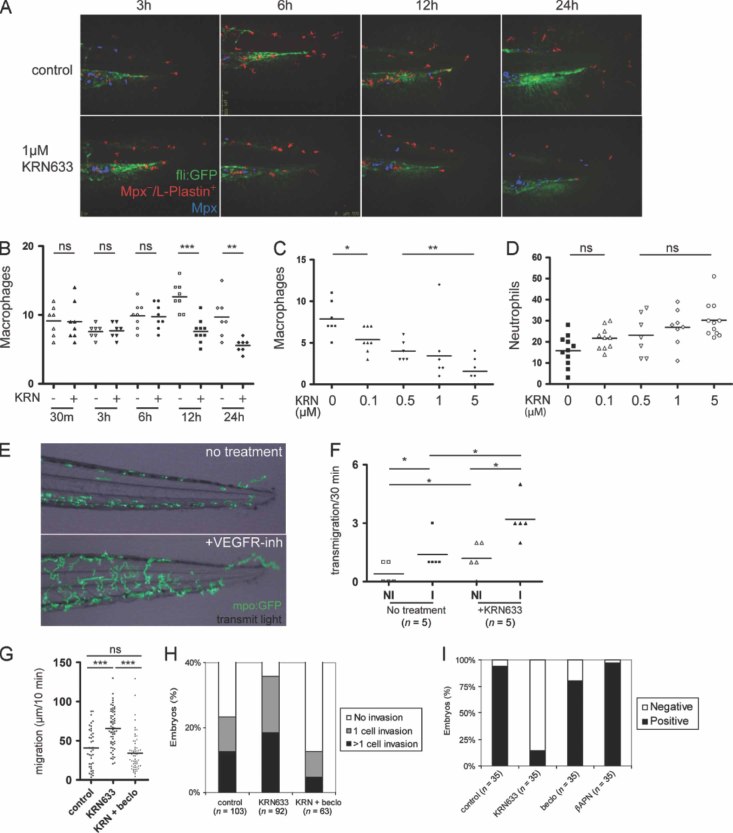
Figure 9
VEGFR inhibitors promoted tumour cell invasion via enhancement of physiological neutrophil migration. (Au2013C) Suppression of macrophages by VEGFR inhibition. 2dpf Tg(fli:GFP) embryos were untreated ...
Figure images are served from the NIH/NLM PubMed Central Open Access Subset or Europe PMC; copyright remains with the publishers and authors.
💬 Discussion
0 commentsNo comments yet. Be the first to start a discussion!
Leave a Comment