Abstract
BACKGROUND: The nuclear enzyme poly(ADP-ribose) polymerase-1 (PARP-1) is required for pro-inflammatory effects of TNFα. Our previous studies demonstrated that PARP-1 mediates TNFα-induced NF-κB activation in glia. Here, we evaluated the mechanisms by which TNFα activates PARP-1 and PARP-1 mediates NF-κB activation. METHODS: Primary cultures of mouse cortical astrocytes and microglia were treated with TNFα and suitable signaling pathway modulators (pharmacological and molecular). Outcome measures included calcium imaging, PARP-1 activation status, NF-κB transcriptional activity, DNA damage assesment and cytokine relesease profiling. RESULTS: TNFα induces PARP-1 activation in the absence of detectable DNA strand breaks, as measured by the PANT assay. TNFα-induced transcriptional activation of NF-κB requires PARP-1 enzymatic activity. Enzymatic activation of PARP-1 by TNFα was blocked in Ca(2+)-free medium, by Ca(2+) chelation with BAPTA-AM, and by D609, an inhibitor of phoshatidyl choline-specific phospholipase C (PC-PLC), but not by thapsigargin or by U73112, an inhibitor of phosphatidyl inisitol-specific PLC (PI -PLC). A TNFR1 blocking antibody reduced Ca(2+) influx and PARP-1 activation. TNFα-induced PARP-1 activation was also blocked by siRNA downregulation of ERK2 and by PD98059, an inhibitor of the MEK / ERK protein kinase cascade. Moreover, TNFα-induced NF-κB (p65) transcriptional activation was absent in cells expressing PARP-1 that lacked ERK2 phosphorylation sites, while basal NF-κB transcriptional activation increased in cells expressing PARP-1 with a phosphomimetic substitution at an ERK2 phophorylation site. CONCLUSIONS: These results suggest that TNFα induces PARP-1 activation through a signaling pathway involving TNFR1, Ca(2+) influx, activation of PC-PLC, and activation of the MEK1 / ERK2 protein kinase cascade. TNFα-induced PARP-1 activation is not associated with DNA damage, but ERK2 mediated phosphorylation of PARP-1.
🔬 Techniques
🔭 Microscopes
✨ Fluorophores
🧪 Sample Preparation
🔬 Cell Lines
🏭 Microscope Brands
🧪 Reagent Suppliers
📷 Detectors
🏛️ Research Organizations (ROR)
Affiliated research institutions:
📋 Methods
Primary cultures of mouse cortical astrocytes and microglia were treated with TNFα and suitable signaling pathway modulators (pharmacological and molecular). Outcome measures included calcium imaging, PARP-1 activation status, NF-κB transcriptional activity, DNA damage assesment and cytokine relesease profiling.
Methods Materials PARP-1 inhibitors, 3,4-dihydro-5-[4-(1-piperidinyl)butoxy]-1(2 h)-isoquinolinone (DPQ) and N -(6-oxo-5,6-dihydrophenanthridin-2-yl)- N , N -dimethylacetamide (PJ34) were obtained from Calbiochem (San Diego, CA) and Inotek Pharmaceuticals (Lexington, MA), respectively. The MAPK inhibitor 2-(2-amino-3-methoxyphenyl)-4H-1-benzopyran-4-one (PD98059) was obtained from Tocris Cookson Ltd. (Ellisville, MO). The PLC activator, 2,4,6-trimethyl-N-[3-(trifluoromethyl)phenyl]benzenesul fonamide (m-3M3FBS) and PLC inhibitors, 1-[6-((17β-3-methoxyestra-1,3,5(10)-trien-17-yl)amino)hexyl]-1H-pyrrole-2,5-dione (U-73112) and tricyclodecane-9-yl-xanthogenate (D609) were obtained from Calbiochem. Cell culture reagents were obtained from Cellgro/Mediatech (Herndon,VI), and all other reagents were from Sigma-Aldrich (St. Louis, MO) except where otherwise stated.
Cell cultures
All animal studies were approved by the San Francisco Veterans Affairs Medical Center animal studies committee and University of Manitoba animal care and use committee, and follow the NIH guidelines for humane care of animals. Cultures were prepared from PARP-1 −/− , and wild-type (wt) mice as described previously [ 14 ]. The PARP-1 −/− mice were descendants of the 129S-Adprtl tmlZqw strain, originally developed by Wang et al. [ 32 ] and obtained from the Jackson Laboratory (Bar Harbor, ME). These mice were outbred for seven generations with wt CD-1 mice, and wt CD-1 mice were used as controls for the PARP-1 −/− mice. Astrocyte cultures were prepared from 1-day old mouse pups of both sexes in 24-well plates as described previously [ 33 ]. At confluency, microglia were harvested by gently shaking and re-plated at density of 5 × 10 5 cells/well on a 24-well plate [ 14 ]. The microglia cultures were subsequently maintained in glia-conditioned medium. The confluent astrocyte cultures were treated with 22 μM cytosine β-D-arabinofuranoside for 2 days to inhibit the proliferation of remaining microglia. The astrocyte cultures were subsequently maintained in Eagle’s minimal essential medium (MEM) supplemented with 3 % fetal bovine serum (FBS). Drug incubations Studies using astrocyte cultures were initiated by replacing the culture medium with a physiologically balanced salt solution (BSS) containing 3.1 mM KCl, 134 mM NaCl, 1.2 mM CaCl 2 , 1.2 mM MgSO 4 , 0.5 mM KH 2 PO 4 , 15.7 mM NaHCO 3 , and 2 mM glucose, pre-equilibrated to pH 7.2 in a 5 % CO 2 atmosphere. Drugs were prepared as concentrated stock solutions in BSS. Experiments were performed at 37 °C in a 5 % CO 2 atmosphere and were terminated by complete medium exchange and replacement with fresh BSS. Studies with microglial cultures were performed identically but used MEM rather than BSS. Immunostaining Fixation and immunostaining of cell cultures was performed as previously described [ 14 ]. For detection of poly(ADP-ribose), incubations were performed with a 1:1000 dilution of rabbit anti-poly(ADP-ribose) (Trevigen, Gaithersburg, MD, Cat# 4336-BPC) at 4 °C for 24 h, followed by incubation with Alexa Fluor 594-conjugated anti-rabbit IgG (Molecular Probes, Eugene, OR), 1:500 dilution, for 2 h at room temperature. For evaluation of NF-κB p65 subunit translocation, incubations were performed with a 1:30 dilution of rabbit polyclonal anti- p65 (Cell Signaling Technology, Inc., Danvers, MA, Cat# 3987) at 4 °C for 24 h, followed by incubation with Alexa Fluor 594-conjugated anti-rabbit IgG (Molecular Probes, Eugene, OR), 1:500 dilution for 2 h. In some studies, the cells were subsequently incubated with 2 μg/ml propidium iodide for 5 min to obtain nuclear counterstaining. Confocal photomicrographs of astrocytes were obtained with a Zeiss LSM 510 META with a dual-PMT detector and a 32-channel META detector and Zeiss AIM imaging software. Microglia images were obtained with standard epifluorescence microscopy because these cells could not be cultured in a resting state on glass coverslips. Controls prepared in the absence of primary antibody showed no staining under the conditions described (not shown). DNA strand breaks were detected by DNA-polymerase I-mediated biotin-dATP nick translation (PANT) [ 34 ]. Cultures were permeabilized in 1 % Triton X-100 in phosphate buffered saline (PBS) for 30 min, and endogenous peroxidase was quenched with 2 % hydrogen peroxide. The cultures were then incubated for 90 min with the PANT reaction mixture: 5 mM MgCl2, 10 mM 2-mercaptoethanol, 20 μg/ml bovine serum albumin, 30 μM dGTP, 30 μM dCTP, 30 μM dTTP, 1 μM dATP, 29 μM biotinylated dATP, and 40 U/ml of DNA-polymerase I in PBS, pH 7.4. The biotinylated areas of DNA strand breaks were visualized by subsequent incubation with streptavidin-horseradish peroxidase and DAB peroxidase substrate. Controls incubated with PANT reaction mixture without DNA-polymerase I showed no staining. siRNA downregulation of ERK1/2 Astrocytes were incubated with siRNA transfection complexes at day 10 in vitro, at which time they are 95 % confluent. siRNA incubations were performed with RNAiFect reagents (Qiagen Inc., CA) according to the manufacturer’s instructions and as previously described [ 35 ]. The culture medium of each well was replaced with 400 μl of transfection complex mixture containing 1 μg of ERK1 siRNA or 3 μg of ERK2 siRNA and 6 μl of RNAiFect in optiMEM. The siRNA sense sequence for ERK1 was 5′ ACAAGCGCAUCACAGUAGAtt 3′ and for ERK2 was 5′ CAAAGUUCGAGUUGCUAUCtt 3′ (Ambion Inc, TX, USA). Controls were prepared with 3 μg of a mismatch sequence lacking significant homology to any known mouse gene sequences. The siRNA complexes were removed after 6 h and replaced with culture medium. Four days later when cultures were used for experiments, the percentage of siRNA-induced reduction in ERK1 and ERK2 expressions was determined by quantitating the ERK band size in ERK siRNA vs. mismatch siRNA transfected cultures in both ctrl and TNFα conditions.
Show full methods section
Primary cultures of mouse cortical astrocytes and microglia were treated with TNFα and suitable signaling pathway modulators (pharmacological and molecular). Outcome measures included calcium imaging, PARP-1 activation status, NF-κB transcriptional activity, DNA damage assesment and cytokine relesease profiling.
Methods Materials PARP-1 inhibitors, 3,4-dihydro-5-[4-(1-piperidinyl)butoxy]-1(2 h)-isoquinolinone (DPQ) and N -(6-oxo-5,6-dihydrophenanthridin-2-yl)- N , N -dimethylacetamide (PJ34) were obtained from Calbiochem (San Diego, CA) and Inotek Pharmaceuticals (Lexington, MA), respectively. The MAPK inhibitor 2-(2-amino-3-methoxyphenyl)-4H-1-benzopyran-4-one (PD98059) was obtained from Tocris Cookson Ltd. (Ellisville, MO). The PLC activator, 2,4,6-trimethyl-N-[3-(trifluoromethyl)phenyl]benzenesul fonamide (m-3M3FBS) and PLC inhibitors, 1-[6-((17β-3-methoxyestra-1,3,5(10)-trien-17-yl)amino)hexyl]-1H-pyrrole-2,5-dione (U-73112) and tricyclodecane-9-yl-xanthogenate (D609) were obtained from Calbiochem. Cell culture reagents were obtained from Cellgro/Mediatech (Herndon,VI), and all other reagents were from Sigma-Aldrich (St. Louis, MO) except where otherwise stated.
Cell cultures
All animal studies were approved by the San Francisco Veterans Affairs Medical Center animal studies committee and University of Manitoba animal care and use committee, and follow the NIH guidelines for humane care of animals. Cultures were prepared from PARP-1 −/− , and wild-type (wt) mice as described previously [ 14 ]. The PARP-1 −/− mice were descendants of the 129S-Adprtl tmlZqw strain, originally developed by Wang et al. [ 32 ] and obtained from the Jackson Laboratory (Bar Harbor, ME). These mice were outbred for seven generations with wt CD-1 mice, and wt CD-1 mice were used as controls for the PARP-1 −/− mice. Astrocyte cultures were prepared from 1-day old mouse pups of both sexes in 24-well plates as described previously [ 33 ]. At confluency, microglia were harvested by gently shaking and re-plated at density of 5 × 10 5 cells/well on a 24-well plate [ 14 ]. The microglia cultures were subsequently maintained in glia-conditioned medium. The confluent astrocyte cultures were treated with 22 μM cytosine β-D-arabinofuranoside for 2 days to inhibit the proliferation of remaining microglia. The astrocyte cultures were subsequently maintained in Eagle’s minimal essential medium (MEM) supplemented with 3 % fetal bovine serum (FBS). Drug incubations Studies using astrocyte cultures were initiated by replacing the culture medium with a physiologically balanced salt solution (BSS) containing 3.1 mM KCl, 134 mM NaCl, 1.2 mM CaCl 2 , 1.2 mM MgSO 4 , 0.5 mM KH 2 PO 4 , 15.7 mM NaHCO 3 , and 2 mM glucose, pre-equilibrated to pH 7.2 in a 5 % CO 2 atmosphere. Drugs were prepared as concentrated stock solutions in BSS. Experiments were performed at 37 °C in a 5 % CO 2 atmosphere and were terminated by complete medium exchange and replacement with fresh BSS. Studies with microglial cultures were performed identically but used MEM rather than BSS. Immunostaining Fixation and immunostaining of cell cultures was performed as previously described [ 14 ]. For detection of poly(ADP-ribose), incubations were performed with a 1:1000 dilution of rabbit anti-poly(ADP-ribose) (Trevigen, Gaithersburg, MD, Cat# 4336-BPC) at 4 °C for 24 h, followed by incubation with Alexa Fluor 594-conjugated anti-rabbit IgG (Molecular Probes, Eugene, OR), 1:500 dilution, for 2 h at room temperature. For evaluation of NF-κB p65 subunit translocation, incubations were performed with a 1:30 dilution of rabbit polyclonal anti- p65 (Cell Signaling Technology, Inc., Danvers, MA, Cat# 3987) at 4 °C for 24 h, followed by incubation with Alexa Fluor 594-conjugated anti-rabbit IgG (Molecular Probes, Eugene, OR), 1:500 dilution for 2 h. In some studies, the cells were subsequently incubated with 2 μg/ml propidium iodide for 5 min to obtain nuclear counterstaining. Confocal photomicrographs of astrocytes were obtained with a Zeiss LSM 510 META with a dual-PMT detector and a 32-channel META detector and Zeiss AIM imaging software. Microglia images were obtained with standard epifluorescence microscopy because these cells could not be cultured in a resting state on glass coverslips. Controls prepared in the absence of primary antibody showed no staining under the conditions described (not shown). DNA strand breaks were detected by DNA-polymerase I-mediated biotin-dATP nick translation (PANT) [ 34 ]. Cultures were permeabilized in 1 % Triton X-100 in phosphate buffered saline (PBS) for 30 min, and endogenous peroxidase was quenched with 2 % hydrogen peroxide. The cultures were then incubated for 90 min with the PANT reaction mixture: 5 mM MgCl2, 10 mM 2-mercaptoethanol, 20 μg/ml bovine serum albumin, 30 μM dGTP, 30 μM dCTP, 30 μM dTTP, 1 μM dATP, 29 μM biotinylated dATP, and 40 U/ml of DNA-polymerase I in PBS, pH 7.4. The biotinylated areas of DNA strand breaks were visualized by subsequent incubation with streptavidin-horseradish peroxidase and DAB peroxidase substrate. Controls incubated with PANT reaction mixture without DNA-polymerase I showed no staining. siRNA downregulation of ERK1/2 Astrocytes were incubated with siRNA transfection complexes at day 10 in vitro, at which time they are 95 % confluent. siRNA incubations were performed with RNAiFect reagents (Qiagen Inc., CA) according to the manufacturer’s instructions and as previously described [ 35 ]. The culture medium of each well was replaced with 400 μl of transfection complex mixture containing 1 μg of ERK1 siRNA or 3 μg of ERK2 siRNA and 6 μl of RNAiFect in optiMEM. The siRNA sense sequence for ERK1 was 5′ ACAAGCGCAUCACAGUAGAtt 3′ and for ERK2 was 5′ CAAAGUUCGAGUUGCUAUCtt 3′ (Ambion Inc, TX, USA). Controls were prepared with 3 μg of a mismatch sequence lacking significant homology to any known mouse gene sequences. The siRNA complexes were removed after 6 h and replaced with culture medium. Four days later when cultures were used for experiments, the percentage of siRNA-induced reduction in ERK1 and ERK2 expressions was determined by quantitating the ERK band size in ERK siRNA vs. mismatch siRNA transfected cultures in both ctrl and TNFα conditions.
Lentivirus NF-κB reporter gene transfection
The lentivirus NF-κB reporter gene construct (pLenti-kB-dEGFP) has a destabilized enhanced green fluorescent protein (dEGFP) construct under the control of five tandem repeats of κB-enhancer elements specific for p65and a plain TATA box [ 36 ]. Transfections were performed as previously described [ 15 ]. Astrocytes were infected with the Lenti-κB-dEGFP 4–5 days before experiments. EGFP expression was evaluated 1 and 24 h after exposure to TNFα by counting EGFP-expressing cells from five random fields within each culture well. TNFR1 inhibition Cells were incubated with 100 μg/ml of TNFR1 neutralizing antibody (anti-mouse CD120a, Affymetrix eBioscience, San Diego, CA, Cat#16-1202) or control IgG (Armenian hamster IgG, Affymetrix eBioscience, San Diego, CA, Cat#16-4888) in MEM for 4 h prior to starting the experiments.
Calcium imaging
Intracellular calcium levels were measured in astrocytes loaded with Fura-2-AM (Molecular Probes; 3 μM, 60 min). Experiments were carried out in bicarbonate-free BSS at 37 °C and buffered to pH 7.2 with 10 mM PIPES. Calcium-free BSS was prepared by omitting CaCl 2 and adding 2 mM EGTA. The change in dye fluorescence (Fura 340/380 ratio) was measured with aZeiss 200-M inverted microscope outfitted with an ORCA ER II microscope system using Openlab Improvision software. Excitation and emission wavelengths were controlled by Sutter filterwheels and shutters. Baseline values were recorded for 15–20 min prior to drug additions. At the end of each experiment, the calcium ionophore A23187-Br (10 μM) was applied to calibrate the intracellular signal. Data are presented as a change in Fura2 emission (Fura 340/380 ratio), and as a mean change in Fura 340/380 ratio during 15-, 30-, and 60-min intervals from three to four independent experiments. In each independent experiment data were acquired from six to ten cells at 90-s intervals, and at 10-s intervals in neutralizing antibody experiments. The high-affinity dye, Fura-2, was used to maximize sensitivity at low intracellular calcium concentrations, and therefore, the signal is likely saturated and underestimates the differences between Ca 2+ -free and Ca 2+ -containing medium.
Western blotting
Western blots were prepared and quantified as described [ 14 ]. Membranes were incubated with 1:1000 dilutions of rabbit anti-ERK1/2 or anti phospho-ERK1/2 (Cell Signaling Technology, Beverly, MA, Cat# 9102 and 4376), or with a 1:500 dilution of mouse monoclonal anti-poly(ADP-ribose) (Trevigen, Gaithersburg, MD, Cat# 4335-MC). After washing, the membranes were incubated for 2 h with peroxidase-conjugated anti-rabbit or anti-mouse IgG (Vector Laboratories, Burlingame, CA) diluted 1:7500. The protein bands were visualized using ECL TM WB Detection kit (Amersham-Pharmacia Biotech) and X-OMAT AR film (Kodak) or ChemiDoc MP imaging system (BioRad). To quantify protein loading, the membranes were re-probed with mouse monoclonal anti β-actin at a 1:10,000 dilutions, followed by peroxidase-conjugated anti-mouse IgG (1:10,000 dilutions). Controls performed in the absence of primary or secondary antibodies showed no signal (data not shown). Band densities were quantified with the NIH Image J program. Site-directed PARP-1 mutations The mutant PARP-1 constructs were prepared as described [ 35 ]. In short, human PARP-1 cDNA (hPARP-1, BC03754 from NIH Mammalian Gene Collection) was corrected to match the human genomic sequence at amino acid residue 762 (from alanine to valine) using Site-Directed Mutagenesis kit (Stratagene). Single (S372E) or double mutants (S372A and T373A) of these constructs were then generated and sequence-verified. PARP-1 −/− astrocytes were transfected 2 days before experiments with the PARP-1 constructs by replacing the culture medium with 300 μl of transfection complex mixture containing 0.5 μg of DNA and 1 μl of Lipofectamine 2000 (Invitrogen) in OptiMEM. The medium was replaced with culture medium 8 h after the initiation of transfection and cells were used for experiments 40 h later. The transfection efficacy of this method has been established previously by western blots detecting PARP-1 expression with a polyclonal antibody (ALX-210-302, Alexis/Enzo Life Sciences, Plymounth Meeting, PA) [ 35 ].
Cytokine assay
Cytokines were analyzed in 50-μl aliquots of cell culture medium using a Milliplex mouse multiplex immunoassay bead system according to the manufacturer’s instructions (Millipore) [ 37 ]. Samples were assayed in duplicate, and the fluorescent signal corresponding to each cytokine was measured with a BioPlex 200 system (BioRad, Hercules, CA) in parallel with known standards. Cytokine concentrations measured from culture medium were normalized to the protein content of each well as determined by the bicinchoninic assay [ 38 ].
Statistics
For cell culture studies, each “n” denotes an independent experiment, where each experiment is from a separate cell culture preparation and comprised of 3–4 parallel treatments per condition. Results are presented as a means ± standard error. Statistical significance was evaluated by one-way ANOVA followed by the Student-Newman-Keuls multiple comparison test. p values below 0.05 were considered significant.
Materials PARP-1 inhibitors, 3,4-dihydro-5-[4-(1-piperidinyl)butoxy]-1(2 h)-isoquinolinone (DPQ) and N -(6-oxo-5,6-dihydrophenanthridin-2-yl)- N , N -dimethylacetamide (PJ34) were obtained from Calbiochem (San Diego, CA) and Inotek Pharmaceuticals (Lexington, MA), respectively. The MAPK inhibitor 2-(2-amino-3-methoxyphenyl)-4H-1-benzopyran-4-one (PD98059) was obtained from Tocris Cookson Ltd. (Ellisville, MO). The PLC activator, 2,4,6-trimethyl-N-[3-(trifluoromethyl)phenyl]benzenesul fonamide (m-3M3FBS) and PLC inhibitors, 1-[6-((17β-3-methoxyestra-1,3,5(10)-trien-17-yl)amino)hexyl]-1H-pyrrole-2,5-dione (U-73112) and tricyclodecane-9-yl-xanthogenate (D609) were obtained from Calbiochem. Cell culture reagents were obtained from Cellgro/Mediatech (Herndon,VI), and all other reagents were from Sigma-Aldrich (St. Louis, MO) except where otherwise stated.
📊 Figures
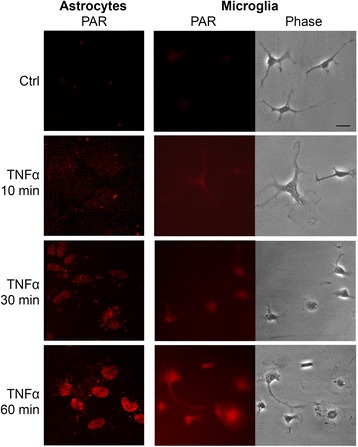
Fig. 1
TNFu03b1 induces PARP-1 activation in microglia and astrocytes. Immunostaining for poly(ADP-ribose) (labeled as PAR) shows accumulation in both astrocytes and microglia during incubation with TNFu03b1...
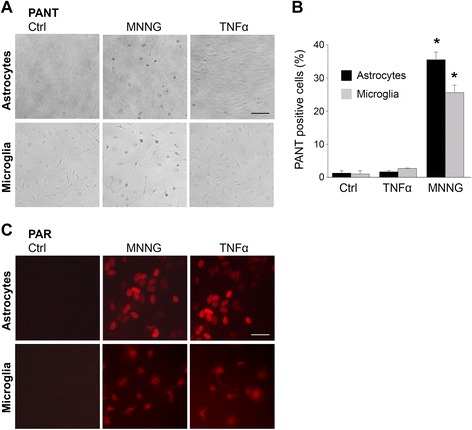
Fig. 2
TNFu03b1 does not induce detectable DNA strand breaks. a PANT staining shows no detectable increase in DNA strand breaks in either microglia or astrocyte cultures after 60-min incubation with 15u00a0n...
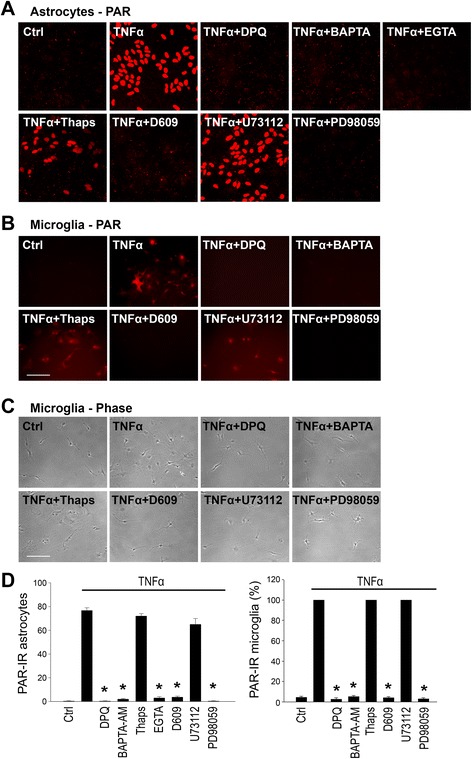
Fig. 3
TNFu03b1-induced PARP-1 activation requires PLC, Ca 2+ influx, and activation of MAPK-ERK kinase. a Astrocyte cultures were immunostained for PAR after 60-min incubations with 15u00a0ng/ml TNFu03b1. P...
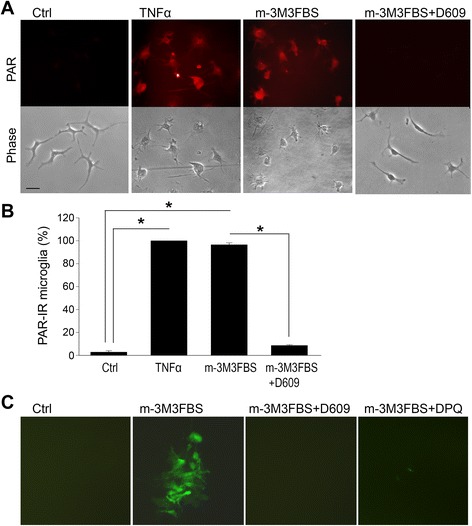
Fig. 4
PLC activation triggers microglial morphologial transformation and activation of PARP and NF-u03baB, independent of TNFu03b1. a The PLC activator m-3M3FBS (25u00a0u03bcM, 60u00a0min) induces microglia...
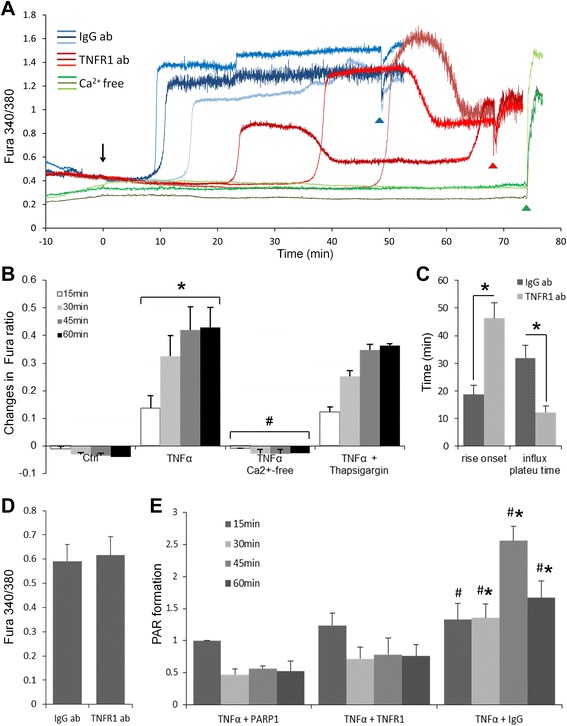
Fig. 5
TNFu03b1 induces calcium influx via TNFu03b1 receptor 1 (TNFR1). a TNFu03b1 induced increase in intracellular free Ca 2+ , as indicated by the change in Fura2 emission. This increase was blocked in Ca...
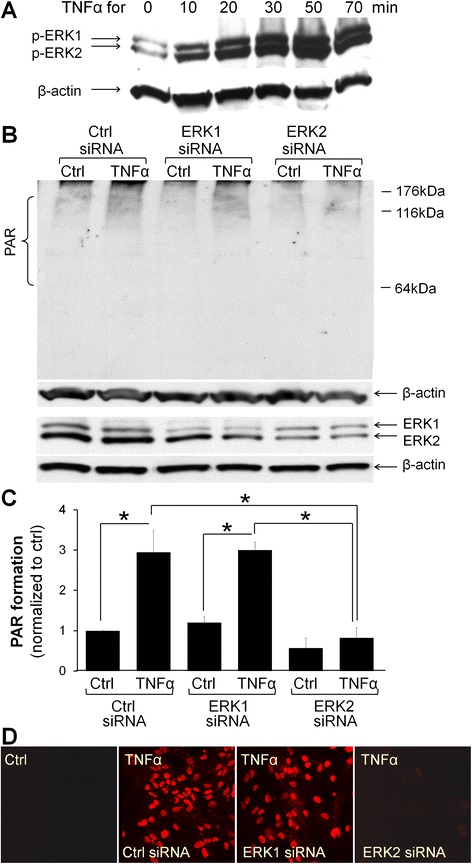
Fig. 6
TNFu03b1-induced PARP activation is regulated by ERK2. a TNFu03b1 (15u00a0ng/ml) induces ERK1/2 phosphorylation in astrocyte cultures. Representative of n =u20093. b PAR immunoblots shows that TNFu03b...
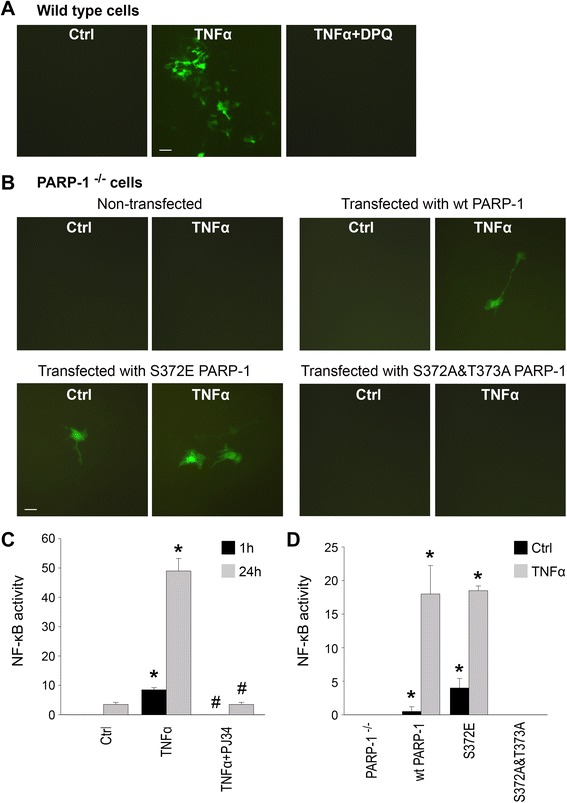
Fig. 7
ERK2-mediated phosphorylation of PARP-1 induces NF-u03baB transcriptional activity. a NF-u03baB transcriptional activity was evaluated in astrocytes transfected with a reporter gene in which dEGFP exp...
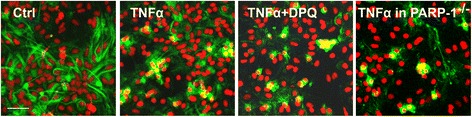
Fig. 8
PARP-1 is not required for NF-u03baB nuclear translocation. The subcellular localization of the NF-u03baB p65 subunit ( green ) was visualized by immunostaining in wt and PARP-1 u2212/u2212 astrocyte ...
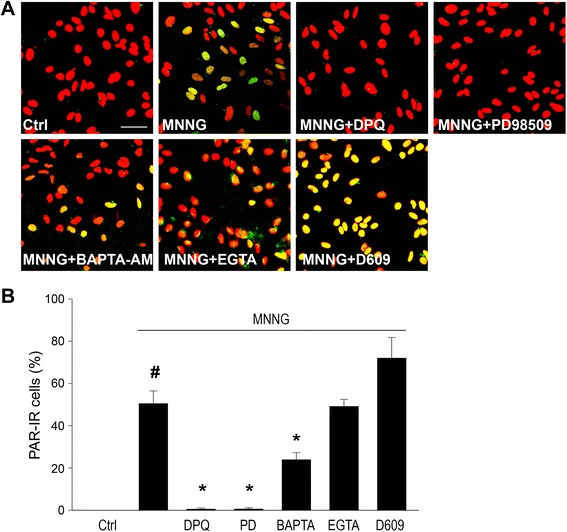
Fig. 9
PLC is not required for DNA damage-induced PARP-1 activation. a Astrocytes were immunostaining for PAR ( green ) and nuclei were counterstained with propidium iodide ( red ). PAR formation induced by ...
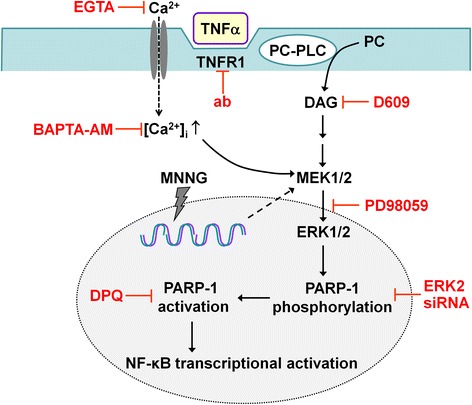
Fig. 10
The schematic summary of TNFu03b1-induced PARP-1 activation pathway in glial cells. PARP-1 activation induced by TNFu03b1 does not involve DNA damage, which is a classical inducer of PARP-1 activation...
Figure images are served from the NIH/NLM PubMed Central Open Access Subset or Europe PMC; copyright remains with the publishers and authors.
💬 Discussion
0 commentsNo comments yet. Be the first to start a discussion!
Leave a Comment