Abstract
Multiphoton excitation fluorescence microscopy (MPM) can image certain molecular processes in vivo. In the eye, fluorescent retinyl esters in subcellular structures called retinosomes mediate regeneration of the visual chromophore, 11-cis-retinal, by the visual cycle. But harmful fluorescent condensation products of retinoids also occur in the retina. We report that in wild-type mice, excitation with a wavelength of ∼730 nm identified retinosomes in the retinal pigment epithelium, and excitation with a wavelength of ∼910 nm revealed at least one additional retinal fluorophore. The latter fluorescence was absent in eyes of genetically modified mice lacking a functional visual cycle, but accentuated in eyes of older wild-type mice and mice with defective clearance of all-trans-retinal, an intermediate in the visual cycle. MPM, a noninvasive imaging modality that facilitates concurrent monitoring of retinosomes along with potentially harmful products in aging eyes, has the potential to detect early molecular changes due to age-related macular degeneration and other defects in retinoid metabolism.
🔬 Techniques
💻 Software
✨ Fluorophores
🧪 Sample Preparation
🏭 Microscope Brands
🧪 Reagent Suppliers
🔴 Lasers
📷 Detectors
🎨 Filters
💻 Software Details
🏛️ Research Organizations (ROR)
Affiliated research institutions:
📋 Methods
Mice Lrat −/− and Rpe65 −/− mice with a C57BL/6J background were crossed with C57 albino wild–type (WT) C57BL/6J– Tyr C–2J mice to produce albino Lrat −/− and Rpe65 −/− animals. Albino Abca4 −/− Rdh8 −/− double knockout mice were generated by crossing Abca4 −/− Rdh8 −/− mice with a mixed 129Sv and C57BL/6J background with 129/SvJ albino WT mice 17 , 35 . PCR genotyping of these mice was performed as previously described 17 , 35 – 37 . Animals were housed and crossbred in the Case Western Reserve University (CWRU) Animal Resource Center Facility where they were maintained under either a 12 hr light (10 lux)/dark illumination cycle or in complete darkness. Manipulations in the dark were performed under dim red light transmitted through a filter (transmittance 560 nm; No. 1 Safelight; Eastman Kodak, Rochester, NY). Mice were provided free access to a standard chow diet and water. Prior to experimental analyses they were anesthetized by intraperitoneal injection with 10 μl/g body weight of 6 mg/ml ketamine and 0.44 mg/ml xylazine, and then euthanized by cervical dislocation. All animal procedures were approved by the CWRU Animal Care and Use Committee and complied with the American Veterinary Medical Association Guidelines on Euthanasia. Mice were gavaged with 9– cis –retinyl acetate according to a previously published protocol 38 .
Retinoid and A2E Analyses
All experimental procedures related to extraction, derivatization, and separation of retinoids from dissected mouse eyes were carried out as previously described 17 , 35 . A2E was synthesized from all– trans –retinal and ethanolamine, and purified by HPLC 35 . Quantification of A2E after HPLC was accomplished by comparison with known concentrations of pure synthetic A2E standards 35 .
Multi–photon excitation microscopy
TPM imaging was done with a Leica TCS SP2. A Ti:Sapphire laser (Coherent Chameleon XR) delivered
📊 Figures
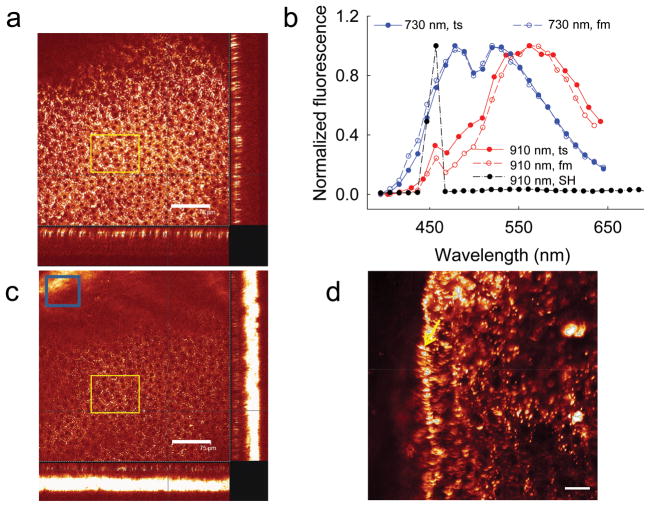
Figure 1
Multiu2013photon excitation of a 6u2013monthu2013old wild type (WT) mouse eye at 730 and 910 nm produced emission spectra indicating more than one fluorophore
( a ) A series of TPM images of an intact mouse eye were obtained along the axis perpendicular to the RPE layer with an excitation wavelength of 730 nm. The main box reveals the enface image of RPE ce...
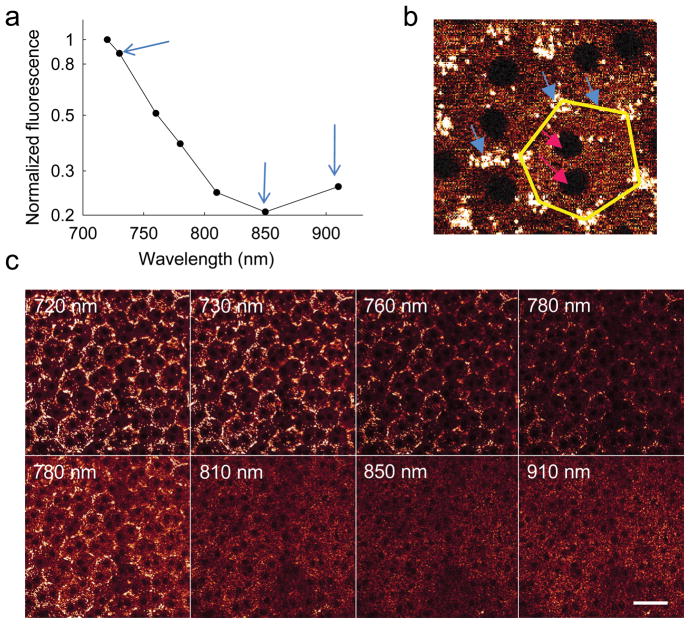
Figure 2
Multiu2013photon excitation of the RPE in an intact 6u2013monthu2013old WT mouse eye at different wavelengths of excitation light
( a ) Graph showing fluorescence as a function of excitation light wavelength. Fluorescence intensities were obtained as mean pixel values from the area covered by at least 20 RPE cells in focus and w...
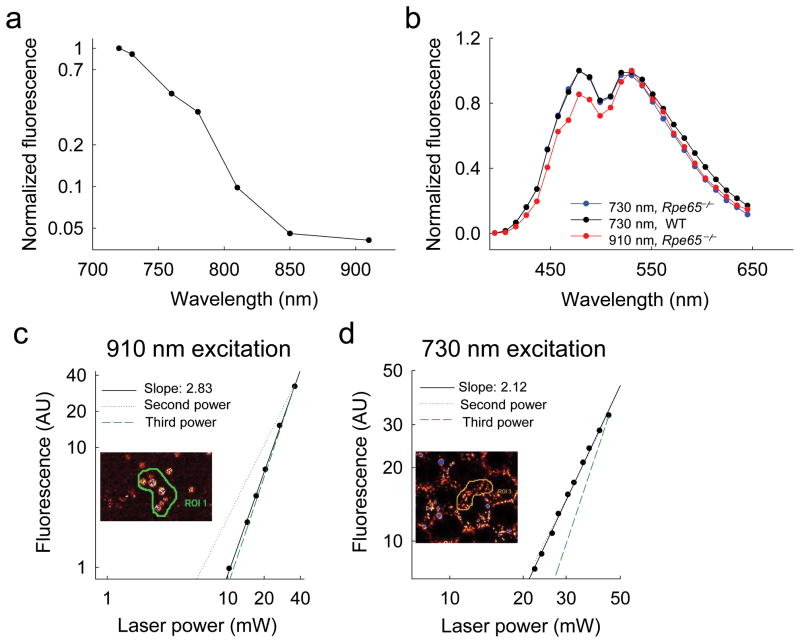
Figure 3
Visualization of retinosomes by threeu2013photon excitation spectroscopy in the intact 7u2013weeku2013old Rpe65 u2212/u2212 mouse eye
( a ) Graph showing fluorescence intensity as a function of excitation light wavelength; fluorescence intensity was calculated as a mean pixel value from the area covered by at least 20 RPE cells in f...
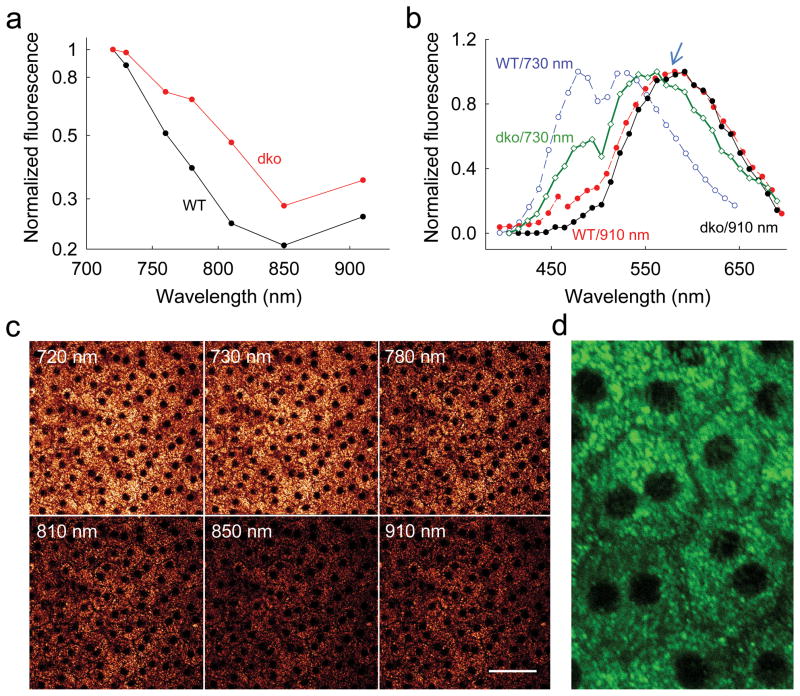
Figure 4
Twou2013photon excitation of 6u2013weeku2013old Abca4 u2212/u2212 Rdh8 u2212/u2212 (dko ) intact mouse eye
( a ) Fluorescence intensity as a function of excitation wavelength, normalized to maximum emission at 720 nm excitation. ( b ) Emission spectra from RPE of WT and dko mice excited with laser light at...
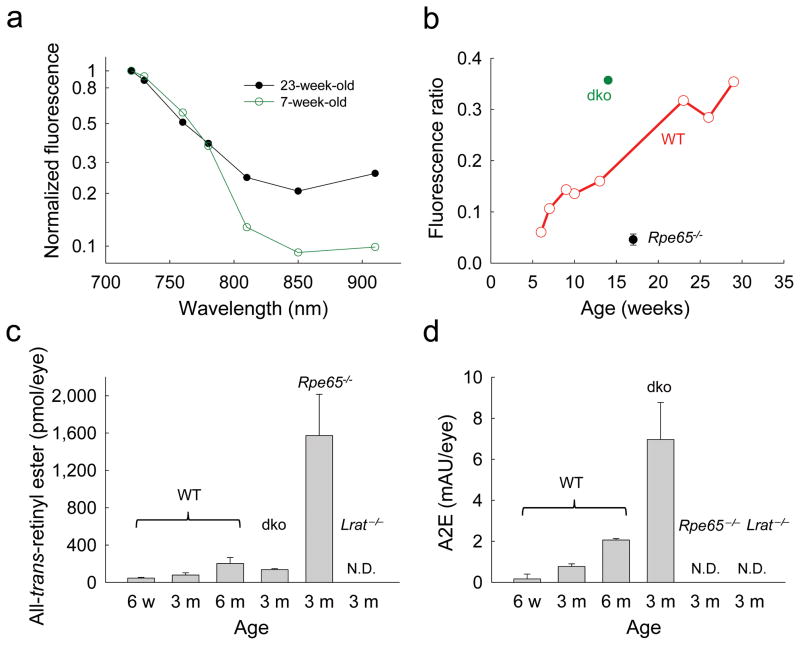
Figure 5
Ageu2013dependent changes in fluorophore accumulation in mouse eyes
( a ) Twou2013photon excitation fluorescence intensity of WT mouse retina drops with increasing wavelengths of light excitation; the decline of fluorescence emission is more rapid in younger than in o...
Figure images are served from the NIH/NLM PubMed Central Open Access Subset or Europe PMC; copyright remains with the publishers and authors.
💬 Discussion
0 commentsNo comments yet. Be the first to start a discussion!
Leave a Comment