Abstract
The causative virus of the COVID-19 pandemic, SARS-CoV-2, uses its nonstructural protein 1 (Nsp1) to suppress cellular, but not viral, protein synthesis through yet unknown mechanisms. We show here that among all viral proteins, Nsp1 has the largest impact on host viability in the cells of human lung origin. Differential expression analysis of mRNA-seq data revealed that Nsp1 broadly alters the cellular transcriptome. Our cryo-EM structure of the Nsp1-40S ribosome complex shows that Nsp1 inhibits translation by plugging the mRNA entry channel of the 40S. We also determined the structure of the 48S preinitiation complex formed by Nsp1, 40S, and the cricket paralysis virus internal ribosome entry site (IRES) RNA, which shows that it is nonfunctional because of the incorrect position of the mRNA 3' region. Our results elucidate the mechanism of host translation inhibition by SARS-CoV-2 and advance understanding of the impacts from a major pathogenicity factor of SARS-CoV-2.
🔬 Techniques
🔭 Microscopes
🧬 Organisms
💻 Software
✨ Fluorophores
🧪 Sample Preparation
🔬 Cell Lines
🏭 Microscope Brands
🧪 Reagent Suppliers
📷 Detectors
💻 Software Details
💾 Data Repositories
🏷️ Research Resource Identifiers (RRIDs)
Verified research resources used in this paper:
🏛️ Research Organizations (ROR)
Affiliated research institutions:
📋 Methods
Key Resources Table
REAGENT or RESOURCE SOURCE IDENTIFIER Antibodies Cleaved Caspase-3 (Asp175) Antibody Cell Signaling Cat#9669s; RRID: AB_2341188 Bacterial and Virus Strains E. coli BL21(DE3) Lucigen Cat#60401 E. coli XL10-Gold Ultracompetent Cells Agilent Cat#200315 One shot Stbl3 Chemical Competent cells E.coli ThermoFisher Cat#C737303 Chemicals, Peptides, and Recombinant Proteins Terrific Broth Research Products International Cat#T5100-5000.0 Luria Broth Research Products International Cat# L24400 Isopropyl β-D-1-thiogalactopyranoside (IPTG) American Bioanalytical Cat#AB00841-00010 NuPAGE LDS Sample Buffer (4X) Thermo Fisher Cat#NP0008 Dithiothreitol (DTT) American Bioanalytical Cat#AB00490-00100 SimplyBlue SafeStain Thermo Fisher Cat#LC6060 KOD Hot Start DNA polymerase Novagen Cat#710863 Rabbit 40S ribosome Lomakin and Steitz, 2013 N/A Recombinant Nsp1 This paper N/A Recombinant eIF3j This paper N/A DPBS, no calcium, no magnesium GIBCO Cat#14190250 DMEM, high glucose,pyruvate GiBCO Cat#11995065 Fetal Bovine Serum Corning Cat#35-011-CV Penicillin-Streptomycin (10,000 U/mL) GIBCO Cat#15140122 QIAquick gel extraction KIt QIAGEN Cat#28706 E-Gel Low Range Quantitative DNA Ladder ThermoFisher Cat#12373031 Gibson Assembly Master Mix NEB Cat#E2611 Phusion Flash High-Fidelity PCR Master Mix ThermoFisher Cat#F548L QIAGEN Plasmid Maxi Kit QIAGEN Cat#12162 Fixation/Permeabilization Solution Kit BD Cat#554714 FastDigest BshTI ThermoFisher Cat#FD1464 FastDigest BstXI ThermoFisher Cat#FD1024 FastDigest XhoI ThermoFisher Cat#FD0694 FastDigest KpnI ThermoFisher Cat#FD0524 CellTiter-Glo® Luminescent Cell Viability Assay Promega Cat#G7572 SF Cell Line 4D-NucleofectorTM X Kit L Lonza Cat# V4XC-2012 RNeasy Plus Mini Kit (250) QIAGEN Cat# 74136 NEBNext Ultra II Directional RNA Library Prep Kit for Illumina NEB Cat# E7760S NEBNext® Multiplex Oligos for Illumina® (Index Primers Set 1) NEB Cat# E7335S XenoLight D-Luciferin - K+ Salt Bioluminescent Substrate Perkin Elmer Cat#122799 M-MLV Reverse Transcriptase Sigma Cat# 11062603001 Deposited Data Structure of the Nsp1-40S complex This paper PDB: 7JQB Structure of the Nsp1-40S-CrPV IRES complex This paper PDB: 7JQC Cryo-EM map of the Nsp1-40S complex This paper EMD: 22432 Cryo-EM map of the Nsp1-40S-CrPV IRES complex This paper EMD: 22433 Source data and summary statistics of cellular viability effect by introduction of SARS-CoV-2 viral proteins and mutants This paper Table S2 Processed Nsp1 mRNA-seq dataset and differential expression analysis This paper Table S3 GEO/SRA accession number: PRJNA667046 DAVID pathway analysis of Nsp1 differentially expressed gene sets This paper Table S4 Experimental Models: Cell Lines H1299 ATCC ATCC® CRL-5803 VeroE6 ATCC ATCC® CRL-1586 Oligonucleotides All standard cloning primers for Gibson assembly This paper Table S1 Amplicon primers for cloning This paper Table S1 ACTB (hs01060665_g1) Thermo Fisher Cat#4331182 NSP1 Taqman Probe Invitrogen In this paper Recombinant DNA pETDUET-1 EMD Millipore Cat#71146 pMAL system New England Biolabs Cat#E8200S Plasmid: 6xHis-Nsp1 in pETDUET-1 This paper N/A Plasmid: 6xHis-MBP-Nsp1 in pMAT9S (lab-made p-MAL derivative) This paper N/A Plasmid: 6xHis-eIF3j in pETDUET-1 This paper N/A pcDNA3.1 Addgene Cat#52535 pVPSB empty This paper N/A pVPSB-ORFs This paper N/A Nsp1 mutant1 This paper N/A Nsp1 mutant3 This paper N/A Nsp1 mutant4 This paper N/A Lenti-Fluc-Puro This paper N/A Software and Algorithms Phenix (v1.18.2) Adams et al., 2010 https://www.phenix-online.org/ Coot Emsley et al., 2010 https://www2.mrc-lmb.cam.ac.uk/personal/pemsley/coot/ cryoSPARC (v2.15) Punjani et al., 2017 https://cryosparc.com/ PyMOL (v2.1) Schrödinger, LLC, 2015 https://pymol.org/2/ Chimera (v1.14) Pettersen et al., 2004 https://www.cgl.ucsf.edu/chimera/ SerialEM Mastronarde, 2005 https://bio3d.colorado.edu/SerialEM/ NanoAnalyze (v3.6.0) TA Instruments https://www.tainstruments.com/support/software-downloads-support/downloads/ Clustal Omega Sievers et al., 2011 https://www.ebi.ac.uk/Tools/msa/clustalo/ FlowJo software 9.9.6 FlowJo https://www.flowjo.com Kallisto 0.45.0 Bray et al., 2016 https://pachterlab.github.io/kallisto/ Sleuth 0.30.0 Pimentel et al., 2017 https://pachterlab.github.io/sleuth/about DAVID 6.8 Huang et al., 2009 https://david.ncifcrf.gov/ GSEA 4.0.3 Subramanian et al., 2005 https://www.gsea-msigdb.org/gsea/index.jsp Other Ni-NTA Agarose QIAGEN Cat#30230 HiTrap Q HP 5mL GE Healthcare Cat#17115401 HiLoad 16/600 Superdex 75 PG GE Healthcare Cat#28989333 NuPAGE 4-12% Bis-Tris Midi gels Invitrogen Cat#WG1403B0X Protein Concentrators PES, 100K MWCO Thermo Scientific Cat#88503 Amicon Ultra-15 Centrifugal Filter Units 10kDa Millipore Sigma Cat#UFC901024 C-flat Holey Carbon for Cryo-TEM Electron Microscopy Sciences Cat#312-50 Resource Availability Lead Contact Further information and requests for resources and reagents should be directed to and will be fulfilled by the Lead Contact, Yong Xiong ( yong.xiong@yale.edu ).
Show full methods section
Key Resources Table
REAGENT or RESOURCE SOURCE IDENTIFIER Antibodies Cleaved Caspase-3 (Asp175) Antibody Cell Signaling Cat#9669s; RRID: AB_2341188 Bacterial and Virus Strains E. coli BL21(DE3) Lucigen Cat#60401 E. coli XL10-Gold Ultracompetent Cells Agilent Cat#200315 One shot Stbl3 Chemical Competent cells E.coli ThermoFisher Cat#C737303 Chemicals, Peptides, and Recombinant Proteins Terrific Broth Research Products International Cat#T5100-5000.0 Luria Broth Research Products International Cat# L24400 Isopropyl β-D-1-thiogalactopyranoside (IPTG) American Bioanalytical Cat#AB00841-00010 NuPAGE LDS Sample Buffer (4X) Thermo Fisher Cat#NP0008 Dithiothreitol (DTT) American Bioanalytical Cat#AB00490-00100 SimplyBlue SafeStain Thermo Fisher Cat#LC6060 KOD Hot Start DNA polymerase Novagen Cat#710863 Rabbit 40S ribosome Lomakin and Steitz, 2013 N/A Recombinant Nsp1 This paper N/A Recombinant eIF3j This paper N/A DPBS, no calcium, no magnesium GIBCO Cat#14190250 DMEM, high glucose,pyruvate GiBCO Cat#11995065 Fetal Bovine Serum Corning Cat#35-011-CV Penicillin-Streptomycin (10,000 U/mL) GIBCO Cat#15140122 QIAquick gel extraction KIt QIAGEN Cat#28706 E-Gel Low Range Quantitative DNA Ladder ThermoFisher Cat#12373031 Gibson Assembly Master Mix NEB Cat#E2611 Phusion Flash High-Fidelity PCR Master Mix ThermoFisher Cat#F548L QIAGEN Plasmid Maxi Kit QIAGEN Cat#12162 Fixation/Permeabilization Solution Kit BD Cat#554714 FastDigest BshTI ThermoFisher Cat#FD1464 FastDigest BstXI ThermoFisher Cat#FD1024 FastDigest XhoI ThermoFisher Cat#FD0694 FastDigest KpnI ThermoFisher Cat#FD0524 CellTiter-Glo® Luminescent Cell Viability Assay Promega Cat#G7572 SF Cell Line 4D-NucleofectorTM X Kit L Lonza Cat# V4XC-2012 RNeasy Plus Mini Kit (250) QIAGEN Cat# 74136 NEBNext Ultra II Directional RNA Library Prep Kit for Illumina NEB Cat# E7760S NEBNext® Multiplex Oligos for Illumina® (Index Primers Set 1) NEB Cat# E7335S XenoLight D-Luciferin - K+ Salt Bioluminescent Substrate Perkin Elmer Cat#122799 M-MLV Reverse Transcriptase Sigma Cat# 11062603001 Deposited Data Structure of the Nsp1-40S complex This paper PDB: 7JQB Structure of the Nsp1-40S-CrPV IRES complex This paper PDB: 7JQC Cryo-EM map of the Nsp1-40S complex This paper EMD: 22432 Cryo-EM map of the Nsp1-40S-CrPV IRES complex This paper EMD: 22433 Source data and summary statistics of cellular viability effect by introduction of SARS-CoV-2 viral proteins and mutants This paper Table S2 Processed Nsp1 mRNA-seq dataset and differential expression analysis This paper Table S3 GEO/SRA accession number: PRJNA667046 DAVID pathway analysis of Nsp1 differentially expressed gene sets This paper Table S4 Experimental Models: Cell Lines H1299 ATCC ATCC® CRL-5803 VeroE6 ATCC ATCC® CRL-1586 Oligonucleotides All standard cloning primers for Gibson assembly This paper Table S1 Amplicon primers for cloning This paper Table S1 ACTB (hs01060665_g1) Thermo Fisher Cat#4331182 NSP1 Taqman Probe Invitrogen In this paper Recombinant DNA pETDUET-1 EMD Millipore Cat#71146 pMAL system New England Biolabs Cat#E8200S Plasmid: 6xHis-Nsp1 in pETDUET-1 This paper N/A Plasmid: 6xHis-MBP-Nsp1 in pMAT9S (lab-made p-MAL derivative) This paper N/A Plasmid: 6xHis-eIF3j in pETDUET-1 This paper N/A pcDNA3.1 Addgene Cat#52535 pVPSB empty This paper N/A pVPSB-ORFs This paper N/A Nsp1 mutant1 This paper N/A Nsp1 mutant3 This paper N/A Nsp1 mutant4 This paper N/A Lenti-Fluc-Puro This paper N/A Software and Algorithms Phenix (v1.18.2) Adams et al., 2010 https://www.phenix-online.org/ Coot Emsley et al., 2010 https://www2.mrc-lmb.cam.ac.uk/personal/pemsley/coot/ cryoSPARC (v2.15) Punjani et al., 2017 https://cryosparc.com/ PyMOL (v2.1) Schrödinger, LLC, 2015 https://pymol.org/2/ Chimera (v1.14) Pettersen et al., 2004 https://www.cgl.ucsf.edu/chimera/ SerialEM Mastronarde, 2005 https://bio3d.colorado.edu/SerialEM/ NanoAnalyze (v3.6.0) TA Instruments https://www.tainstruments.com/support/software-downloads-support/downloads/ Clustal Omega Sievers et al., 2011 https://www.ebi.ac.uk/Tools/msa/clustalo/ FlowJo software 9.9.6 FlowJo https://www.flowjo.com Kallisto 0.45.0 Bray et al., 2016 https://pachterlab.github.io/kallisto/ Sleuth 0.30.0 Pimentel et al., 2017 https://pachterlab.github.io/sleuth/about DAVID 6.8 Huang et al., 2009 https://david.ncifcrf.gov/ GSEA 4.0.3 Subramanian et al., 2005 https://www.gsea-msigdb.org/gsea/index.jsp Other Ni-NTA Agarose QIAGEN Cat#30230 HiTrap Q HP 5mL GE Healthcare Cat#17115401 HiLoad 16/600 Superdex 75 PG GE Healthcare Cat#28989333 NuPAGE 4-12% Bis-Tris Midi gels Invitrogen Cat#WG1403B0X Protein Concentrators PES, 100K MWCO Thermo Scientific Cat#88503 Amicon Ultra-15 Centrifugal Filter Units 10kDa Millipore Sigma Cat#UFC901024 C-flat Holey Carbon for Cryo-TEM Electron Microscopy Sciences Cat#312-50 Resource Availability Lead Contact Further information and requests for resources and reagents should be directed to and will be fulfilled by the Lead Contact, Yong Xiong ( yong.xiong@yale.edu ).
Material Availability
All unique/stable reagents generated in this study are available from the Lead Contact.
Data and Code Availability
All data generated or analyzed during this study are included in this article and its supplementary information files. Specifically, source data and statistics for non-high-throughput experiments are provided in a supplementary table excel file ( Table S2 ). High-throughput experiment data are provided as processed quantifications in Supplemental Datasets ( Tables S3 and S4 ). Genomic sequencing raw data are deposited to NIH Sequence Read Archive (SRA) and/or Gene Expression Omnibus (GEO) and the accession code is PRJNA667046. Constructs are available at either through a public repository or via requests to the corresponding authors. Original cell lines are available at commercial sources listed in supplementary information files. Genetically modified cell lines are available via the authors’ laboratories. Codes that support the findings of this research are being deposited to a public repository such as GitHub, and are available from the corresponding authors upon reasonable request. The cryo-EM maps of the Nsp1-40S ribosome complex and the Nsp1-40S-CrPV IRES ribosome complex have been deposited in the Electron Microscopy Data Bank as EMD-22432 and EMD-22433, respectively. The corresponding structure models are in the Protein Data Bank with accession code PDB: 7JQB , PDB: 7JQC . Additional Supplemental Items are available from Mendeley Data at https://doi.org/10.17632/642gjvx74d.1 .
Experimental Model and Subject Details
Mammalian cells H1299, H1299-PL, Vero E6, Vero E6-PL cell lines were used in the cell viability assay and the mRNA sequencing. E. coli E. coli BL21(DE3) was used for the expression of recombinant Nsp1 and eIF3j.
Method Details SARS-CoV-2 plasmid cloning
The initial cDNA templates of SARS-CoV-2 ORF gene containing plasmids were provided by Dr. Krogan as a gift ( Gordon et al., 2020 ), where the ORFs were primarily cloned into lentiviral expression vector. A non-viral expression vector, pVPSB empty, where ORFs were driven by a constitutive EFS promoter and terminated by a short poly A, was constructed by cloning gBlock fragments (IDT) into pcDNA3.1 vector (Addgene, #52535) by the Gibson assembly (NEB). All ORFs gene encoding fragments were PCR amplified from the lentiviral vectors with ORF-specific forward primers and common reverse primer that containing overlaps that corresponded to flanking sequences of the and KpnI and XhoI restriction sites in the pVPSB empty vector. The primer lists were provided in Table S1 . ORFs PCR amplified fragments were gel-purified and cloned into restriction enzyme digested backbone by the Gibson assembly (NEB). A lentiviral vector constitutively expressing a Firefly Luciferase and a puromycin mammalian selection marker (Lenti-Fluc-Puro) was generated by standard molecular cloning. All plasmids were sequenced and harvested by Maxiprep for following assay. Nsp1 mutant ORF construction Truncation mutant Nsp1 has triple stop codons introduced after residues 12 (N-terminal mutant). Nsp1 mutant3 has R124 and K125 replaced with S124 and E125 (R124S/K125E). Nsp1 mutant4 has N128 and K129 were converted to S128 and E129 (N128S/K129E). IDT gBlocks were ordered for truncated Nsp1 and different Nsp1 mutants with 19∼23 bp overlaps that corresponded to flanking sequences of the and AgeI and BstXI restriction sites in the pVPSBA01-Nsp1 plasmid. pVPSBA01-Nsp1 plasmid were digested and gel purified, and gBlocks were cloned using the Gibson assembly (NEB).
Generation of stable cell lines
Lentivirus was produced by transfection of co-transgene plasmid (Lenti-Fluc-Puro) and packaging plasmids (psPAX2, pMD2.G) into HEK293FT cells, followed by supernatant harvesting, filtering and concentration with Amicon filters (Sigma). H1299 and Vero E6 cells were infected with Lenti-Fluc-Puro lentivirus. After 24 h of virus transduction, cells were selected with 10 μg/mL puromycin, until all cells died in the control group. Luc expressing H1299 and Vero E6 that with puromycin resistance cell lines were obtained and named as H1299-PL and Vero E6-PL (Vero E6-PL for short) respectively. Mammalian cell culture H1299, H1299-PL, Vero E6, Vero E6-PL cell lines were cultured in Dulbecco’s modified Eagle’s medium (DMEM; Thermo fisher) supplemented with 10% Fetal bovine serum (FBS, Hyclone),1% penicillin-streptomycin (GIBCO), named as D10 medium. Cells were typically passaged every 1-2 days at a split ratio of 1:2 or 1:4 when the confluency reached at 80%. SARS-CoV-2 ORF mini-screen for cell viability H1299 cells were plated in white opaque walled microwell assay plates, 25,000 cells per 96 well. SARS-CoV-2 ORF plasmids, 1 μg of each, were parallelly transfected with 1 μL lipofectamine 2000, in triplicates. Cell viability was detected at every 24hr after transfection using CellTiter-Glo® Luminescent Cell Viability Assay kit (Promega). Relative viability was normalized to the mean viability of empty vector transfected control group. All procedures followed the manufacturer standard protocol. Luminescent signals were measured by a Plate Reader (PerkinElmer).
Determination of luciferase reporter cell viability H1299-PL and Vero
E6-PL cells were plated in white opaque walled microwell assay plates, 25,000 cells per well in a 96 well. SARS-CoV-2 ORF plasmids, 1 μg of each, were parallelly transfected with 1ul lipofectamine 2000. Cell viability was measured every 24 hr after plasmid transfection by adding 150 μg / ml D-Luciferin (PerkinElmer) using a multi-channel pipette. Luciferase intensity was measured by a Plate Reader (PerkinElmer). Electroporation with 4D nucleofection Cells were trypsinized and collected, 1e6 cells were resuspended in SF cell line NucleofectorTM solution with 3 μg plasmid DNA. Cells were transferred into 100 μl NucleocuvetteTM Vessel and NCI-H1299 [H1299] cell specific protocol were utilized according to the manufacturer’s protocol (4D-NucleofectorTM X Unit, Lonza). After the pulse application, 100 μL prewarmed D10 medium was added to the electroporated cells in the cuvette. Cells were gently resuspended in the cuvette and transferred into 6 well plate, cultured in incubator. Cells were collected at 24 or 48 hours later for flowcytometry assay and RNA extraction.
Apoptosis flow cytometry assay
Flow cytometry was performed using standard immunology protocols. Briefly, experimental and control cells were electroporated with respective plasmids. After a defined time point, cells were collected, fixed and permeabilized using Fixation/Permeablization Solution kit (BD). Then antigen-specific antibodies with specific dilutions were added into cells and incubated for 30 min on ice. Cells were washed with cold MACS buffer for 3 times before analyzed on a BD FACSAria cytometer. Antibody used: anti-cleaved Caspase-3(Asp175) (Sigma, 9669s, 1:200). Gene expression analysis by mRNA sequencing (mRNA-seq, RNA-seq) For H1299-PL cells electroporated with Nsp1 or Nsp1 mutant, mRNA-seq libraries were prepared following next-generation sequencing (NGS) protocols. Briefly, 1e6 H1299 cells were electroporated with 3 μg Nsp1, mutant Nsp1, and relative control plasmids. Electroporation was done in with quadruplicates for each group. Cells were collected 24hr post electroporation. Total mRNA was extracted with RNasy Plus Mini Kit (QIAGEN). 1 μg total mRNA each sample was used for the RNA-seq library preparations. A NEBNext® Ultra RNA Library Prep Kit for Illumina was employed to perform RNA-seq library preparation and samples were multiplexed using barcoded primers provided by NEBNext® Multiplex Oligos for Illumina® (Index Primers Set 1). All procedures follow the manufacturer standard protocol. Libraries were sequenced with Novaseq system (Illumina). mRNA-seq data processing, differential expression analysis and pathway analysis The mRNA data processing, transcript quantification, differential expression, and pathway analysis were performed using custom computational programs. In brief, Fastq files from mRNA-seq were used analyzed using the Kallisto quant algorithm for transcript quantification ( Bray et al., 2016 ). Differential expression analysis was performed using Sleuth ( Pimentel et al., 2017 ). Z-scores for time course heatmap were calculated by log2-normalizion of gene counts following by scaling by genes. Visualizations of differentially expressed genes such as volcano plots and heatmaps were generated using standard R packages. Differentially upregulated and downregulated genes were subjected to pathway analysis by DAVID ( Huang et al., 2007 ) and/or GSEA ( Subramanian et al., 2005 ). Processed mRNA-seq data, differential expression analysis and pathway analysis results are provided in ( Tables S3 and S4 ). RT-qPCR Total RNA was extracted from cells using RNasy Plus Mini Kit (QIAGEN). Total mRNA was reverse transcribed into cDNA by M-MLV Reverse Transcriptase (Sigma). Samples were collected in triplicates. Gene expression was quantified using Taqman Fast Universal PCR Master Mix (Thermo Fisher) and Taqman probes (Invitrogen). NSP1 probe was generated with custom designed according to the Nsp1 DNA sequence in the SARS-CoV-2 genome annotation (2019-nCoV/USA-WA1/2020, accession MN985325 ). RNA expression level was normalized to ACTB (human). Relative mRNA expression was determined via the ΔΔ C t method. Ribosome and CrPV IRES purification 40S ribosomal subunits were purified from the rabbit reticulocyte lysate (Green Hectares, USA) as described previously ( Lomakin and Steitz, 2013 ). The gene for wild-type CrPV IRES (nucleotides 6028-6240) was chemically synthesized and cloned in the pBluescript SK vector flanked at the 5′ end by a T7 promoter sequence and an EcoRI cleavage site at the 3′ end. Standard in vitro transcription protocol was used for IRES RNA synthesis and purification (MEGAscript T7 Transcription Kit, Ambion, USA). Protein construction, expression and purification Full-length SARS-CoV-2 Nsp1 was cloned into pMAT-9 s vector and pET-Duet vector for expression of MBP-tagged and 6 × his tagged proteins, respectively. The Escherichia coli BL21 (DE3) cells were used for protein expressions, which were induced by 0.5 mM isopropyl β-D-1-thiogalactopyranoside (IPTG) at 16°C for 16 hours in Terrific Broth. Cells were harvested and lysed using a microfluidizer. The lysate was clarified by centrifugation and then applied to a Ni-NTA (QIAGEN) column. Anion exchange (HiTrap Q HP, GE healthcare) chromatography was performed in a buffer of 50 mM Tris, pH 8.0 with a NaCl concentration gradient from 50 mM to 1M. Subsequent size exclusion chromatography (HiLoad Superdex 75, GE healthcare) was performed in a buffer of 50 mM Tris, 150 mM NaCl, pH 8.0. Purity of the proteins was analyzed by SDS-PAGE after each step. Full length eIF3j was expressed in Escherichia coli BL21 and purified with a similar method. Filter binding assays Rabbit 40S ribosome and binding partners (proteins or CrPV IRES RNA) were incubated together for 20 min at 37°C in a total volume of 20 μL in 1 × 48S buffer (20 mM HEPES(KOH) pH 7.5, 100 mM KCl, 2.5 mM MgAc, 1 mM DTT, 250 μM Spermidine 3HCl). Reaction mixtures were incubated for another 20 min at room temperature before diluting to 100 μL with H100 buffer (10 mM HEPES(KOH) pH 7.0, 100 mM KCl, 5 mM MgAc, 2 mM DTT). Diluted reaction mixtures were filtered through 100 kDa filter (Thermo Scientific) in 10,000 g for 5 min. The flow through was collected. 200 μL H100 buffer was used for washing the unbound proteins or RNA for 4 times before analyzing by SDS-PAGE or RNA gel. The concentration for the 40S ribosome for the filter binding assay is 1.5 μM and the Nsp1 concentration is 15 μM (ratio of 1:10). In the Nsp1 and eIF3j competition assays, the concentrations of eIF3j are 7.5 μM, 15 μM and 30 μM corresponding to ratios of 1:5, 1:10 and 1:20. The concentration of the CrPV IRES is 7.5 μM in the Nsp1-IRES binding assay (ratio of 1:5). Cryo-EM sample preparation, data collection and processing 40S ribosome and Nsp1, with or without the CrPV IRES RNA were mixed and incubated at 37°C for 20 mins to form a stable complex. The complex (4 μl) was applied to a C-Flat 2/1 3C copper grid (Electron Microscopy Sciences) pretreated by glow-discharging at 8 mA for 20 s. The grid was blotted at 20°C with 100% humidity and plunge-frozen in liquid ethane using FEI Vitrobot Mark IV (Thermo Fisher). The grids were stored in liquid nitrogen before data collection. Images were acquired on a FEI Titan Krios electron microscope (Thermo Fisher) equipped with a post-GIF Gatan K3 direct detector in super-resolution mode, at a nominal calibrated magnification of 81,000 × with the physical pixel size corresponding to 1.068Å. Automated data collection was performed using SerialEM ( Mastronarde, 2005 ). A total of 4,700 movie series were collected for the Nsp1-40S ribosome complex. 300 movies series were collected for the Nsp1-40S-CrPV IRES complex. For the Nsp1-40S ribosome complex, a defocus range of 0.5 μm to 2 μm was used. Data were collected with a dose of 15.9 electrons per pixel per second. Images were recorded over a 3.6 s exposure with 0.1 s for each frame to give a total dose of 50 electrons per Å 2 . Similar conditions were used for the Nsp1-40S-CrPV IRES complex. The same data processing procedures were carried out for both the two complexes using standard pipelines in cryoSPARC( Punjani et al., 2017 ). The final average resolution is 2.7 Å for the Nsp1-40S ribosome complex and 3.3 Å for the Nsp1-40S-CrPV IRES complex (FSC = 0.143). Local refinement was carried out for the head domain of the 40S, which significantly increased the quality of the reconstruction for this domain ( Figure S3 D).
Model building and refinement
The structure of the rabbit 40S ribosome was extracted from PDB: 4KZX ( Lomakin and Steitz, 2013 ) and 6SGC ( Chandrasekaran et al., 2019 ). The model of Nsp1 C-terminal domain was manually built in COOT ( Emsley et al., 2010 ). The CrPV IRES structure was extracted form PDB: 5IT9 and refined ( Murray et al., 2016 ). The structures of Nsp1-40S ribosome complex and Nsp1-IRES-40S ribosome complex were refined with phenix.real_space_refine module in PHENIX ( Adams et al., 2010 ). All structural figures were generated using PyMol ( Schrödinger, LLC, 2015 ) and Chimera ( Pettersen et al., 2004 ).
Quantification and Statistical Analysis Sample size determination
Sample size was determined according to the lab’s prior work or similar approaches in the field. Replication All experiments were done with at least three biological replicates. Experimental replications were indicated in detail in methods section and in each figure panel’s legend.
Standard statistical analysis
All statistical methods are described in figure legends and/or supplementary Excel tables. The P values and statistical significance were estimated for all analyses. For example, the unpaired, two-sided, t test was used to compare two groups. One-way ANOVA along with multiple comparisons test, was used to compare multiple groups. Multiple-testing correction was done using false discovery rate (FDR) method. Different levels of statistical significance were accessed based on specific p values and type I error cutoffs (0.05, 0.01, 0.001, 0.0001). Data analysis was performed using GraphPad Prism v.8. and/or RStudio.
Material Availability
All unique/stable reagents generated in this study are available from the Lead Contact.
Experimental Model and Subject Details
Mammalian cells H1299, H1299-PL, Vero E6, Vero E6-PL cell lines were used in the cell viability assay and the mRNA sequencing. E. coli E. coli BL21(DE3) was used for the expression of recombinant Nsp1 and eIF3j.
Method Details SARS-CoV-2 plasmid cloning
The initial cDNA templates of SARS-CoV-2 ORF gene containing plasmids were provided by Dr. Krogan as a gift ( Gordon et al., 2020 ), where the ORFs were primarily cloned into lentiviral expression vector. A non-viral expression vector, pVPSB empty, where ORFs were driven by a constitutive EFS promoter and terminated by a short poly A, was constructed by cloning gBlock fragments (IDT) into pcDNA3.1 vector (Addgene, #52535) by the Gibson assembly (NEB). All ORFs gene encoding fragments were PCR amplified from the lentiviral vectors with ORF-specific forward primers and common reverse primer that containing overlaps that corresponded to flanking sequences of the and KpnI and XhoI restriction sites in the pVPSB empty vector. The primer lists were provided in Table S1 . ORFs PCR amplified fragments were gel-purified and cloned into restriction enzyme digested backbone by the Gibson assembly (NEB). A lentiviral vector constitutively expressing a Firefly Luciferase and a puromycin mammalian selection marker (Lenti-Fluc-Puro) was generated by standard molecular cloning. All plasmids were sequenced and harvested by Maxiprep for following assay. Nsp1 mutant ORF construction Truncation mutant Nsp1 has triple stop codons introduced after residues 12 (N-terminal mutant). Nsp1 mutant3 has R124 and K125 replaced with S124 and E125 (R124S/K125E). Nsp1 mutant4 has N128 and K129 were converted to S128 and E129 (N128S/K129E). IDT gBlocks were ordered for truncated Nsp1 and different Nsp1 mutants with 19∼23 bp overlaps that corresponded to flanking sequences of the and AgeI and BstXI restriction sites in the pVPSBA01-Nsp1 plasmid. pVPSBA01-Nsp1 plasmid were digested and gel purified, and gBlocks were cloned using the Gibson assembly (NEB).
Generation of stable cell lines
Lentivirus was produced by transfection of co-transgene plasmid (Lenti-Fluc-Puro) and packaging plasmids (psPAX2, pMD2.G) into HEK293FT cells, followed by supernatant harvesting, filtering and concentration with Amicon filters (Sigma). H1299 and Vero E6 cells were infected with Lenti-Fluc-Puro lentivirus. After 24 h of virus transduction, cells were selected with 10 μg/mL puromycin, until all cells died in the control group. Luc expressing H1299 and Vero E6 that with puromycin resistance cell lines were obtained and named as H1299-PL and Vero E6-PL (Vero E6-PL for short) respectively. Mammalian cell culture H1299, H1299-PL, Vero E6, Vero E6-PL cell lines were cultured in Dulbecco’s modified Eagle’s medium (DMEM; Thermo fisher) supplemented with 10% Fetal bovine serum (FBS, Hyclone),1% penicillin-streptomycin (GIBCO), named as D10 medium. Cells were typically passaged every 1-2 days at a split ratio of 1:2 or 1:4 when the confluency reached at 80%. SARS-CoV-2 ORF mini-screen for cell viability H1299 cells were plated in white opaque walled microwell assay plates, 25,000 cells per 96 well. SARS-CoV-2 ORF plasmids, 1 μg of each, were parallelly transfected with 1 μL lipofectamine 2000, in triplicates. Cell viability was detected at every 24hr after transfection using CellTiter-Glo® Luminescent Cell Viability Assay kit (Promega). Relative viability was normalized to the mean viability of empty vector transfected control group. All procedures followed the manufacturer standard protocol. Luminescent signals were measured by a Plate Reader (PerkinElmer).
Determination of luciferase reporter cell viability H1299-PL and Vero
E6-PL cells were plated in white opaque walled microwell assay plates, 25,000 cells per well in a 96 well. SARS-CoV-2 ORF plasmids, 1 μg of each, were parallelly transfected with 1ul lipofectamine 2000. Cell viability was measured every 24 hr after plasmid transfection by adding 150 μg / ml D-Luciferin (PerkinElmer) using a multi-channel pipette. Luciferase intensity was measured by a Plate Reader (PerkinElmer). Electroporation with 4D nucleofection Cells were trypsinized and collected, 1e6 cells were resuspended in SF cell line NucleofectorTM solution with 3 μg plasmid DNA. Cells were transferred into 100 μl NucleocuvetteTM Vessel and NCI-H1299 [H1299] cell specific protocol were utilized according to the manufacturer’s protocol (4D-NucleofectorTM X Unit, Lonza). After the pulse application, 100 μL prewarmed D10 medium was added to the electroporated cells in the cuvette. Cells were gently resuspended in the cuvette and transferred into 6 well plate, cultured in incubator. Cells were collected at 24 or 48 hours later for flowcytometry assay and RNA extraction.
Apoptosis flow cytometry assay
Flow cytometry was performed using standard immunology protocols. Briefly, experimental and control cells were electroporated with respective plasmids. After a defined time point, cells were collected, fixed and permeabilized using Fixation/Permeablization Solution kit (BD). Then antigen-specific antibodies with specific dilutions were added into cells and incubated for 30 min on ice. Cells were washed with cold MACS buffer for 3 times before analyzed on a BD FACSAria cytometer. Antibody used: anti-cleaved Caspase-3(Asp175) (Sigma, 9669s, 1:200). Gene expression analysis by mRNA sequencing (mRNA-seq, RNA-seq) For H1299-PL cells electroporated with Nsp1 or Nsp1 mutant, mRNA-seq libraries were prepared following next-generation sequencing (NGS) protocols. Briefly, 1e6 H1299 cells were electroporated with 3 μg Nsp1, mutant Nsp1, and relative control plasmids. Electroporation was done in with quadruplicates for each group. Cells were collected 24hr post electroporation. Total mRNA was extracted with RNasy Plus Mini Kit (QIAGEN). 1 μg total mRNA each sample was used for the RNA-seq library preparations. A NEBNext® Ultra RNA Library Prep Kit for Illumina was employed to perform RNA-seq library preparation and samples were multiplexed using barcoded primers provided by NEBNext® Multiplex Oligos for Illumina® (Index Primers Set 1). All procedures follow the manufacturer standard protocol. Libraries were sequenced with Novaseq system (Illumina). mRNA-seq data processing, differential expression analysis and pathway analysis The mRNA data processing, transcript quantification, differential expression, and pathway analysis were performed using custom computational programs. In brief, Fastq files from mRNA-seq were used analyzed using the Kallisto quant algorithm for transcript quantification ( Bray et al., 2016 ). Differential expression analysis was performed using Sleuth ( Pimentel et al., 2017 ). Z-scores for time course heatmap were calculated by log2-normalizion of gene counts following by scaling by genes. Visualizations of differentially expressed genes such as volcano plots and heatmaps were generated using standard R packages. Differentially upregulated and downregulated genes were subjected to pathway analysis by DAVID ( Huang et al., 2007 ) and/or GSEA ( Subramanian et al., 2005 ). Processed mRNA-seq data, differential expression analysis and pathway analysis results are provided in ( Tables S3 and S4 ). RT-qPCR Total RNA was extracted from cells using RNasy Plus Mini Kit (QIAGEN). Total mRNA was reverse transcribed into cDNA by M-MLV Reverse Transcriptase (Sigma). Samples were collected in triplicates. Gene expression was quantified using Taqman Fast Universal PCR Master Mix (Thermo Fisher) and Taqman probes (Invitrogen). NSP1 probe was generated with custom designed according to the Nsp1 DNA sequence in the SARS-CoV-2 genome annotation (2019-nCoV/USA-WA1/2020, accession MN985325 ). RNA expression level was normalized to ACTB (human). Relative mRNA expression was determined via the ΔΔ C t method. Ribosome and CrPV IRES purification 40S ribosomal subunits were purified from the rabbit reticulocyte lysate (Green Hectares, USA) as described previously ( Lomakin and Steitz, 2013 ). The gene for wild-type CrPV IRES (nucleotides 6028-6240) was chemically synthesized and cloned in the pBluescript SK vector flanked at the 5′ end by a T7 promoter sequence and an EcoRI cleavage site at the 3′ end. Standard in vitro transcription protocol was used for IRES RNA synthesis and purification (MEGAscript T7 Transcription Kit, Ambion, USA). Protein construction, expression and purification Full-length SARS-CoV-2 Nsp1 was cloned into pMAT-9 s vector and pET-Duet vector for expression of MBP-tagged and 6 × his tagged proteins, respectively. The Escherichia coli BL21 (DE3) cells were used for protein expressions, which were induced by 0.5 mM isopropyl β-D-1-thiogalactopyranoside (IPTG) at 16°C for 16 hours in Terrific Broth. Cells were harvested and lysed using a microfluidizer. The lysate was clarified by centrifugation and then applied to a Ni-NTA (QIAGEN) column. Anion exchange (HiTrap Q HP, GE healthcare) chromatography was performed in a buffer of 50 mM Tris, pH 8.0 with a NaCl concentration gradient from 50 mM to 1M. Subsequent size exclusion chromatography (HiLoad Superdex 75, GE healthcare) was performed in a buffer of 50 mM Tris, 150 mM NaCl, pH 8.0. Purity of the proteins was analyzed by SDS-PAGE after each step. Full length eIF3j was expressed in Escherichia coli BL21 and purified with a similar method. Filter binding assays Rabbit 40S ribosome and binding partners (proteins or CrPV IRES RNA) were incubated together for 20 min at 37°C in a total volume of 20 μL in 1 × 48S buffer (20 mM HEPES(KOH) pH 7.5, 100 mM KCl, 2.5 mM MgAc, 1 mM DTT, 250 μM Spermidine 3HCl). Reaction mixtures were incubated for another 20 min at room temperature before diluting to 100 μL with H100 buffer (10 mM HEPES(KOH) pH 7.0, 100 mM KCl, 5 mM MgAc, 2 mM DTT). Diluted reaction mixtures were filtered through 100 kDa filter (Thermo Scientific) in 10,000 g for 5 min. The flow through was collected. 200 μL H100 buffer was used for washing the unbound proteins or RNA for 4 times before analyzing by SDS-PAGE or RNA gel. The concentration for the 40S ribosome for the filter binding assay is 1.5 μM and the Nsp1 concentration is 15 μM (ratio of 1:10). In the Nsp1 and eIF3j competition assays, the concentrations of eIF3j are 7.5 μM, 15 μM and 30 μM corresponding to ratios of 1:5, 1:10 and 1:20. The concentration of the CrPV IRES is 7.5 μM in the Nsp1-IRES binding assay (ratio of 1:5). Cryo-EM sample preparation, data collection and processing 40S ribosome and Nsp1, with or without the CrPV IRES RNA were mixed and incubated at 37°C for 20 mins to form a stable complex. The complex (4 μl) was applied to a C-Flat 2/1 3C copper grid (Electron Microscopy Sciences) pretreated by glow-discharging at 8 mA for 20 s. The grid was blotted at 20°C with 100% humidity and plunge-frozen in liquid ethane using FEI Vitrobot Mark IV (Thermo Fisher). The grids were stored in liquid nitrogen before data collection. Images were acquired on a FEI Titan Krios electron microscope (Thermo Fisher) equipped with a post-GIF Gatan K3 direct detector in super-resolution mode, at a nominal calibrated magnification of 81,000 × with the physical pixel size corresponding to 1.068Å. Automated data collection was performed using SerialEM ( Mastronarde, 2005 ). A total of 4,700 movie series were collected for the Nsp1-40S ribosome complex. 300 movies series were collected for the Nsp1-40S-CrPV IRES complex. For the Nsp1-40S ribosome complex, a defocus range of 0.5 μm to 2 μm was used. Data were collected with a dose of 15.9 electrons per pixel per second. Images were recorded over a 3.6 s exposure with 0.1 s for each frame to give a total dose of 50 electrons per Å 2 . Similar conditions were used for the Nsp1-40S-CrPV IRES complex. The same data processing procedures were carried out for both the two complexes using standard pipelines in cryoSPARC( Punjani et al., 2017 ). The final average resolution is 2.7 Å for the Nsp1-40S ribosome complex and 3.3 Å for the Nsp1-40S-CrPV IRES complex (FSC = 0.143). Local refinement was carried out for the head domain of the 40S, which significantly increased the quality of the reconstruction for this domain ( Figure S3 D).
Model building and refinement
The structure of the rabbit 40S ribosome was extracted from PDB: 4KZX ( Lomakin and Steitz, 2013 ) and 6SGC ( Chandrasekaran et al., 2019 ). The model of Nsp1 C-terminal domain was manually built in COOT ( Emsley et al., 2010 ). The CrPV IRES structure was extracted form PDB: 5IT9 and refined ( Murray et al., 2016 ). The structures of Nsp1-40S ribosome complex and Nsp1-IRES-40S ribosome complex were refined with phenix.real_space_refine module in PHENIX ( Adams et al., 2010 ). All structural figures were generated using PyMol ( Schrödinger, LLC, 2015 ) and Chimera ( Pettersen et al., 2004 ).
Supplemental Information Document S1. Figures S1–S6 Table S1. Oligo Sequences Used in This Study, Related to Figure 1 Table S2. Source Data and Summary Statistics of Cellular Viability Effect by Introduction of SARS-CoV-2 Viral Proteins and Mutants, Related to Figure 1 Table S3. Processed Nsp1 mRNA-Seq Dataset and Differential Expression Analysis, Related to Figure 2 Table S3.1. TPM table of Nsp1 mRNA-seq dataset Table S3.2.
Differential expression
Nsp1 versus Vector Control Table S3.3. Differential expression Nsp1 Mutant versus Vector Control Table S3.4.
Differential expression
Nsp1 versus Nsp1 Mutant Table S4. DAVID Pathway Analysis of Nsp1 Differentially Expressed Gene Sets, Related to Figure 2 Table S4.1. Functional clustering of Nsp1 versus Vector Control highly downregulated genes (q < 1e−30) Table S4.2. Functional clustering of Nsp1 versus Nsp1 Mutant highly downregulated genes (q < 1e−30) Table S4.3. Functional clustering of Nsp1 versus Vector Control highly upregulated genes (q < 1e−30) Table S4.4. Functional clustering of Nsp1 versus Nsp1 Mutant highly upregulated genes (q < 1e−30) Table S4.5 Biological processes enrichment of Nsp1 versus Vector Control highly downregulated genes (q < 1e−30) Table S4.6 Biological processes enrichment of Nsp1 versus Nsp1 Mutant highly downregulated genes (q < 1e−30) Table S4.7 Biological processes enrichment of Nsp1 versus Vector Control highly upregulated genes (q < 1e−30) Table S4.8 Biological processes enrichment of Nsp1 versus Nsp1 Mutant highly upregulated genes (q < 1e−30) Table S4.9 Gene list of Nsp1 versus Vector Control highly downregulated genes (q < 1e−30) Table S4.10 Gene list enrichment of Nsp1 versus Nsp1 Mutant highly downregulated genes (q < 1e−30) Table S4.11 Gene list enrichment of Nsp1 versus Vector Control highly upregulated genes (q < 1e−30) Table S4.12 Gene list enrichment of Nsp1 versus Nsp1 Mutant highly upregulated genes (q < 1e−30) Table S4.13 Gene list of Nsp1 versus Vector Control all downregulated genes (q < 0.01) Table S4.14 Gene list of Nsp1 versus Vector Control all upregulated genes (q < 0.01) Document S2. Article plus Supplemental Information
📊 Figures
Figureu00a01
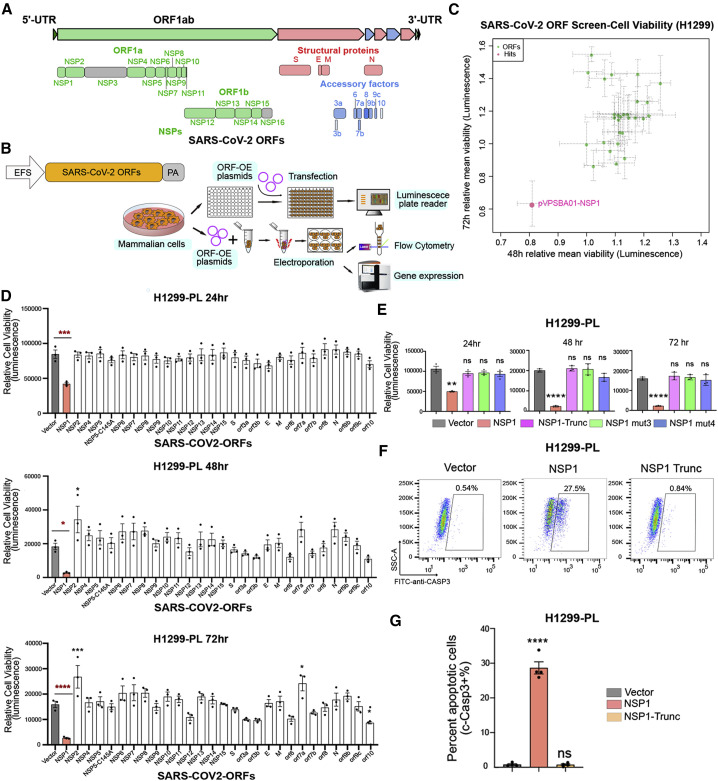
SARS-CoV-2 ORF Mini-screen Identified Nsp1 as a Key Viral Protein with Host Cell Viability Effect (A) Schematics of viral protein coding frames along SARS-CoV-2 genome. Colored ORFs indicate the ones ...
Figureu00a02
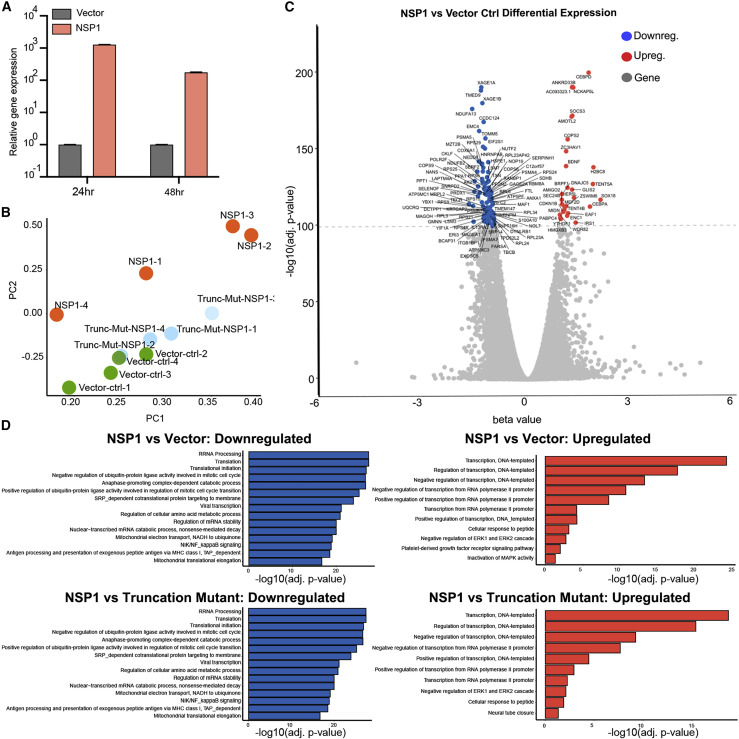
Transcriptome Profiling of H1299 Cells Introduced with NSP1 and NSP1 Truncation Mutant by RNA-Seq (A) Quantitative PCR (qPCR) confirmation of NSP1 overexpression, at 24 and 48u00a0h post-electroporati...
Figureu00a03
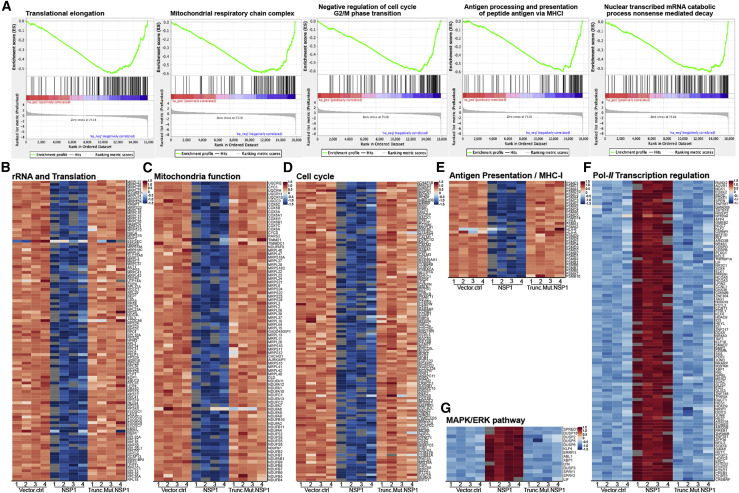
Highly Differentially Expressed Genes between Nsp1, Vector Control, and Nsp1 Mutant Group in the Context of Top Major Enriched Pathways (A) Gene set enrichment plots of representative enriched pathway...
Figureu00a04
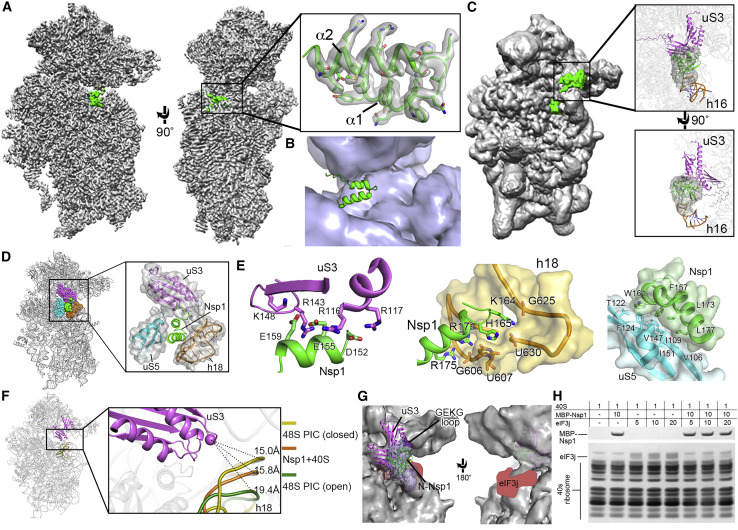
Cryo-EM Structure of the Nsp1-40S Ribosome Complex (A) Overall density of the Nsp1-40S ribosome complex with Nsp1 (green) and 40S ribosome (gray). Inset shows C-Nsp1 with corresponding density with cl...
Figureu00a05
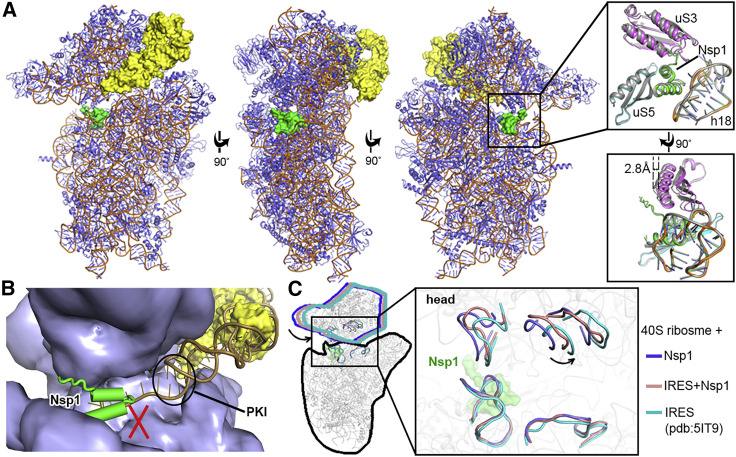
Nsp1 Prevents Physiological Conformation of the 48S PIC (A) Overall structure of the Nsp1-40S-CrPV IRES complex. Nsp1 (green) and IRES (yellow) are presented in surface. The ribosome proteins (slate) ...
Figure images are served from the NIH/NLM PubMed Central Open Access Subset or Europe PMC; copyright remains with the publishers and authors.
💬 Discussion
0 commentsNo comments yet. Be the first to start a discussion!
Leave a Comment