Abstract
Single Molecule Localization super-resolution Microscopy (SMLM) has become a powerful tool to study cellular architecture at the nanometer scale. In SMLM, single fluorophore labels are made to repeatedly switch on and off ("blink"), and their exact locations are determined by mathematically finding the centers of individual blinks. The image quality obtainable by SMLM critically depends on efficacy of blinking (brightness, fraction of molecules in the on-state) and on preparation longevity and labeling density. Recent work has identified several combinations of bright dyes and imaging buffers that work well together. Unfortunately, different dyes blink optimally in different imaging buffers, and acquisition of good quality 2- and 3-color images has therefore remained challenging. In this study we describe a new imaging buffer, OxEA, that supports 3-color imaging of the popular Alexa dyes. We also describe incremental improvements in preparation technique that significantly decrease lateral- and axial drift, as well as increase preparation longevity. We show that these improvements allow us to collect very large series of images from the same cell, enabling image stitching, extended 3D imaging as well as multi-color recording.
🔬 Techniques
🔭 Microscopes
🧬 Organisms
💻 Software
✨ Fluorophores
🧪 Sample Preparation
🔬 Cell Lines
🏭 Microscope Brands
🧪 Reagent Suppliers
📷 Detectors
🎨 Filters
💻 Software Details
💾 Data Repositories
🏛️ Research Organizations (ROR)
Affiliated research institutions:
📋 Methods
Cell culture
Ultra-clean coverslips were prepared by acid/base rinsing as follows: first, nr 1.5 coverslips (Thermo Fisher Scientific, Waltham, USA) were washed in 2M HCl overnight, followed by a 2-hour wash in 2M NaOh and an additional wash in 20% H 3 PO 4 . Inbetween those steps, coverslips were briefly rinsed with double-distilled H 2 O. Storage until further use was in ethanol. For imaging, immortalized Human Vascular Endothelial Cells EC-RF24 [ 21 ] or PA-JEB/β4 keratinocytes [ 22 ] (were seeded on either ultra clean coverslips or Wilco well glass bottom dishes (Amsterdam, The Netherlands) optimized for SR ( GWSB-3512-N ). The latter dishes we found to be clean enough for SR imaging without the need for acid/base rinsing. EC-RF24 cells were grown in Medium 200 ( M-200-500 , Thermo Fisher Scientific) with the addition of Low Serum Growth Supplement ( LSGS , Thermo Fisher Scientific, Waltham, USA) until they reached 50% confluency and then fixed with 10% MeS buffer (100 mM MeS, pH 6.9, 1 mM EGTA and 1 mM MgCl 2 ) and 90% methanol for 5 min on ice. PA-JEB/β4 cells were fixed with glutaraldehyde to preserve actin structure (incubation with 0.3% glutaraldehyde + 0.25% Triton in a buffer containing 10 mM MES pH 6.1, 150 mM NaCl, 5 mM EGTA and 5 mM MgCl 2 ) for 2 min, followed by 10 min fixation in 0.5% glutaraldehyde in the same buffer (no Triton present). Subsequently, the sample was treated with freshly prepared 0.1% NaBH 4 for 10 min. After blocking with 5% Bovine Serum Albumin (BSA; Serva, Heidelberg, Germany) for 1 hour, cells were stained as follows. For EC-RF24 cells were incubated with mouse anti-vimentin monoclonal antibodies (code No. M 0725 Clone V9, Dako, Heverlee, Belgium). Subsequently all the cells were incubated with goat anti-mouse antibodies (Alexa-488, Alexa-647, Alexa-555, Alexa-532 or FITC, Thermo Fisher Scientific) at a final concentration of 0.01 mg/ml for 30 minutes. For PA-JEB/β4 cells staining was with rabbit anti-keratin 14 polyclonal antibody (Covance, Princeton, USA), rat anti-β4 (BD biosciences, Breda, The Netherlands) and Phalloidin conjugated to Alexa Fluor 647 fluorophores (Invitrogen). Samples were incubated with goat anti-rabbit and goat anti-rat secondary antibodies labeled with Alexa-488 and Alexa-555 fluorophores (Invitrogen) afterwards. All the fixation and staining steps were done at room temperature. The Coverslips were mounted in a holder (Chamlide CMB mounting ring CM-B25-1, Live Cell Instrument, Seoul, South Korea) filled with 500 μl of imaging buffer (see below). After mounting the preparation on the microscope, we waited for ~15 min in order for the preparation to stabilize before starting imaging. In experiments aimed at assessing buffer quality, this waiting time was skipped and any drift was compensated for in software. For imaging in O 2 -tight sealed Willco Wells (OTC), first the glass bottom was covered with ~ 100 μl of Gloxy buffer. A rinsed coverslip was placed as a lid on the top of the well using a tweezer, taking care to avoid inclusion of air bubbles in the imaging medium. Then the excess buffer was dried carefully, and pieces of black non-reflective aluminum tape T205-1.0—AT205 (THORLABs Inc, Newton, New Jersey, USA) were applied in a partly overlapping manner and carefully pressed down to seal the preparation.
Show full methods section
Cell culture
Ultra-clean coverslips were prepared by acid/base rinsing as follows: first, nr 1.5 coverslips (Thermo Fisher Scientific, Waltham, USA) were washed in 2M HCl overnight, followed by a 2-hour wash in 2M NaOh and an additional wash in 20% H 3 PO 4 . Inbetween those steps, coverslips were briefly rinsed with double-distilled H 2 O. Storage until further use was in ethanol. For imaging, immortalized Human Vascular Endothelial Cells EC-RF24 [ 21 ] or PA-JEB/β4 keratinocytes [ 22 ] (were seeded on either ultra clean coverslips or Wilco well glass bottom dishes (Amsterdam, The Netherlands) optimized for SR ( GWSB-3512-N ). The latter dishes we found to be clean enough for SR imaging without the need for acid/base rinsing. EC-RF24 cells were grown in Medium 200 ( M-200-500 , Thermo Fisher Scientific) with the addition of Low Serum Growth Supplement ( LSGS , Thermo Fisher Scientific, Waltham, USA) until they reached 50% confluency and then fixed with 10% MeS buffer (100 mM MeS, pH 6.9, 1 mM EGTA and 1 mM MgCl 2 ) and 90% methanol for 5 min on ice. PA-JEB/β4 cells were fixed with glutaraldehyde to preserve actin structure (incubation with 0.3% glutaraldehyde + 0.25% Triton in a buffer containing 10 mM MES pH 6.1, 150 mM NaCl, 5 mM EGTA and 5 mM MgCl 2 ) for 2 min, followed by 10 min fixation in 0.5% glutaraldehyde in the same buffer (no Triton present). Subsequently, the sample was treated with freshly prepared 0.1% NaBH 4 for 10 min. After blocking with 5% Bovine Serum Albumin (BSA; Serva, Heidelberg, Germany) for 1 hour, cells were stained as follows. For EC-RF24 cells were incubated with mouse anti-vimentin monoclonal antibodies (code No. M 0725 Clone V9, Dako, Heverlee, Belgium). Subsequently all the cells were incubated with goat anti-mouse antibodies (Alexa-488, Alexa-647, Alexa-555, Alexa-532 or FITC, Thermo Fisher Scientific) at a final concentration of 0.01 mg/ml for 30 minutes. For PA-JEB/β4 cells staining was with rabbit anti-keratin 14 polyclonal antibody (Covance, Princeton, USA), rat anti-β4 (BD biosciences, Breda, The Netherlands) and Phalloidin conjugated to Alexa Fluor 647 fluorophores (Invitrogen). Samples were incubated with goat anti-rabbit and goat anti-rat secondary antibodies labeled with Alexa-488 and Alexa-555 fluorophores (Invitrogen) afterwards. All the fixation and staining steps were done at room temperature. The Coverslips were mounted in a holder (Chamlide CMB mounting ring CM-B25-1, Live Cell Instrument, Seoul, South Korea) filled with 500 μl of imaging buffer (see below). After mounting the preparation on the microscope, we waited for ~15 min in order for the preparation to stabilize before starting imaging. In experiments aimed at assessing buffer quality, this waiting time was skipped and any drift was compensated for in software. For imaging in O 2 -tight sealed Willco Wells (OTC), first the glass bottom was covered with ~ 100 μl of Gloxy buffer. A rinsed coverslip was placed as a lid on the top of the well using a tweezer, taking care to avoid inclusion of air bubbles in the imaging medium. Then the excess buffer was dried carefully, and pieces of black non-reflective aluminum tape T205-1.0—AT205 (THORLABs Inc, Newton, New Jersey, USA) were applied in a partly overlapping manner and carefully pressed down to seal the preparation.
Imaging
Samples were imaged on a Leica SR-GSD microscope (Leica Microsystems, Wetzlar, Germany) equipped with 488 nm/300 mW, 532 nm/500 mW and 642 nm/500 mW lasers and an EMCCD camera (Ixon DU-897, Andor). We used a 160x oil immersion dedicated SR objective. For three-dimensional images the Leica astigmatic lens was used. Between 10.000 to 100.000 frames were collected at 100 Hz with image size of 180×180 or 400×400 pixels. The data sets were analyzed with the Image J ThunderSTORM analysis module [ 23 ] and images were reconstructed with a detection threshold of 200 photons, options sub pixel localization of molecules and uncertainty correction checked, with a rendering pixel size of 10 nm.
Software drift correction
(ThunderSTORM) was applied, using either the image cross-correlation algorithm (Nr of bins = 10; magnification = 5), or alternatively, by using fiducial markers, for which sub-resolution fluorescent beads were included in the preparation. For multi-color images, first Alexa-647 was imaged, followed by Alexa-488 (using a 500/30 band-pass filter to prevent leak-through of Alexa-555). After Alexa-488 was largely bleached due to long-term imaging the third channel (Alexa-555 or Alexa-532) was imaged. Series of raw blinking images were first subjected to running-median background subtraction [ 24 ]using an in-house developed Image J macro. All images where further corrected for chromatic aberrations. Composition of the imaging buffers OxEA 50 mM β-MercaptoEthylamine hydrochloride (MEA, Sigma-Aldrich) 3% (v/v) OxyFlour ™ (Oxyrase Inc., Mansfield, Ohio, U.S.A.) 20% (v/v) of sodium DL-lactate solution (L1375, Sigma-Aldrich) in PBS, pH adjusted to 8–8.5 with NaOH Gloxy buffer 50 mM β-MercaptoEthylamine hydrochloride (MEA, Sigma-Aldrich) 10% (v/v) of a 250 g/l solution of glucose 0.5 mg/ml glucose oxidase 40 mg/ml catalase (Sigma-Aldrich) in PBS, pH 7.6 MEA buffer 50 mM β-MercaptoEthylamine hydrochloride (MEA, Sigma-Aldrich) in PBS All buffers were prepared freshly in 500 μl aliquots before imaging unless otherwise noted in the text. According to the supplier, repeated freezing/thawing is detrimental to Oxyrase solutions. For pH buffering, we prefer phosphate buffers over HEPES buffers (because of the unfavorable redox behavior of HEPES) or TRIS buffers (unfavorable pKa because it should give maximal protection against acidification in Gloxy).
Analysis of blinking characteristics
Assessment of dye blinking properties was carried out as follows. Series of raw images were background-corrected and analyzed using ThunderSTORM with default settings, except: magnification = 10x to obtain final pixel size of 10 nm. Result files (*.csv) where then subjected to drift correction (using either a self-written Image J macro or the ThunderSTORM build-in drift correction option) and blinks present in consecutive frames were merged in 2D (maximum distance = 20 nm, maximum off-frames = 1). For analysis of blinking brightness ( Fig 5B ) 100,000 blinks were averaged per movie in SPSS statistical software. Data are average +/- SEM from 3–15 individual experiments for each condition, using different batches of buffers and on at least 2 days of experimentation. Analysis of the number of blinks per frame ( Fig 5C and 5D ) was based on comma-separated value (.csv) files corrected as indicated above, using a home-written analysis routine in Visual Basic.net to calculate total number of blinks in blocks of 1000 raw frames. Visualization of blink duration ( Fig 5E ) was by manually drawing small ROI around blinks in a given frame, followed by plotting intensity in the ROI in frames -50 to +50 with respect to the given frame using Image J option. We note that it is not trivial to determine these blinking properties precisely because the relevant properties are not necessarily independent. For example, the presence of significant structured background in Gloxy buffer may result in an underestimation of the number of detected blinks per frame in the first part of the time-series. For that reason, we have refrained from statistical testing of the observed differences.
Quantification of preparation drift
For quantification of drift, we first quantitated stability of the Leica GSDIM microscope with SuMo Stage using 0.4 μm fluorescent TetraSpeck microspheres (Invitrogen, Waltham, Mas., USA) immobilized on thick preparation slides and embedded in Mowiol. For drift measurements in imaging chambers, beads were immobilized to the glass coverslip by air-drying a diluted solution. In all cases, mean displacement away from the origin was determined using an Image J macro to find the center of intensity in each of the beads and then averaged over all beads in the image. After an initial stabilization period of 15 min, images were collected every second for the duration of one hour at low intensity excitation. Drift was expressed in nm/min and total (accumulated) drift was also calculated for a period of 30 min and for 60 min. During these experiments the room was kept closed because we observed that draft may significantly degrade stability.
Detection of dissolved Oxygen levels
Dissolved oxygen levels were measured using a calibrated FireSting O 2 meter (PyroScience, Aachen, Germany) according to the manufacturers guidelines. We used OXSP5 sensor pads which work both in dry and submersed condition. In the experiments for Fig 7B , sensor pads were stuck to the dish, then wetted and covered with either Twinsil of adhesive-backed aluminum tape. Dishes with sealed sensors were then filled with water. Continuous O 2 measurements were started from the submerged sensor pads and after about 10 minutes, oxygen scavenger (either Gloxy or 50 mM of NaSO 3 ) was added.
Supporting Information S1 Fig Alexa-532 brightness increases with acidification. Shown are the average photon count per blink of Alexa-532 (red) and the buffer pH recorded during 3 hours of ageing in Gloxy buffer. Note that the ongoing drop in pH increases the brightness of Alexa-532 by almost two-fold. (TIF) Click here for additional data file. S1 Movie Zoom-in on a stitched image covering the keratin cytoskeleton of a HUVEC cell. The image is constructed from eight individual SR images consisting of >20,000 frames each. Images were acquired consecutively; zoom-in is on the last acquired image. (AVI) Click here for additional data file.
📊 Figures
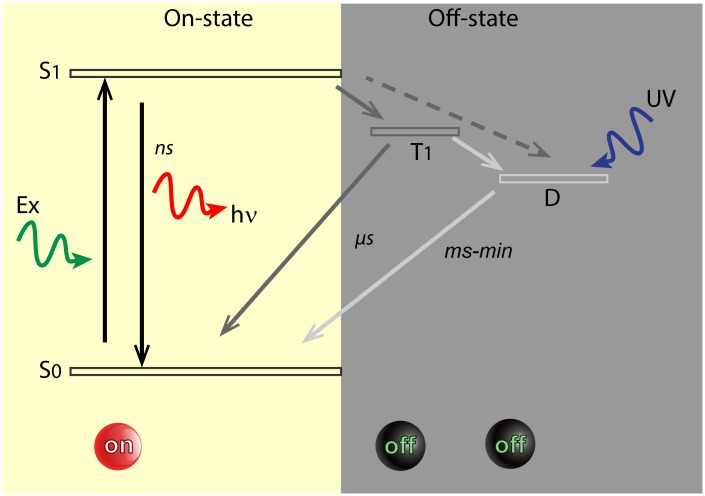
Fig 1
Minimal Jablonski diagram of fluorophore blinking.
Simplified Jablonski diagram showing molecular states essential to STORM/GSDIM. For simplicity, neither vibrational levels nor possible additional dark states have been indicated. In the bright On-sta...
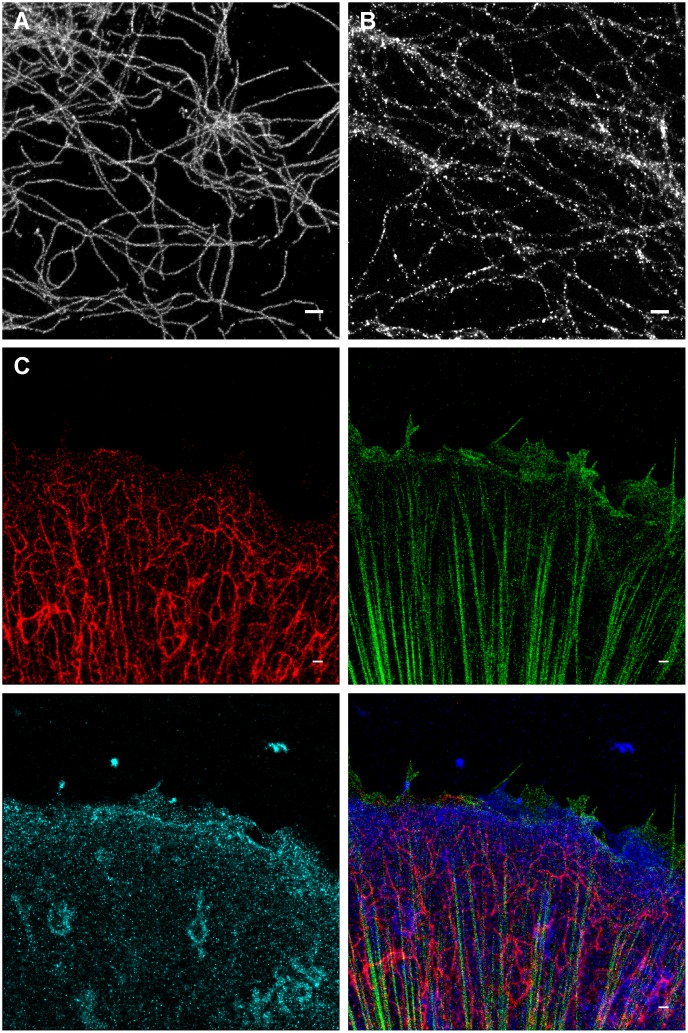
Fig 2
GSDIM imaging in OxEA buffer.
(A) comparison of image quality in ageing Gloxy buffer (right) to that in OxEA buffer (left). Images of Ab-labeled vimentin intermediate filaments were collected ~ 2 hours after mounting the preparati...
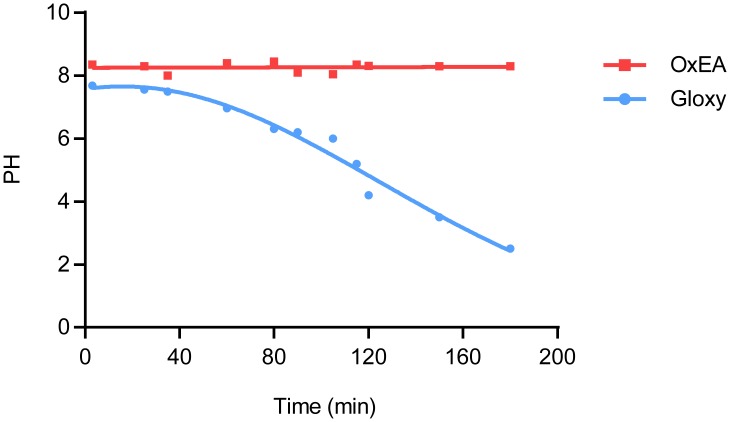
Fig 3
pH in OxEA and Gloxy buffer.
The pH in open dishes filled with 0.5 ml of OxEA (red squares) or Gloxy buffer (blue circles) is graphed at the indicated time points. Note the steep drop in pH in Gloxy buffer, which limits imaging t...
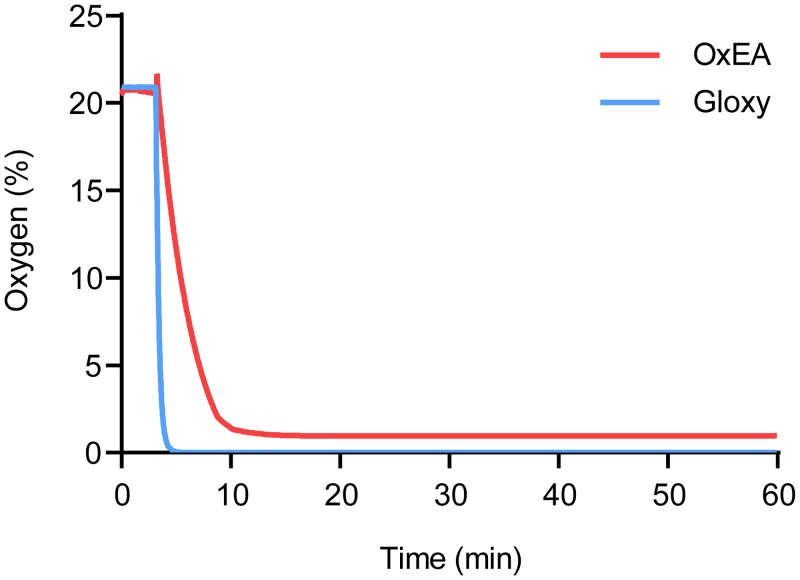
Fig 4
Oxygen levels in OxEA and Gloxy buffers.
O 2 levels were detected every two seconds using a FireSting fluorescence-lifetime based oxygen detector. Note that addition of Gloxy buffer (blue) causes a rapid drop in O 2 level to undetectable lev...
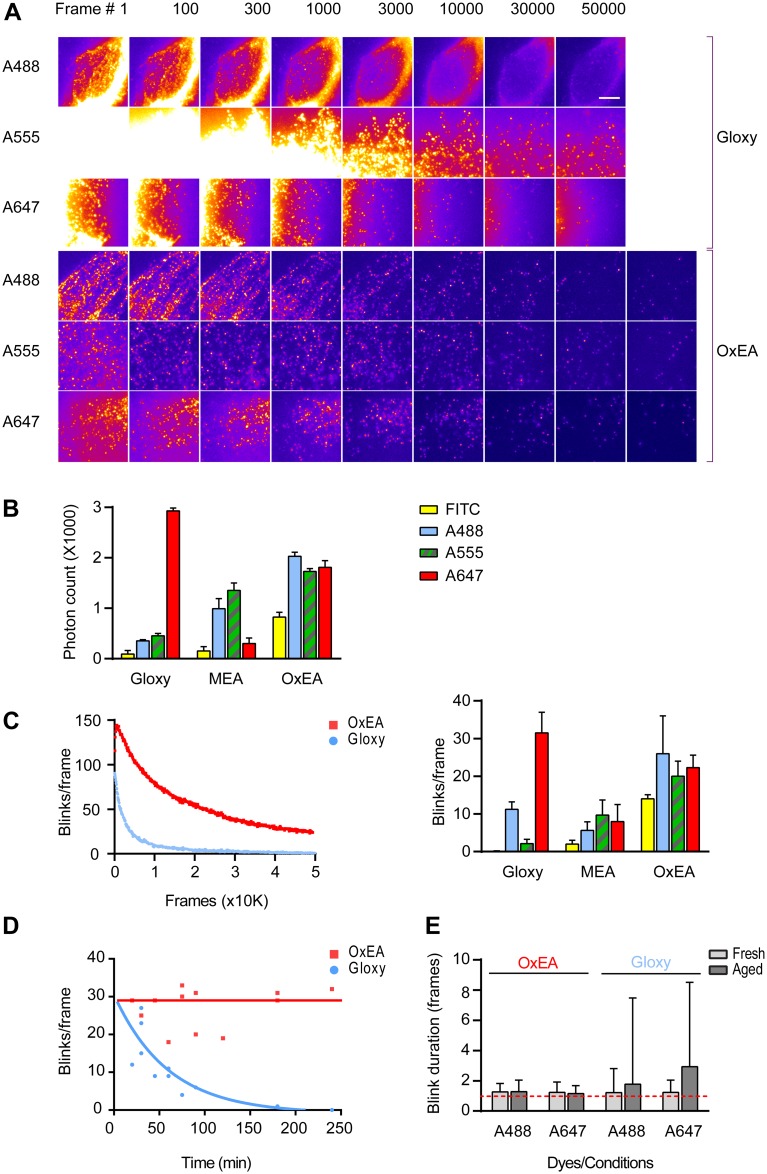
Fig 5
Characterization of blinking in OxEA, Gloxy and MEA buffer.
(A) Raw blinking frames (10 ms each, i.e. non-merged results) taken at the indicated time points. Shown are data for Alexa-488 (A488), Alexa-555 (A555) and Alexa-647 (A647) in both fresh Gloxy and OxE...
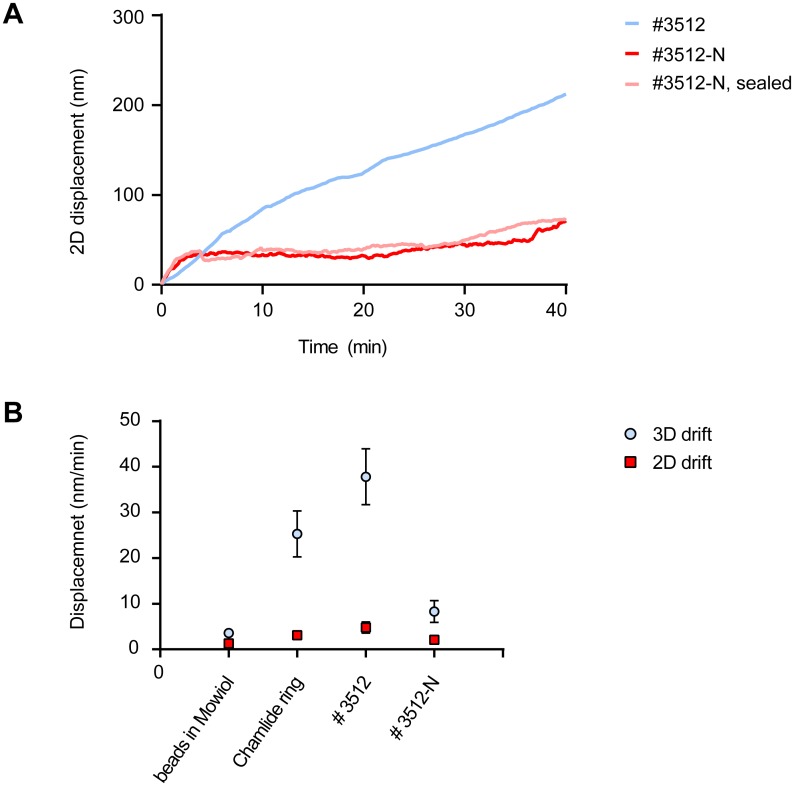
Fig 6
Optimizing drift in SR preparations.
(A) Example traces of drift quantifications during 30 min in #3512 dishes (blue), #3512-N dishes (red) and #3512-N dishes sealed with coverslip and adhesive-backed aluminum tape (pink). Shown is the m...
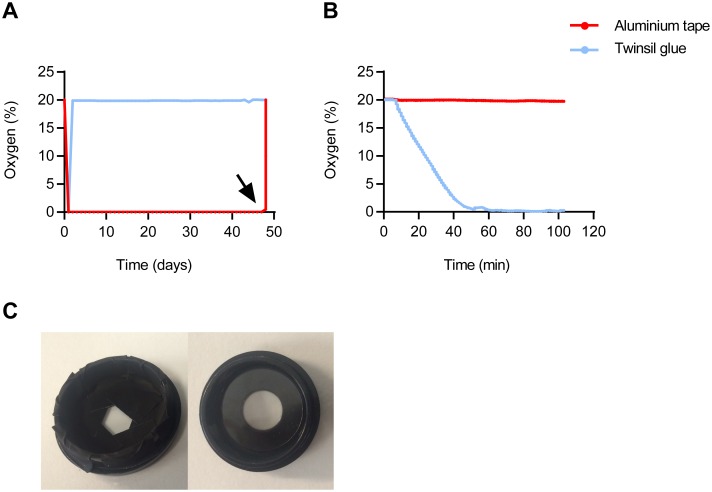
Fig 7
Sealing cell culture dishes to prevent oxygen influx.
(A) O 2 levels, detected by daily fluorescence lifetime-based recording in a WillCo Well sealed with Twinsil glue (blue) or aluminum tape (red), respectively. At 48 days, the seal was broken to test r...
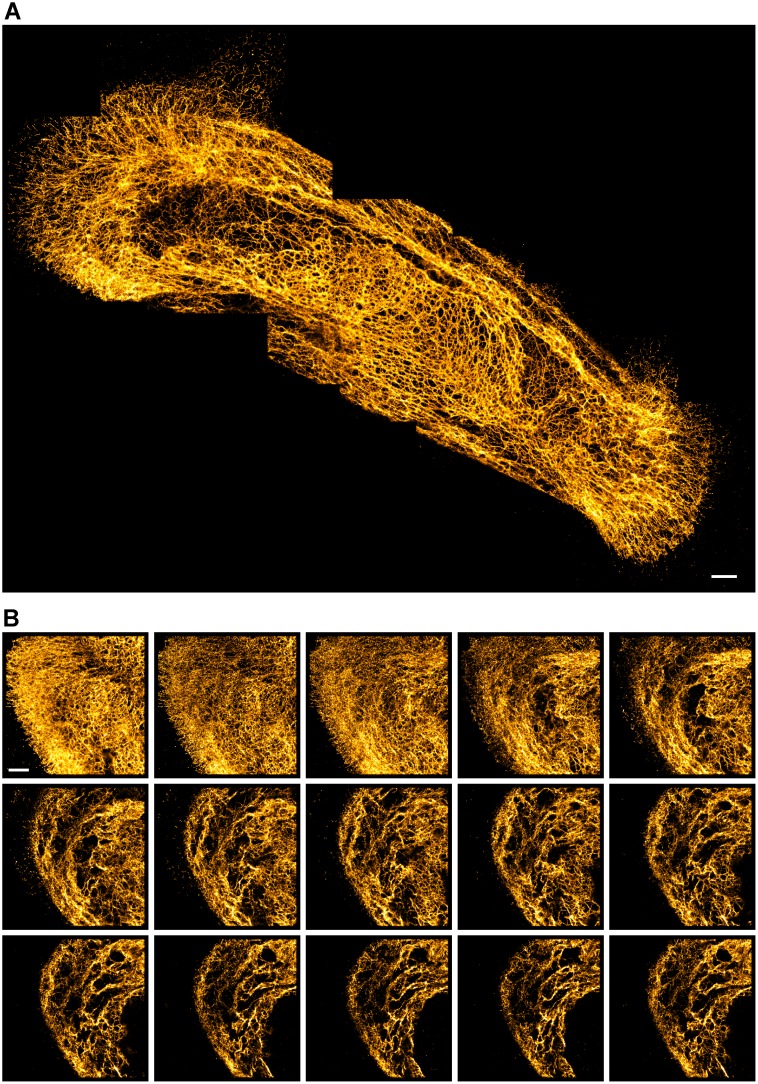
Fig 8
OTC enables near-unlimited blinking of Alexa-647.
(A) Stitched image, composited of eight 1800x1800 pixel images (each based on 20k raw blinking images) showing the keratin cytoskeleton in a HUVEC cell. Despite partly overlapping acquisition areas, a...
Figure images are served from the NIH/NLM PubMed Central Open Access Subset or Europe PMC; copyright remains with the publishers and authors.
💬 Discussion
0 commentsNo comments yet. Be the first to start a discussion!
Leave a Comment