Abstract
Abstract Cytoskeletal mechanics regulates cell morphodynamics and many physiological processes. While contractility is known to be largely RhoA-dependent, the process by which localized biochemical signals are translated into cell-level responses is poorly understood. Here we combine optogenetic control of RhoA, live-cell imaging and traction force microscopy to investigate the dynamics of actomyosin-based force generation. Local activation of RhoA not only stimulates local recruitment of actin and myosin but also increased traction forces that rapidly propagate across the cell via stress fibres and drive increased actin flow. Surprisingly, this flow reverses direction when local RhoA activation stops. We identify zyxin as a regulator of stress fibre mechanics, as stress fibres are fluid-like without flow reversal in its absence. Using a physical model, we demonstrate that stress fibres behave elastic-like, even at timescales exceeding turnover of constituent proteins. Such molecular control of actin mechanics likely plays critical roles in regulating morphodynamic events.
🔬 Techniques
🔭 Microscopes
💻 Software
✨ Fluorophores
🧪 Sample Preparation
🔬 Cell Lines
🏭 Microscope Brands
🧪 Reagent Suppliers
📷 Detectors
🔎 Objectives
💻 Software Details
💾 Data Repositories
🏛️ Research Organizations (ROR)
Affiliated research institutions:
📋 Methods
Cell culture and transfection NIH 3T3 fibroblasts (American Type Culture Collection, Manassas, VA) were cultured in DMEM media (Mediatech, Herndon, VA) and supplemented with 10% foetal bovine serum (HyClone; ThermoFisher Scientific, Hampton, NH), 2 mM L-glutamine (Invitrogen, Caarlsbad, CA) and penicillin–streptomycin (Invitrogen). Zyxin (−/−) and zyxin (−/−) +EGFP-zyxin mouse embryonic fibroblast cells were a gift of Mary Beckerle's laboratory (University of Utah, Salt Lake City, UT) and cultured similarly to the NIH 3T3 fibroblasts 59 . Cells were tested for mycoplasma and were free of contamination. All cells were transiently transfected via electroporation 24 h before experiment using a Neon Transfection system (ThermoFisher Scientific). Following transfection, cells were plated on glass coverslips and imaged the next day.
Drug treatments
Cells were treated with either the 10 μM SMIFH2, a pan-formin inhibitor 38 , or 1 μM of Y-27632, which inhibits ROCK (ThermoFisher Scientific), for at least 30 min before imaging.
Plasmids
The optogenetic membrane tether consisting of Stargazin-GFP-LOVpep and prGEF constructs used are previously described 6 . prGEF-YFP was constructed in an identical manner to prGEF with YFP replacing mCherry. This construct was used in experiments where the effects on various downstream markers were visualized. To examine effects on the actin and myosin networks, we used mApple-Actin and mApple-MLC constructs (gifts from M Davidson, University of Florida, Gainesville FL), mCherry-Vinculin (gift from V Weaver, University of California at San Francisco, San Francisco, CA) and mCherry-zyxin (gift from M Beckerle, University of Utah, Salt Lake City, UT).
Show full methods section
Cell culture and transfection NIH 3T3 fibroblasts (American Type Culture Collection, Manassas, VA) were cultured in DMEM media (Mediatech, Herndon, VA) and supplemented with 10% foetal bovine serum (HyClone; ThermoFisher Scientific, Hampton, NH), 2 mM L-glutamine (Invitrogen, Caarlsbad, CA) and penicillin–streptomycin (Invitrogen). Zyxin (−/−) and zyxin (−/−) +EGFP-zyxin mouse embryonic fibroblast cells were a gift of Mary Beckerle's laboratory (University of Utah, Salt Lake City, UT) and cultured similarly to the NIH 3T3 fibroblasts 59 . Cells were tested for mycoplasma and were free of contamination. All cells were transiently transfected via electroporation 24 h before experiment using a Neon Transfection system (ThermoFisher Scientific). Following transfection, cells were plated on glass coverslips and imaged the next day.
Drug treatments
Cells were treated with either the 10 μM SMIFH2, a pan-formin inhibitor 38 , or 1 μM of Y-27632, which inhibits ROCK (ThermoFisher Scientific), for at least 30 min before imaging.
Plasmids
The optogenetic membrane tether consisting of Stargazin-GFP-LOVpep and prGEF constructs used are previously described 6 . prGEF-YFP was constructed in an identical manner to prGEF with YFP replacing mCherry. This construct was used in experiments where the effects on various downstream markers were visualized. To examine effects on the actin and myosin networks, we used mApple-Actin and mApple-MLC constructs (gifts from M Davidson, University of Florida, Gainesville FL), mCherry-Vinculin (gift from V Weaver, University of California at San Francisco, San Francisco, CA) and mCherry-zyxin (gift from M Beckerle, University of Utah, Salt Lake City, UT).
Live cell imaging
Glass coverslips were placed in a Chamlide magnetic chamber (Live Cell Instrument, Seoul, Korea) in culture media supplemented with 10 mM HEPES and 30 μl ml −1 Oxyrase (Oxyrase Inc., Mansfield, OH) and maintained at 37 °C. Cells were imaged on an inverted Nikon Ti-E microscope (Nikon, Melville, NY) with a Yokogawa CSU-X confocal scanhead (Yokogawa Electric, Tokyo, Japan) and laser merge module containing 491, 561 and 642 nm laser lines (Spectral Applied Research, Ontario, Canada). Images were collected on either a CoolSNAP HQ2 CCD (Roper Scientific, Trenton, NJ) or Zyla 4.2 sCMOS Camera (Andor, Belfast, UK). Local recruitment using the optogenetic probe was performed using a 405 nm laser coupled to a Mosaic digital micromirror device (Andor). Images were collected using a 60 × 1.49 NA ApoTIRF oil immersion objective (Nikon). All hardware was controlled using the MetaMorph Automation and Image Analysis Software (Molecular Devices, Sunnyvale, CA). Unless otherwise stated, cells were imaged in the 561 channel every 20 s for 45 min, with the first 15 min used to determine the steady state of the system, the second 15 min to perform local recruitment and the final 15 min to record any recovery. During recruitment, a local region drawn in MetaMorph was illuminated by the 405 nm laser for 960 ms at a power
📊 Figures
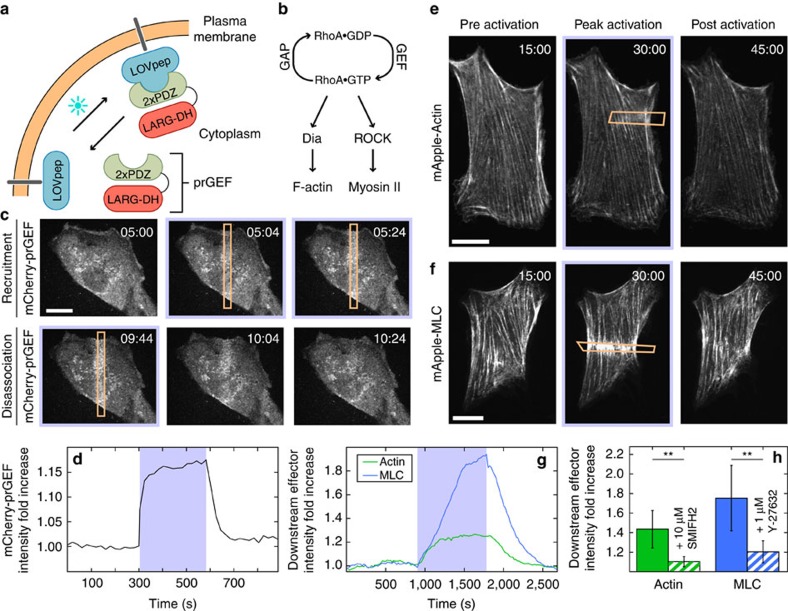
Figure 1
RhoA activity can be spatiotemporally controlled via an optogenetic probe.
( a ) Spatiotemporal control of RhoA activity is achieved using an optogenetic probe to recruit the RhoA-specific GEF LARG to the plasma membrane. A LOVpep molecule is anchored to the membrane via fus...
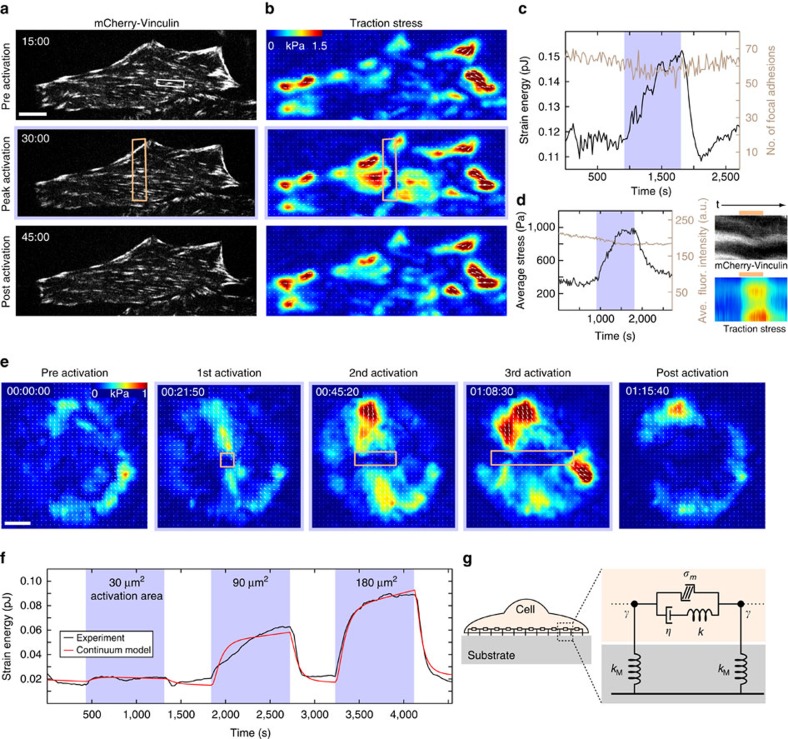
Figure 2
Increased RhoA activity leads to increased cell contractility.
( a ) A cell expressing mCherry-Vinculin is shown before activation, after 15u2009min of activation and after 15u2009min of relaxation. The activation region is indicated by the orange box. ( b ) The ...
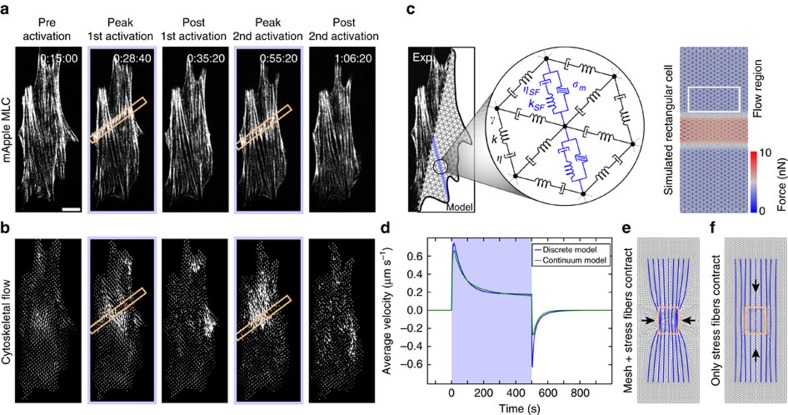
Figure 3
Stress fibers direct contractile flow.
( a ) Fluorescence time series of a cell expressing mApple-MLC shown prior and after two separate periods of activation (orange boxes). ( b ) Flow fields of myosin calculated from the images in panel ...
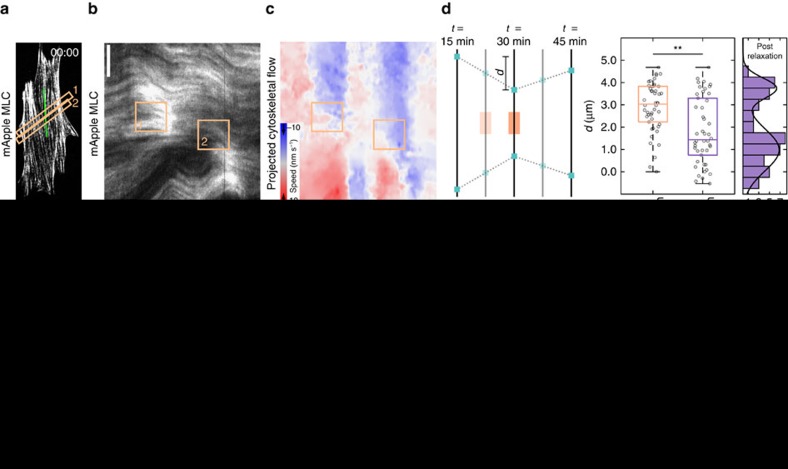
Figure 4
Stress fibres behave elastically.
( a ) Image showing a cell labelled with mApple-MLC. The activation regions are indicated by the orange boxes. ( b ) A kymograph drawn along the stress fibre (green line in panel a ). During activatio...
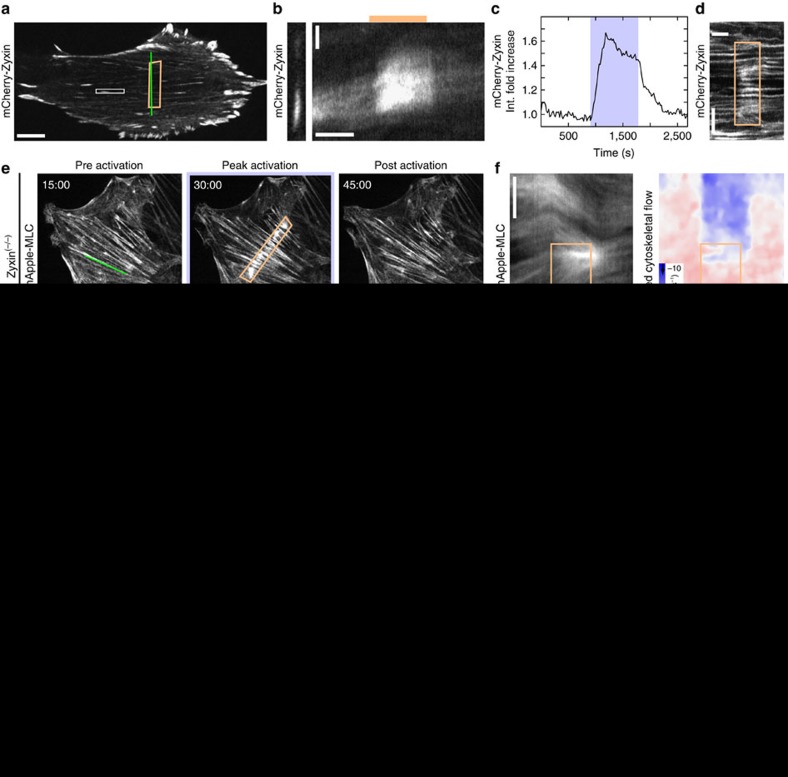
Figure 5
Zyxin accumulates at sites of strain on stress fibres during local RhoA activation.
( a ) A NIH 3T3 expressing mCherry-zyxin. The activation region is indicated by the orange box. ( b ) A kymograph of a representative adhesion marked by the white box in panel a . ( c ) The average in...
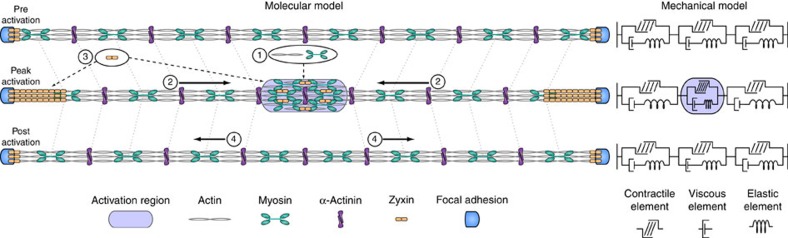
Figure 6
Molecular and mechanical models of local RhoA activation in stress fibres.
Molecular model: (1) Local recruitment of prGEF leads to activation of RhoA and accumulation of actin and myosin. The local increase in actin and myosin in turn stimulates a local contraction in the s...
Figure images are served from the NIH/NLM PubMed Central Open Access Subset or Europe PMC; copyright remains with the publishers and authors.
💬 Discussion
0 commentsNo comments yet. Be the first to start a discussion!
Leave a Comment