Abstract
Astrocytic hyperactivity is an important contributor to neuronal-glial network dysfunction in Alzheimer's disease (AD). We have previously shown that astrocyte hyperactivity is mediated by signaling through the P2Y1 purinoreceptor (P2Y1R) pathway. Using the APPPS1 mouse model of AD, we here find that chronic intracerebroventricular infusion of P2Y1R inhibitors normalizes astroglial and neuronal network dysfunction, as measured by in vivo two-photon microscopy, augments structural synaptic integrity, and preserves hippocampal long-term potentiation. These effects occur independently from β-amyloid metabolism or plaque burden but are associated with a higher morphological complexity of periplaque reactive astrocytes, as well as reduced dystrophic neurite burden and greater plaque compaction. Importantly, APPPS1 mice chronically treated with P2Y1R antagonists, as well as APPPS1 mice carrying an astrocyte-specific genetic deletion (Ip3r2-/-) of signaling pathways downstream of P2Y1R activation, are protected from the decline of spatial learning and memory. In summary, our study establishes the restoration of network homoeostasis by P2Y1R inhibition as a novel treatment target in AD.
🔬 Techniques
🔭 Microscopes
✨ Fluorophores
🧪 Sample Preparation
🔬 Cell Lines
🏭 Microscope Brands
🧪 Reagent Suppliers
🔴 Lasers
🎨 Filters
💻 Software Details
🏛️ Research Organizations (ROR)
Affiliated research institutions:
📋 Methods
Animals
All experiments were performed according to animal care guidelines and approved by the Landesamt für Natur, Umwelt und Verbraucherschutz of North Rhine-Westphalia (Germany). We used mice that coexpress the human KM67/671NL mutation in the APP (APPswe) and human L166P-mutated PS1 under the control of the Thy1 promoter on a C57BL/6J background (APPPS1-21; provided by M. Jucker, DZNE, Tübingen, Germany; Radde et al., 2006 ) and their WT age-matched and sex-matched littermates, as well as Ip3r2 −/− ( Li et al., 2005 ; provided by J. Chen, University of San Diego, San Diego, CA). Ip3r2 −/− mice were crossed with Appps1 +/− mice, and Appps1 +/− × Ip3r2 +/− and Appps1 −/− × Ip3r2 +/− offspring were crossed to generate Appps1 +/− × Ip3r2 −/− , Appps1 −/− × Ip3r2 −/− , and Appps1 +/− × Ip3r2 +/+ for experiments. Animals were housed in groups on a 12-h light/dark cycle with food and water available ad libitum. Fixed brains of P2y1r −/− mice were provided by S. Koizumi (University of Yamanashi, Yamanashi, Japan) and U. Krügel (University of Leipzig, Leipzig, Germany). Intracerebroventricular cannulation and drug treatment MRS2179 (1 mM; Tocris) and MRS2365 (50 µM; Tocris) were solubilized in sterile saline; BPTU (10 µM; Tocris) was solubilized in DMSO and sterile saline. Mice were implanted s.c. at the interscapular region with osmotic minipumps (model Alzet 2006; delivery rate, 0.15 µl/h for 42 d; Durect) connected to Alzet Brain Infusion Kit 3 (anteroposterior [AP] −0.2 mm, medial lateral [ML] +1 mm relative to bregma; dorsal ventral [DV] +2.5 mm from the brain surface; Durect) for i.c.v. delivery. During surgery, animals were anesthetized with a combination of isoflurane (1.5% vol/vol), O 2 (0.3% vol/vol), and N 2 O (0.7% vol/vol) and kept on a heating pad (37°C). Buprenorphine s.c. was used as an analgesic. Pumps were filled with saline or compounds according to the manufacturer’s instructions. For topical drug treatment, the dura was removed, and MRS2365 (0.5 µM; solubilized in sterile saline) was topically applied for 45 min. Agarose (1.5% in artificial cerebrospinal fluid [ACSF], in mM: 132 NaCl, 3 KCl, 0.6 MgCl 2 , 1.5 CaCl 2 , 24.6 NaHCO 3 , 3.7 glucose, 6.7 urea) was placed on top of the cortex for stabilization, and the window was closed with a cover glass (diameter, 5 mm) and sealed with silicone elastomer (Kwik-Sil; World Precision Instruments [WPI]).
Show full methods section
Animals
All experiments were performed according to animal care guidelines and approved by the Landesamt für Natur, Umwelt und Verbraucherschutz of North Rhine-Westphalia (Germany). We used mice that coexpress the human KM67/671NL mutation in the APP (APPswe) and human L166P-mutated PS1 under the control of the Thy1 promoter on a C57BL/6J background (APPPS1-21; provided by M. Jucker, DZNE, Tübingen, Germany; Radde et al., 2006 ) and their WT age-matched and sex-matched littermates, as well as Ip3r2 −/− ( Li et al., 2005 ; provided by J. Chen, University of San Diego, San Diego, CA). Ip3r2 −/− mice were crossed with Appps1 +/− mice, and Appps1 +/− × Ip3r2 +/− and Appps1 −/− × Ip3r2 +/− offspring were crossed to generate Appps1 +/− × Ip3r2 −/− , Appps1 −/− × Ip3r2 −/− , and Appps1 +/− × Ip3r2 +/+ for experiments. Animals were housed in groups on a 12-h light/dark cycle with food and water available ad libitum. Fixed brains of P2y1r −/− mice were provided by S. Koizumi (University of Yamanashi, Yamanashi, Japan) and U. Krügel (University of Leipzig, Leipzig, Germany). Intracerebroventricular cannulation and drug treatment MRS2179 (1 mM; Tocris) and MRS2365 (50 µM; Tocris) were solubilized in sterile saline; BPTU (10 µM; Tocris) was solubilized in DMSO and sterile saline. Mice were implanted s.c. at the interscapular region with osmotic minipumps (model Alzet 2006; delivery rate, 0.15 µl/h for 42 d; Durect) connected to Alzet Brain Infusion Kit 3 (anteroposterior [AP] −0.2 mm, medial lateral [ML] +1 mm relative to bregma; dorsal ventral [DV] +2.5 mm from the brain surface; Durect) for i.c.v. delivery. During surgery, animals were anesthetized with a combination of isoflurane (1.5% vol/vol), O 2 (0.3% vol/vol), and N 2 O (0.7% vol/vol) and kept on a heating pad (37°C). Buprenorphine s.c. was used as an analgesic. Pumps were filled with saline or compounds according to the manufacturer’s instructions. For topical drug treatment, the dura was removed, and MRS2365 (0.5 µM; solubilized in sterile saline) was topically applied for 45 min. Agarose (1.5% in artificial cerebrospinal fluid [ACSF], in mM: 132 NaCl, 3 KCl, 0.6 MgCl 2 , 1.5 CaCl 2 , 24.6 NaHCO 3 , 3.7 glucose, 6.7 urea) was placed on top of the cortex for stabilization, and the window was closed with a cover glass (diameter, 5 mm) and sealed with silicone elastomer (Kwik-Sil; World Precision Instruments [WPI]).
Stereotactic virus injections
Mice were anesthetized with isoflurane (induction, 3%; maintenance, 1–1.5% vol/vol). Body temperature was maintained with a heating pad (37°C). Mice were placed in a stereotaxic frame, and a small hole (∼0.3 mm) was drilled into the skull using a dental drill (coordinates: AP –1.9 mm and ML +1.25 mm relative to bregma). AAV5-GfaABC1D-cytoGCaMP6f.SV40 (1 µl; UPenn Vector Core) was injected at 0.1 µl/min into the dorsal hippocampus (DV +1 mm from brain surface) using a syringe with a 34G cannula (WPI) connected to a pump (Ultra Micro Pump; WPI). Mice received buprenorphine for analgesia (0.05 mg/kg for 3 d) and dexamethasone to prevent inflammation (0.2 mg/kg, once).
Hippocampal window preparation
Hippocampal window surgery was performed 2 wk after virus injection and 4 wk before imaging as described previously ( Schmid et al., 2016 ). Animals were anesthetized with isoflurane (induction, 3%; maintenance, 1–1.5% vol/vol), and body temperature was maintained with a heating pad (37°C). Mice received s.c. analgesic (buprenorphine, 0.1 mg/kg), an anti-inflammatory drug (dexamethasone, 0.2 mg/kg), and an antibiotic (cefotaxime, 2 g/kg). After fixation in a stereotaxic frame, the skin was removed under sterile conditions, and a craniotomy (diameter, 3 mm) above the right somatosensory cortex (coordinates: AP –1.9 and ML +1.25 relative to bregma) was created with a dental drill. The dura was removed, and the somatosensory cortex was aspirated with a 21G needle attached to a 20-ml syringe with a flexible tube. When the external capsule of the hippocampus was reached, the alveus was carefully exposed using a 27G needle. The surface of the dorsal hippocampus was rinsed with sterile saline until bleeding stopped. Subsequently, a metal tube (diameter, 3 mm; height, 1.5 mm) sealed with a glass coverslip (diameter, 3 mm) was inserted, and the upper tube edge was glued to the skull bone using dental cement. The remaining exposed surface of the skull bone was sealed with dental cement, and a custom-made metal bar (z-stripe) was glued next to the metal tube. The z-stripe allowed repetitive repositioning in a custom-made head-holder for in vivo imaging under the two-photon microscope. After surgery, mice received an analgesic (buprenorphine, 0.1 mg/kg) for 3 d.
Cortical window preparation
Windows were implanted as described previously ( Delekate et al., 2014 ). Briefly, animals were anesthetized with isoflurane (induction, 3%; maintenance, 1–1.5% vol/vol) and kept on a heating pad (37°C). After fixation in a stereotactic frame, the scalp was removed, and a craniotomy (diameter, 5 mm) was created above the left somatosensory cortex using a dental drill. Agarose (1.5% in ACSF) was placed on top of the cortex for stabilization, and the window was closed with a cover glass (diameter, 5 mm) and sealed with dental cement. In vivo two-photon microscopy Mice implanted with a hippocampal window were imaged using an upright two-photon microscope (LaVision Trim ScopeII) with a 16× objective (NA 0.8, Nikon LWD16x) and three nondescanned detectors with bandpass filters (617/73, 460/80, and 525/50 nm). Texas Red dextran (70 kD; 6.25 mg/ml; Invitrogen) was injected i.v. to visualize blood vessels. To visualize Aβ plaques, methoxy-X04 (2–5 mg/kg; Tocris; solubilized in PBS with 4% Cremophor EL) was injected i.p. 24 h before imaging. During imaging, mice were anesthetized with isoflurane and kept on a heating pad (37°C). Fluorophores were excited at 800 or 920 nm using a Titan Sapphire (Ti:Sa) laser (Chameleon Ultra II; Coherent; 140-fs pulse width, 80-MHz repetition). Z stacks were taken (250 × 250 × 300 µm; 816 px; z increment, 3 µm; pixel dwell time, 0.95 µs), and XY time-lapse series of astroglial calcium activity (260 × 260 µm; 259 px; pixel dwell time, 1.88 µs) were subsequently recorded for 10 min at 3.57 Hz at a depth of 100–200 µm beneath the hippocampal surface. In mice implanted with a cortical window, the calcium-sensitive dye OGB-1 AM (Life Technologies; solubilized in 20% Pluronic/80% DMSO and diluted to 1 mM with PBS) and SR101 (100 µM; Sigma) were coinjected into the cortex at a depth of 100–200 µm using glass micropipettes (tip diameter, 4–10 µm; WPI) connected to a pneumatic injector (1 bar, 60–90 s; PDES; NPI Electronic). Mice were anesthetized with a combination of isoflurane (0.5% vol/vol in 5% O 2 ) and ketamine (50 mg/ml; 10 µl bolus followed by 1.5 µl/min, administered i.p. through a catheter connected to a pump) and imaged using a Trim ScopeII microscope (LaVision) with three nondescanned detectors with bandpass filters (620/60, 460/80, and 525/50 nm) or an LSM 7MP (Zeiss) equipped with a Ti:Sa laser (Chameleon Ultra II; Coherent) with three bandpass filters (420/80, 500/550, and 565–610 nm) and one long-pass filter (555 nm). Fluorophores were excited at 800 nm. A 20× W Plan-Apochromat (NA 1.0; Zeiss) was used for both microscopes. Z stacks of the imaging region were taken (Trim ScopeII: XY, 250 × 250 µm, 828 px; Z, 1-µm step size, 100-µm range, pixel dwell time 0.93 µs; LSM 7MP: XY, 249.8 × 249.8 µm, 828 px; Z, 1-µm step size, 100-µm range, pixel dwell time 0.79 µs), followed by XY time-lapse series of calcium activity (Trim ScopeII: 260 × 260 µm, 250 px, pixel dwell time 1.9 µs, frequency 3.55 Hz; LSM 7MP: 249 × 249 µm, 240 px, pixel dwell time 2.14 µs, frequency 3.47 Hz) for 10 min at 800 nm. Laser power below the objective was kept between 20 and 40 mW to minimize laser-induced artifacts and phototoxicity.
Behavioral phenotyping
All data were recorded and analyzed with EthoVision XT9 (Noldus). For Barnes maze experiments, mice were placed in the center of a brightly lit open platform (diameter, 122 cm) in the presence of a continuous clicking sound. The platform was confined by 20 holes (hole diameter, 5 cm), with an escape box (target) fixed below one hole; all other holes were sealed. Extramaze cues were present for spatial orientation. 24 h before the first training day, the mice were placed in the middle of the platform and gently guided with a transparent glass beaker to the target. The beaker was placed on top of the target hole, and the mice were allowed 5 min to enter the escape box. Once the mice had entered the escape box, the clicking sound was stopped and they stayed in the escape box for 1 min. During the 4-d training/acquisition phase, mice performed four trials per day, with an intertrial interval of 15 min. For each trial, mice were put at the center of the platform in a black tube for 30 s in the presence of the clicking sound, and after tube removal were allowed to freely explore the maze until they entered the escape box, after which the sound was stopped. The mice had 180 s to find the escape box. Mice that were not able to find the box were guided to the escape box using the glass beaker and left in the box for 1 min. On day 5 (probe trial), the escape box was removed, the target hole was sealed, and the mice were allowed to freely explore the maze for 60 s. Morris water maze experiments were conducted using a circular pool (diameter, 110 cm) filled with opacified water at 20°C. The maze was virtually divided into four quadrants, with one containing a hidden platform (diameter, 10 cm) 1 cm below the water surface. Extramaze cues were present for spatial orientation. Mice were placed into the water in a quasi-random fashion and were allowed to search for the platform for 60 s and remain on the platform for 15 s; if the mice did not reach the platform in the allotted time, they were placed onto it manually. Mice were tested in four trials per day for five consecutive days with an intertrial interval of 30 min. Mice were dried with tissue towels and placed back in their home cages after the trials. For the probe trials, which were conducted 24 h after the last training session, the platform was removed, and mice were put in a new position into the maze and allowed to swim for 60 s.
Electrophysiology
Electrophysiological recordings were performed in acute brain slices as previously described ( Minge et al., 2017 ). Briefly, 300-µm acute hippocampal slices were obtained from APPPS1 and age-matched WT littermates. Horizontal slices were cut in an ice-cold slicing solution containing (in mM) NaCl 60, sucrose 105, KCl 2.5, MgCl 2 7, NaH 2 PO 4 1.25, ascorbic acid 1.3, sodium pyruvate 3, NaHCO 3 26, CaCl 2 0.5, and glucose 10 (osmolarity 300–310 mOsm) and kept in the solution at 34°C for 15 min before being stored at room temperature (21–23°C) in an extracellular solution containing (in mM) NaCl 131, KCl 2.5, MgSO 4 1.3, NaH 2 PO 4 1.25, NaHCO 3 21, CaCl 2 2, and glucose 10. All solutions were constantly bubbled with 95% O 2 /5% CO 2 . Slices were allowed to rest for at least 1 h before recordings commenced, transferred to an interface chamber, and superfused with extracellular solution at 34°C. In a subset of experiments, MRS2197 (30 µM; Tocris) was added to the extracellular solution for 20–30 min before recordings started. Field excitatory postsynaptic potentials (fEPSPs) were recorded through a standard patch pipette (3–4 MΩ) filled with extracellular solution and placed in the CA1 stratum radiatum. fEPSPs were evoked by electrical stimulation of CA3-CA1 Schaffer collaterals using a bipolar concentric stimulation electrode (FHC) placed in the stratum radiatum at the border between CA2/3 and CA1. The stimulation intensity was adjusted to obtain fEPSPs with half-maximum amplitude (without MRS2197: WT, 66.1 ± 4 µA, n = 12; APPPS1, 69.9 ± 7.6 µA, n = 8; Student’s t test, P = 0.68; with MRS2197: WT, 39.7 ± 10.3 µA, n = 7; APPPS1, 46 ± 5.8 µA, n = 11; Student’s t test, P = 0.52). Basal synaptic transmission was monitored using single stimuli (100-µs duration) every 15 s for at least 10 min before induction of LTP using theta-burst stimulations (TBSs). During a TBS, eight bursts consisting of four stimuli (100 Hz) were applied at 5 Hz. TBS were delivered three times with an interval of 1 min. Subsequently, single stimuli were applied for 30 min to probe fEPSP potentiation. Signals were amplified (1000×, EXT-02B; NPI) and filtered (high-pass, 0.1 Hz; low-pass, 20 kHz). Data were digitalized at a sampling rate of 10 kHz and stored using WinWCP (Strathclyde Electrophysiology Software). Analysis of fEPSP slopes was performed offline using Clampfit (Molecular Devices).
Immunohistochemistry
Mice were sacrificed, and one hemisphere was fixed in 4% paraformaldehyde for 1 d, stored in sucrose (15 and 25%), and embedded in Tissue-Tek (Sakura). Saggital sections (30 µm) were obtained using a cryostat (Thermo Fisher) and mounted onto slides. Postmortem human brain tissue sections (4 µm) from AD cases were obtained through a collaboration with the Department of Neuropathology (University Hospital Bonn, Germany). The sections were deparaffined using xylene and descending ethanol solutions and incubated for 30 min in 0.21% citric acid (90–95°C). All brain sections were blocked with 10% normal goat serum (Vector Labs) and 0.3% Triton X-100 (Sigma) in PBS for 1 h. Subsequently, mouse brain sections were incubated with rabbit anti-GFAP (1:500; Z0334; Dako), rabbit anti-P2Y1R (1:200; APR009; Almone), rat anti-GFAP (1:1,000; 130300; Invitrogen), mouse anti-IC16 (1:250; provided by C. Pietrzik, Mainz University, Mainz, Germany); rabbit anti-Iba1 (1:250; 019-19741; Wako), rabbit anti-synaptophysin (1:250; ab14692; Abcam), chicken anti-Homer1 (1:500; 160006; Synaptic Systems), and rat anti-LAMP1 (1:750; 121602; BioLegend) in 5% normal goat serum and 0.05% Triton X-100 overnight at 4°C. Human brain sections were incubated with rabbit anti-P2Y1R (1:100; APR009; Almone), rat anti-GFAP (1:250; 130300; Invitrogen), and mouse anti-IC16 (1:250). Nuclei were stained with Hoechst 33258 (1:1,000; Thermo Fisher). After rinsing human sections in Tris buffer and mouse sections in PBS, stainings were incubated with secondary antibodies from goat (anti–rabbit Alexa Fluor 594, anti–rat Alexa Fluor 633, anti–rabbit Alexa Fluor 488, anti–mouse Alexa Fluor 647, anti–rat Alexa Fluor 647, and anti–chicken Alexa Fluor 647; 1:1,000; Thermo Fisher) in PBS and 0.05% Triton X-100 for 1 h at room temperature, rinsed, and mounted in Fluoromount-G (Southern Biotech). For thioflavin staining, sections were shortly incubated with 70 and 80% ethanol and stained with 1% thioflavin S (Sigma) in 80% ethanol for 15 min. Subsequently, sections were rinsed in 80 and 70% ethanol and distilled water, counterstained with Hoechst, and mounted as described above. Images were acquired using either a confocal laser-scanning microscope (LSM 700; Zeiss) with a 40× (NA 1.3) or 63× (NA 1.4) objective or a slide scanner (Axio Scan.Z1, Zeiss) with a 10× objective (NA 0.45), with the following filter settings: LSM700, 490–555 BP, 640 LP, 490 SP; AxioScan.Z1, 470/40 BP, 525–50 BP, 587/25 BP, 647/70 BP, 640/30 BP, 690/50 BP. The same image acquisition settings were used for each staining. Protein biochemistry Mice were sacrificed, and one hemisphere was quickly transferred to liquid nitrogen and stored at −80°C. Protein extraction was performed by homogenization in PBS, pH 7.4, and 1% phosphatase inhibitor cocktail (Thermo Fisher) and 1% protease inhibitor cocktail (Thermo Fisher) using a ceramic bead homogenizer (Precellys; VWR). Homogenates were extracted in RIPA buffer (in mM: 49.96 Tris, pH 7.2, 149.6 NaCl, 25.6 NP-40, 24 Na deoxycholate, and 6.8 SDS) and centrifuged for 30 min at 100,000 g . The pellet containing insoluble Aβ was solubilized in SDS buffer (in mM: 69.2 SDS and 24.98 Tris, pH 7.5). Protein concentration was measured using a BCA Protein Assay kit (Thermo Fisher) and a FLUOstar Omega reader (BMG). For protein gel electrophoresis, samples were solubilized in 4× LDS buffer (Life Technologies), boiled for 10 min at 95°C, centrifuged for 5 min at 20,000 g at 4°C, and loaded on 4–12% NuPAGE Novex Bis-Tris-midi gels (Life Technologies). SeeBlue Plus2–prestained protein standard (Thermo Fisher) was used to determine molecular weights. After electrophoresis, the samples were transferred to nitrocellulose membranes (0.2 µm; Bio-Rad). For CTF detection, the membranes were incubated for 1 min in 1× Tris-buffered saline (2.73 M NaCl and 39.9 mM Tris, 96°C, pH 7.6). All membranes were blocked in 5% nonfat skim milk powder (Biomol) in 1× Tris-buffered saline with 0.05% Tween 20 (Merck) for 1 h at room temperature. Full-length APP was detected using 6E10 antibody (1:100,000; SIG-39320-1000; BioLegend), CTFs were detected using C1/6.1 antibody (1:1,000; 802801, BioLegend), neprilysin was detected using an anti-CD10 antibody (1:500; AF1126, R&D Systems), and actin was detected using an anti–β-actin antibody (1:8,000; A2103; Sigma). Immunoreactivity was detected by enhanced chemiluminescence reaction (Stella 3200; Raytest). ELISA quantification of P2Y1R was conducted using whole-brain homogenates (25 mg/ml) according to the manufacturer’s instructions (EL017326MO; Cusabio). Quantitative determination of Aβ was performed using an electrochemiluminescence triplex ELISA for Aβ 1–38 , Aβ 1–40 , and Aβ 1–42 (Aβ Peptide Panel 1 6E10 Kit; Meso Scale Discovery) according to the manufacturer’s instructions using a SECTOR Imager 2400 reader (Meso Scale Discovery).
Data analysis
Data analysis was conducted blinded for pharmacological intervention or genotype. Calcium imaging data were imported into ImageJ 1.50i (National Institutes of Health) and stabilized using the Image Stabilizer plugin for ImageJ (K. Li, Carnegie Mellon University, Pittsburgh, PA). Regions of interest (ROIs) of OGB-1–positive cells and GCaMP6f-expressing astrocytes were defined manually. OGB-1–positive cells were considered astrocytes when they were colabeled with SR101. Neurons were identified manually by their morphology and the absence of SR101. For all calcium data, fluorescence over time was determined for each ROI, converted to Δ F / F , and imported into Matlab R2013b (MathWorks). After removal of outliers using a median filter and smoothing using a Gaussian filter, peak amplitude, time to peak, peak to baseline, and full duration at half maximum (FDHM) were determined for each signal using a custom-written algorithm in Matlab. Each time-lapse series that met this criterion was plotted together with the respective video file for visual inspection and verification. Astrocytes were defined as hyperactive based on established criteria (activity, ≥0.4 events/min; Delekate et al., 2014 ). All immunohistochemical data points represent mean values of 5–10 brain sections per mouse. Immunohistochemical images were imported into ImageJ, converted to 8-bit gray level images, and smoothed using a Gaussian filter. After contrast enhancement (0.4% saturated pixels), images were binarized using ImageJ (plaque stainings, automated MaxEntropy algorithm; synaptic puncta stainings, automated Otsu algorithm; for GFAP and Iba1, a threshold defined as the mean background intensity plus the SD of background intensity multiplied by 2 was used). Astrocyte, microglia, and plaque area coverage as well as the number and size of plaques and LAMP1-positive dystrophic dendrites per area were quantified using ImageJ. The plaque area was subtracted from the area covered by dystrophic neurites before data analysis. To quantify synaptic puncta, colocalized synaptophysin-positive or Homer1-positive punctuate signals were counted in thresholded single-plane confocal images using the Synapse Counter plugin for ImageJ ( Dzyubenko et al., 2016 ) with a predefined puncta size range of 0.9–20 µm 2 . For periplaque morphological complexity quantification, high-resolution stacks were subjected to background removal (plaque stainings, automated Otsu algorithm; GFAP/Iba1 stainings, automated Huang algorithm; intensity thresholds were calculated based on maximum-intensity projections), and for each channel, 3D particles (plaque channel, ≥600 voxels; glia channel, ≥30 voxels) were reconstructed using a Flood-Filler algorithm. Plaque mean intensity was calculated by the mean of all plaque voxels. Glial particles were considered as periplaque when they contained ≥1 voxels with a distance ≤ 2 r to the plaque center. Near-plaque glial particles were smoothed using a Gaussian filter (sigma, 1.0 px), skeletonized using the Skeletonize3D plugin, and analyzed using the Analyze Skeleton plugin. We used Mann–Whitney test or Student’s t test for comparisons between two groups; Kruskal–Wallis test followed by Dunn’s multiple comparisons test or one-way ANOVA and Dunnett’s multiple comparison test to compare several groups; two-way repeated-measures ANOVA and Bonferroni post hoc test for multiple measurements in the same groups; Fisher’s exact test to compare proportions; Kolmogorov–Smirnov test to compare cumulative distributions; and Spearman correlation coefficient to quantify correlations. Data were analyzed using Prism 7 (GraphPad) and are expressed as mean ± SEM. P < 0.05 was accepted as statistically significant. Online supplemental material Fig. S1 shows that the anti-P2Y1R antibody displayed immunoreactivity for astrocytes in WT mice, but not in P2y1r −/− mice. Fig. S2 shows the workflow for the quantification of morphological barrier functions of periplaque astrocytes. Video 1 shows spontaneously active astrocytes in the hippocampus of an APPPS1 mouse.
Online supplemental material Fig. S1 shows that the anti-P2Y1R antibody displayed immunoreactivity for astrocytes in WT mice, but not in P2y1r −/− mice. Fig. S2 shows the workflow for the quantification of morphological barrier functions of periplaque astrocytes. Video 1 shows spontaneously active astrocytes in the hippocampus of an APPPS1 mouse.
Supplementary Material Supplemental Materials Video 1.
📊 Figures
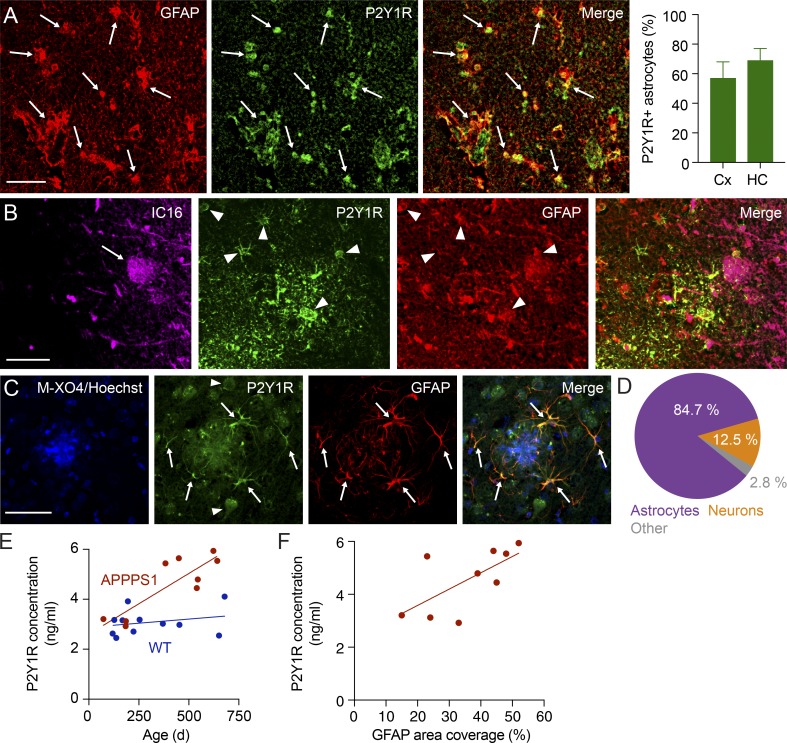
Figure 1.
P2Y1R expression in AD and APPPS1 mice. (A) P2Y1R expression in cortical astrocytes (anti-GFAP; arrows) in human AD. Right: P2Y1R expression occurred in the majority of GFAP-positive astrocytes in cor...
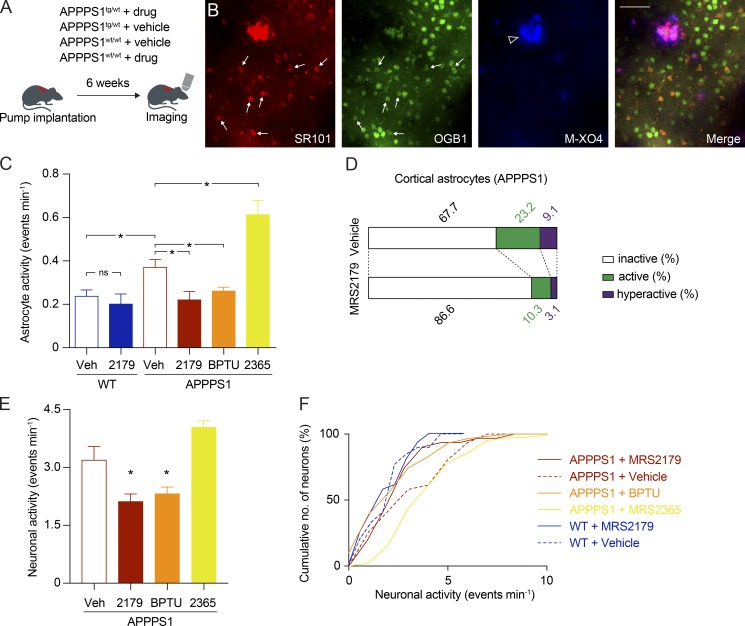
Figure 2.
Cortical astrocytes are hyperactive in APPPS1 mice, and MRS2179 reduces cortical hyperactivity. (A) APPPS1 mice or WT littermates were treated with P2Y1R-selective drugs through osmotic minipumps for ...

Figure 3.
Hippocampal astrocytes are hyperactive in APPPS1 mice. (A) AAV-GfaABC1D-cytoGCaMP6f was injected into the dorsal hippocampus in APPPS1 mice or WT littermates, and a window above the right dorsal hippo...
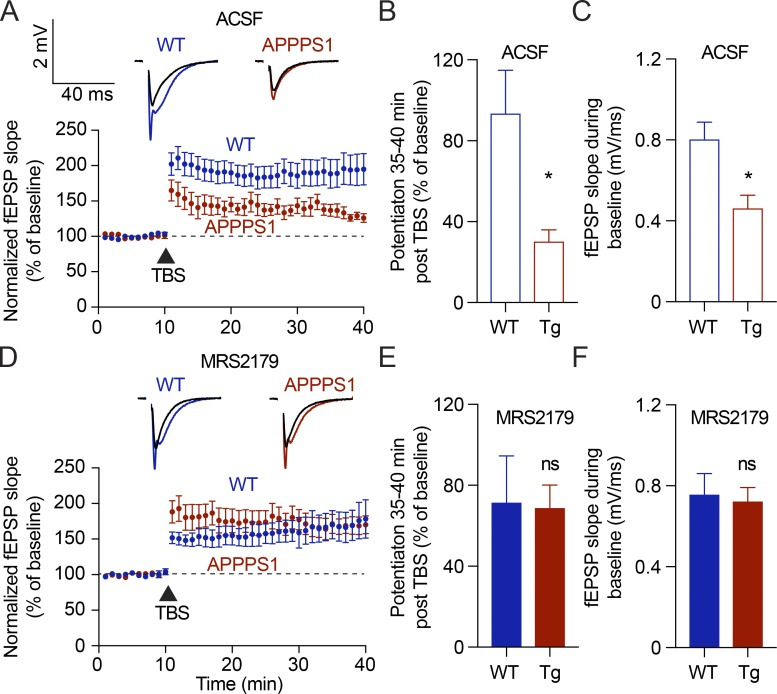
Figure 4.
MRS2179 restores hippocampal LTP in APPPS1 mice. (A) Representative sample traces before and after LTP of CA3-CA1 Schaffer collateral synapses, and time courses of normalized fEPSP slopes during LTP, ...
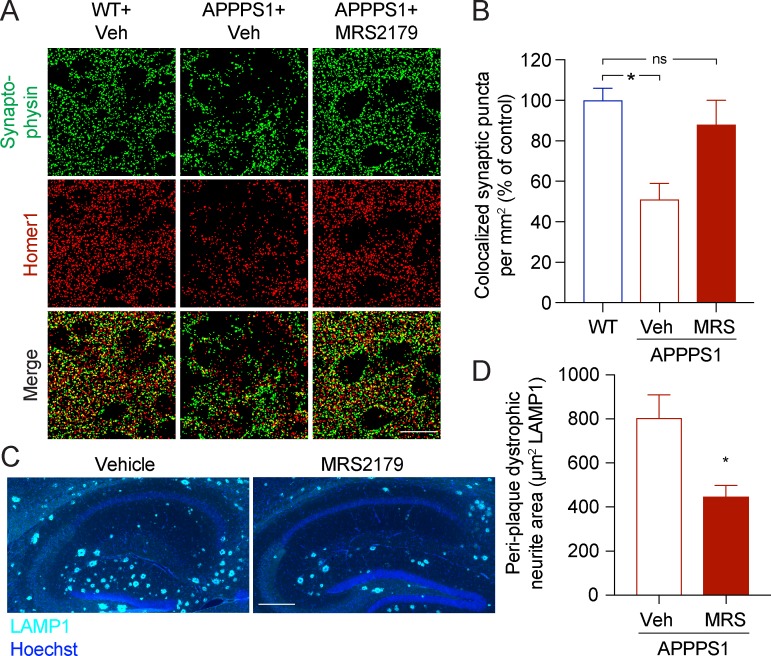
Figure 5.
MRS2179 augments structural synaptic integrity. (A and B) The density of hippocampal CA1 synaptic puncta, quantified as colocalization of synaptophysin and Homer1 immunoreactivity, was reduced in vehi...
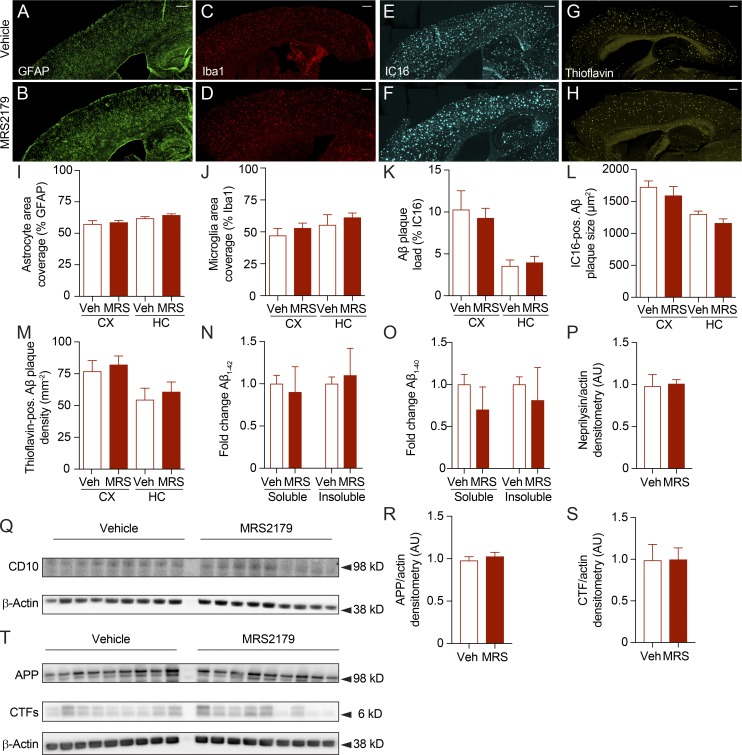
Figure 6.
Chronic P2Y1R inhibition has no effects on gliosis, plaque load, and amyloid metabolism. (Au2013M) MRS2179 (in comparison to vehicle; n = 6 mice for each group; age of both groups, 9 mo) had no effect...
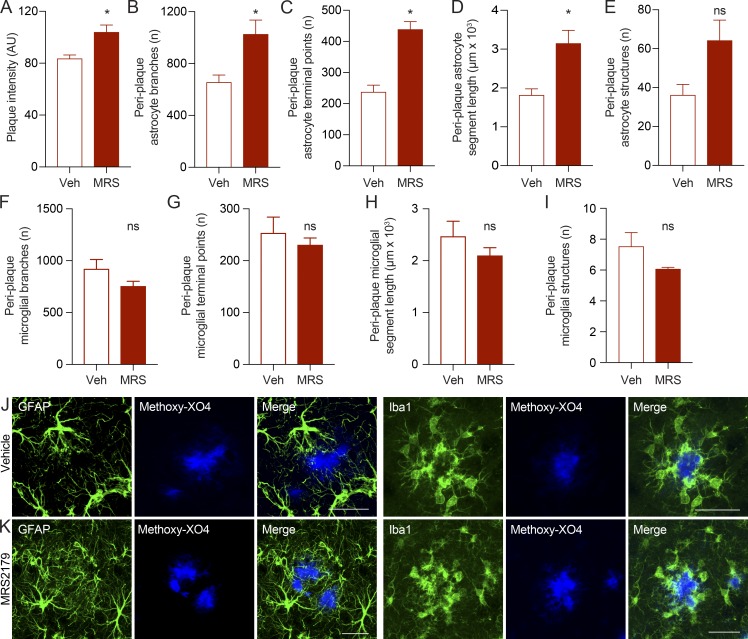
Figure 7.
P2Y1R inhibition increases the morphological barrier function of periplaque hippocampal astrocytes. (A) The mean intensity of hippocampal plaques was increased in MRS2179-treated versus vehicle-treate...
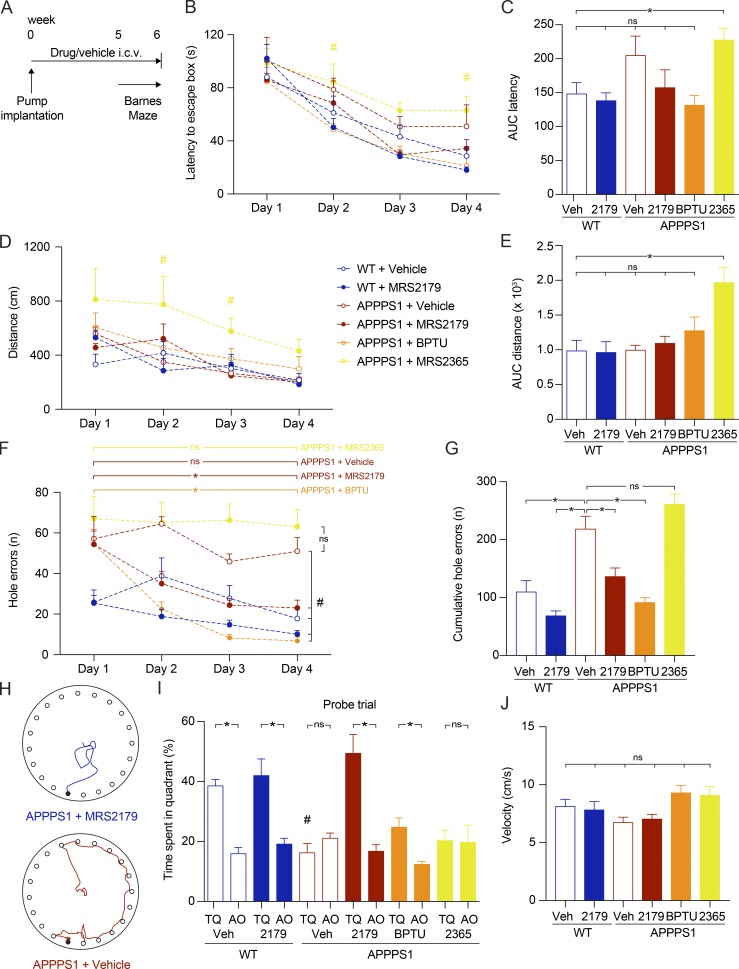
Figure 8.
Chronic P2Y1R inhibition reverses spatial reference learning and memory deficits in APPPS1 mice. (A) Mice were treated with P2Y1R-selective drugs or vehicle through osmotic minipumps for 5 wk and test...
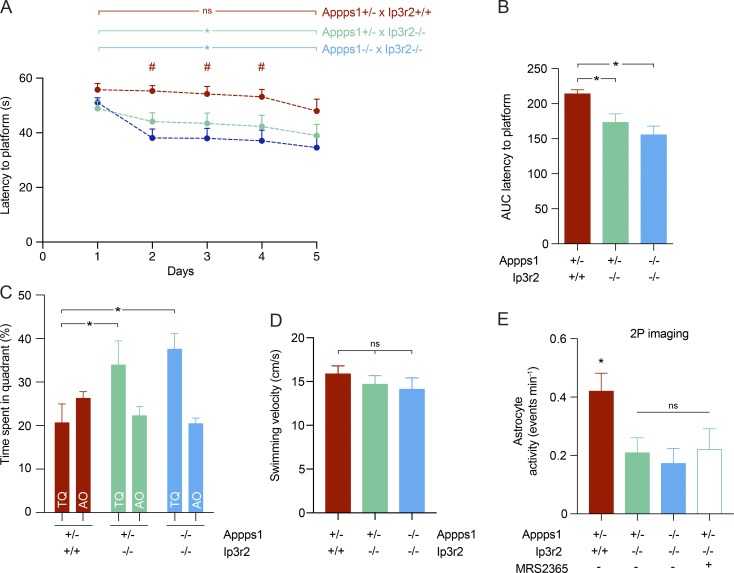
Figure 9.
Deletion of metabotropic signaling downstream of astrocyte P2Y1R activation improves spatial memory and network hyperactivity. (A) Appps1 +/u2212 u00d7 Ip3r2 u2212/u2212 mice showed faster latencies t...
Figure images are served from the NIH/NLM PubMed Central Open Access Subset or Europe PMC; copyright remains with the publishers and authors.
💬 Discussion
0 commentsNo comments yet. Be the first to start a discussion!
Leave a Comment