Abstract
Microglia are an exquisitely tiled and self-contained population in the CNS that do not receive contributions from circulating monocytes in the periphery. While microglia are long-lived cells, the extent to which their cell bodies are fixed and the molecular mechanisms by which the microglial landscape is regulated have not been determined. Using chronic in vivo two-photon imaging to follow the microglial population in young adult mice, we document a daily rearrangement of the microglial landscape. Furthermore, we show that the microglial landscape can be modulated by severe seizures, acute injury, and sensory deprivation. Finally, we demonstrate a critical role for microglial P2Y12Rs in regulating the microglial landscape through cellular translocation independent of proliferation. These findings suggest that microglial patrol the CNS through both process motility and soma translocation.
🔬 Techniques
✨ Fluorophores
🧪 Sample Preparation
🔬 Cell Lines
🏭 Microscope Brands
🧪 Reagent Suppliers
🔴 Lasers
🏛️ Research Organizations (ROR)
Affiliated research institutions:
📋 Methods
Acute Experimental Modulation of the Microglial Landscape Next, we sought to determine whether the observed daily rearrangement could be experimentally altered. We first tested the possibility that systemic activation of microglia could alter their rearrangement via intraperitoneal (i.p.) lipopysaccharide (LPS) (2 mg/kg) treatment. However, cortical microglia did not alter their daily rearrangement within 24 hr of LPS treatment ( Figures S2D and S2E ). Then, we turned our attention to systemic brain hyperactivity to modulate the microglial landscape. Our previous work showed that i.p. KA-induced seizures altered microglial morphologies ( Eyo et al., 2014 , 2017 ). Therefore, we used this treatment paradigm to experimentally alter brain activity and found that severe (stage-5), but not mild (stage-3), seizures transiently increased microglial rearrangement especially within the first 24 hr ( Figures 2A–2C ). By the third day of seizures, basal levels were restored and maintained thereafter for at least a month ( Figures S2F and S2G ). Similarly, i.p. pilocarpine-induced seizures increased microglial rearrangement within the first 24 hr of seizures ( Figures 2D and 2E ). Under these conditions, microglial translocations could also be detected ( Figure 2F ). Together, these results indicate that global increases in neuronal activity resulting from seizures increased microglial somatic rearrangements. To complement this global approach, we tested the effect of more localized brain manipulations on the rearrangement of the microglial landscape. First, we performed a localized laser-induced tissue injury and monitored the microglial landscape at 6-hr intervals and report obvious somatic translocations within the first few days, with cells translocating the most within the first 12 hr of the injury ( Figures 3A and 3B ; Video S1 ). Then we monitored the microglial landscape in the barrel cortex following whisker trimming and also observed increased changes in the microglial landscape of whisker-trimmed mice ( Figures 3C–3E ). Thus, changes in brain activities globally and locally alter the microglial landscape.
Show full methods section
Acute Experimental Modulation of the Microglial Landscape Next, we sought to determine whether the observed daily rearrangement could be experimentally altered. We first tested the possibility that systemic activation of microglia could alter their rearrangement via intraperitoneal (i.p.) lipopysaccharide (LPS) (2 mg/kg) treatment. However, cortical microglia did not alter their daily rearrangement within 24 hr of LPS treatment ( Figures S2D and S2E ). Then, we turned our attention to systemic brain hyperactivity to modulate the microglial landscape. Our previous work showed that i.p. KA-induced seizures altered microglial morphologies ( Eyo et al., 2014 , 2017 ). Therefore, we used this treatment paradigm to experimentally alter brain activity and found that severe (stage-5), but not mild (stage-3), seizures transiently increased microglial rearrangement especially within the first 24 hr ( Figures 2A–2C ). By the third day of seizures, basal levels were restored and maintained thereafter for at least a month ( Figures S2F and S2G ). Similarly, i.p. pilocarpine-induced seizures increased microglial rearrangement within the first 24 hr of seizures ( Figures 2D and 2E ). Under these conditions, microglial translocations could also be detected ( Figure 2F ). Together, these results indicate that global increases in neuronal activity resulting from seizures increased microglial somatic rearrangements. To complement this global approach, we tested the effect of more localized brain manipulations on the rearrangement of the microglial landscape. First, we performed a localized laser-induced tissue injury and monitored the microglial landscape at 6-hr intervals and report obvious somatic translocations within the first few days, with cells translocating the most within the first 12 hr of the injury ( Figures 3A and 3B ; Video S1 ). Then we monitored the microglial landscape in the barrel cortex following whisker trimming and also observed increased changes in the microglial landscape of whisker-trimmed mice ( Figures 3C–3E ). Thus, changes in brain activities globally and locally alter the microglial landscape.
EXPERIMENTAL PROCEDURES Animals
Both male and female adult mice, 2 to 5 months of age, were used in accordance with institutional guidelines, as approved by the Institutional Animal and Care Committee (IACUC) animal care and use committee at the Mayo Clinic and Rutgers University. Heterozygous (CX3CR1 GFP/+ ) GFP reporter mice expressing GFP under control of the fractalkine receptor (CX3CR1) promoter ( Jung et al., 2000 ) and transgenic mice (Thy1 YFP/+ ) expressing YFP ( Feng et al., 2000 ) in a subset of pyramidal neurons under the control of the Thy1 promoter were purchased from the Jackson Laboratory. For some experiments, CX3CR1 GFP/GFP mice were used as CX3CR1 −/− mice. P2Y12 −/− mice were originally donated by Dr. Michael Dailey at the University of Iowa (Iowa City, IA, USA) and have now been established in our lab. Trem2 −/− mice were donated by Dr. Marco Colonna at Washington University (St. Louis, MO, USA).
Chronic Window Implantation
Mice were anesthetized with isoflurane (5% for induction; 1.5% for maintenance and surgery) combined with oxygen fitted into a custom-made stereo-taxic frame. Mice were maintained on a heating pad during surgery and then received a local subcutaneous injection of 15–20 mL 0.25% bupivicane and lubricant eye ointment (Artificial Tears, Henry Schein). The hair above the mouse head was shaved with a clipper (Wahl BravMini), after which the mouse was placed in a stereotactic frame (Kopf) cleaned with three alternating swabs of betadine and 75% alcohol. The skin above the head was then cut to expose the skull. The skull was cleaned using a cotton swab of 3%–5% hydrogen peroxide, and a dental drill (Osada Model EXL-M40) and drill bit (Fine Science Tools, 19008-07) were used to drill open a circular >3-mm-diameter window, which was carefully removed using sharp forceps. During drilling, bone debris was cleared away, and the skull was frequently irrigated with sterile saline. For the limb/trunk region of the somatosensory cortex, the skull was removed with the center at about −2.5 posterior and ±2 lateral to bregma, while for the barrel cortex, the skull was removed with the center at about −2.5 posterior and ±3 lateral to bregma. Additionally, once opened, the exposed brain surface was kept moist with sterile saline. A 3-mm glass coverslip previously sterilized in 75% ethanol was put inside the window and held in place with a pipette tip, while curing dental cement (Tetric EvoFlow) was applied around the glass coverslip and cured with a Kerr Demi Ultra LED Curing Light (Dental Health Products). The skull, excluding the region with the window, was then covered with IBond Total Etch glue (Heraeus) and cured with a curing light. Finally, a custom-made head plate was glued with another application of the dental cement and cured with a curing light to permanently attach the head plate. Mice were allowed to recover from anesthesia on a heating pad (~10 min) before they were returned to their home cage. Mice were allowed to recover from the surgery for 2 to 4 weeks. Mice that showed a loss in imaging window clarity before the 2- to 4-week period of observation were discarded from the study. In Vivo Two-Photon Imaging Single-transgenic heterozygous GFP reporter mice ( Jung et al., 2000 ) or double-transgenic GFP reporter and YFP reporter mice were typically imaged using a two-photon microscope (Scientifica) with a Ti:Sapphire laser (Mai Tai; Spectra Physics) tuned to 900 nm with a 40× water-immersion lens (0.8 NA; Olympus). Fluorescence was detected using two photomultiplier tubes in whole-field detection mode and a 565-nm dichroic mirror with 525-/50-nm (green channel) and 620-/60-nm (red channel) emission filters. The laser power was maintained at 30–40 mW, and images were collected from 50 μm to 120 μm into the brain. For imaging microglial and neuronal YFP dynamics from each mouse, z stack images were collected at 1- to 2-μm intervals in several FOVs. For repeated imaging, blood vessels were used as gross landmarks, and dendrites were used as fine landmarks. To perform a general laser injury, we focused the laser 66× and parked it at 250 mW at 900 nm for 1–3 s.
Experimental Manipulations Seizure Induction
Mice with implanted windows were monitored for at least 5 days under basal conditions and received i.p. injections of either kainic acid at 22–24 mg/kg or pilocarpine at 260–280 mg/kg. For P2Y12-deficient mice, kainic acid was administered at 18–20 mg/kg to allow robust seizures without death, as these mice are more susceptible to kainic-acid-induced seizures ( Eyo et al., 2014 ). Seizure behavior was monitored under a modified Racine scale as follows: (1) freezing behavior; (2) rigid posture with raised tail; (3) continuous head bobbing and forepaws shaking; (4) rearing, falling, and jumping; (5) continuous occurrence of level 4; and (6) loss of posture and generalized convulsion activity ( Eyo et al., 2014 ). Mice that progressed to at least stage 3 were used for subsequent chronic daily imaging of mild (stages 3/4) to severe (stages 5/6) seizures. Whisker Trimming Mice with implanted windows were monitored for at least 5 days under basal conditions, and under anesthesia, all whiskers on the contralateral side to the implanted window were trimmed daily for 5 consecutive days with a clipper (Wahl BravMini).
LPS Treatment
Mice with implanted windows were monitored for at least 3 days under basal conditions and subsequently received i.p. injections of LPS at 2 mg/kg.
BrdU Labeling and Analysis
BrdU was used to label proliferating and recently post-mitotic cells in the brain. The BrdU solution was diluted in 1 M PBS just before use at a concentration of 10 mg/mL and intraperitoneally administered at 100 mg/kg in naive mice or 24 hr after mouse manipulation (seizures or whisker trimming). Mice were sacrificed 3 hr after the BrdU injection by perfusion, first with PBS and then with 4% paraformaldehyde (PFA). The brains were then incubated in 4% PFA overnight and transferred to 30% sucrose solution for at least 2 days. Brains were then cryosectioned to 15-μm thickness and attached to glass slides. For BrdU immunohistochemistry, the slides with brain sections were hydrated in Tris-buffered saline (TBS) for 10 s and transferred to a 50% form-amide in 2× saline sodium citrate (SSC) solution at 65°C for 2 hr. Slides with brain sections were then placed in a 2× SSC solution at room temperature for 15 min and were transferred to a 2 N HCl solution at 37°C for 20 min and then a 0.1 M borate buffer at room temperature for 10 min. Slides with brain sections were then washed three times in TBS (pH 7.6) in room temperature for 10 min each. Next, brain sections were blocked with 3% normal goat serum (NGS) in 1× TBS + 0.3% Triton-X at room temperature for 1 hr and then overnight at 4°C in the primary antibody Iba1 (Wako Pure Chemicals Industries, 1:500) or anti-BrdU (Sigma, 1: 500), washed 3 times in 1× TBS for 5 min each, and then incubated in the secondary antibody donkey anti-rabbit (1:500) or donkey anti-mouse (1:500) at room temperature for 2 hr. Slides with brain sections were then rinsed three times in 1× TBS for 5 min each and mounted for imaging on an EVOS fluorescence microscope. Images of Iba1- and BrdU-labeled tissues were collected at 10× magnification. Microglial proliferation was determined by assessing the colocalization of the BrdU signal with the Iba1 signal for microglia.
Landscape Rearrangement Analysis
For cell rearrangement analyses, microglia in FOVs from consecutive days within a volume of 60 × 330 × 330 μm between ~50 and 120 μm (or 180–240 μm) from the brain surface were compared. Individual cells were identified and marked with numbers from the previous day and transposed to the next day. Cell bodies were regarded as stable if they maintained their position within a 2-cell-body distance from the previous day (~10–15 μm). Cell bodies that were either absent or present at a distance of 2 cell bodies or more were marked as either ‘‘gained’’ if they were not there on the previous day or ‘‘lost’’ if they were there on the previous day but absent on the next day. The percent change of ‘‘rearranged’’ cells was determined as the number of both ‘‘gained’’ and ‘‘lost’’ cells divided by the total number of cells in each FOV × 100. Similar analysis, but specific for either ‘‘gained’’ or ‘‘lost’’ cells, was performed to determine the percent rearrangement of those cell groups ( Figures 1I and 4C ).
Statistical Analysis
Data were collected from at least 3 and up to 8 FOVs per mice and pooled together. Three to seven mice were used for each set of experiments. In our re-arrangement studies comparing changes in the microglial landscape before and after treatment, power analysis for paired t tests (α = 0.05, β = 0.2) was performed to establish the sufficiency of the sample size using GraphPad software. The power values achieved were as follows: (1) for an effect size of 30% change (from ~13% in control) in microglial rearrangement in the limb/trunk cortex, the power value was 0.90 for kainic acid (KA) treatment (n = 6 mice; combined SD: 17.09, severe seizures); (2) for an effect size of 20% change (from ~13% in control) in microglial rearrangement in the limb/trunk cortex, the power value was 0.80 for pilocarpine treatment (n = 3 mice, combined SD: 9.83); and (3) for an effect size of 14% (from ~7% in control) in microglial rearrangement in the barrel cortex, the power value was 0.80 for whisker trimming (n = 4 mice; combined SD: 8.58). Student’s t test was used for statistical analysis, Bonferroni correction was used for multiple comparisons, and significance was determined with a p value of 0.05 or less.
Experimental Manipulations Seizure Induction
Mice with implanted windows were monitored for at least 5 days under basal conditions and received i.p. injections of either kainic acid at 22–24 mg/kg or pilocarpine at 260–280 mg/kg. For P2Y12-deficient mice, kainic acid was administered at 18–20 mg/kg to allow robust seizures without death, as these mice are more susceptible to kainic-acid-induced seizures ( Eyo et al., 2014 ). Seizure behavior was monitored under a modified Racine scale as follows: (1) freezing behavior; (2) rigid posture with raised tail; (3) continuous head bobbing and forepaws shaking; (4) rearing, falling, and jumping; (5) continuous occurrence of level 4; and (6) loss of posture and generalized convulsion activity ( Eyo et al., 2014 ). Mice that progressed to at least stage 3 were used for subsequent chronic daily imaging of mild (stages 3/4) to severe (stages 5/6) seizures. Whisker Trimming Mice with implanted windows were monitored for at least 5 days under basal conditions, and under anesthesia, all whiskers on the contralateral side to the implanted window were trimmed daily for 5 consecutive days with a clipper (Wahl BravMini).
LPS Treatment
Mice with implanted windows were monitored for at least 3 days under basal conditions and subsequently received i.p. injections of LPS at 2 mg/kg.
Supplementary Material 1 2 3 4 5 6
📊 Figures
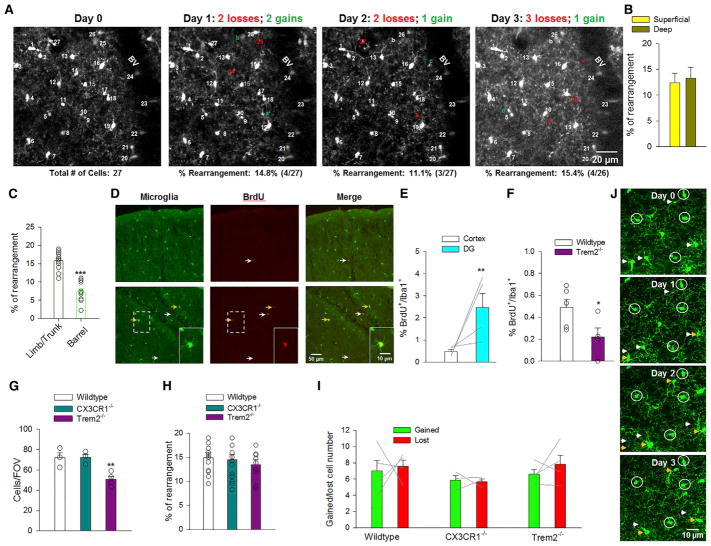
Figure 1
Microglial Landscape Rearrangement via Cell Translocation
(A) Microglia in the healthy cortex during chronic in vivo two-photon imaging showing u2018u2018lostu2019u2019 (red) and u2018u2018gainedu2019u2019 (green) cells. BV, blood vessels. (B) Percentage of ...
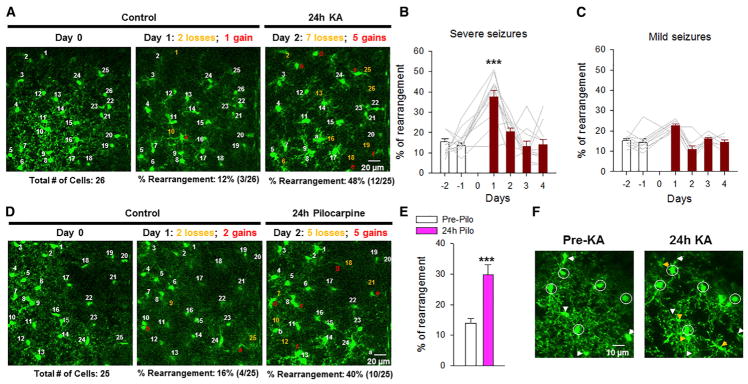
Figure 2
Global Experimental Modulation of the Microglial Landscape
(A) Representative images of microglia in a field of view showing lost cells (yellow) and gained cells (red) under control conditions and then 24 hr after a severe kainic-acid-induced seizure. (B) Per...
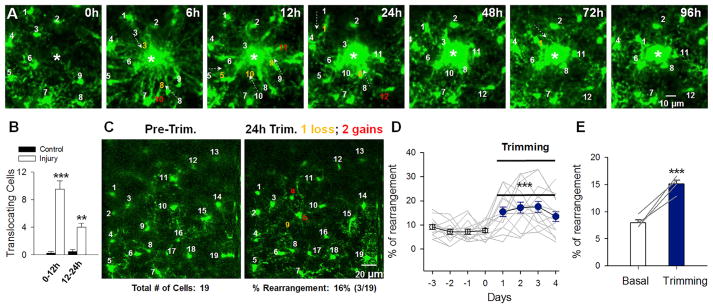
Figure 3
Local Experimental Modulation of the Microglial Landscape
(A) Representative images of microglia in a field of view following a localized laser-induced injury (asterisks) with images taken at 6- to 12-hr intervals following the injury. Microglia show soma tr...
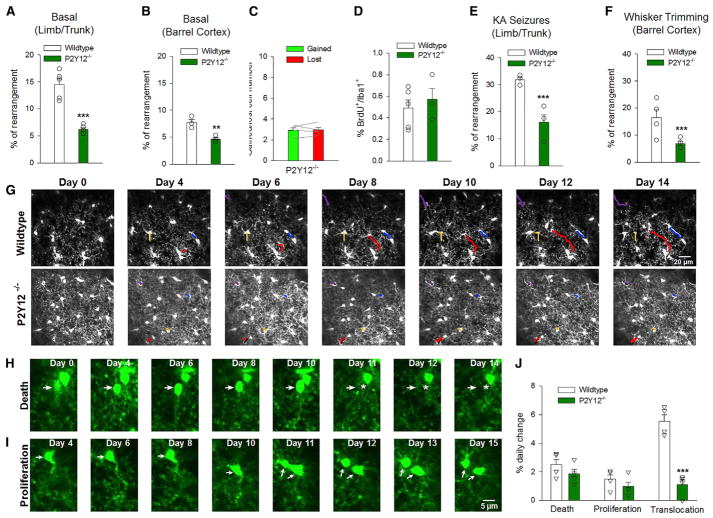
Figure 4
P2Y12 Receptors Regulate the Microglial Landscape
(A) Microglial rearrangement in naive wild-type and P2Y12 u2212/u2212 mice from the limb/trunk cortex (n = 25 FOVs from 7 wild-type and 24 FOVs from 7 P2Y12 u2212/u2212 mice). (B) Microglial rearrange...
Figure images are served from the NIH/NLM PubMed Central Open Access Subset or Europe PMC; copyright remains with the publishers and authors.
💬 Discussion
0 commentsNo comments yet. Be the first to start a discussion!
Leave a Comment