Abstract
Human induced pluripotent stem cells (hiPSCs) offer the potential to study otherwise inaccessible cell types. Critical to this is the directed differentiation of hiPSCs into functional cell lineages. This is of particular relevance to research into neurological disease, such as Parkinson's disease (PD), in which midbrain dopaminergic neurons degenerate during disease progression but are unobtainable until post-mortem. Here we report a detailed study into the physiological maturation over time of human dopaminergic neurons in vitro. We first generated and differentiated hiPSC lines into midbrain dopaminergic neurons and performed a comprehensive characterisation to confirm dopaminergic functionality by demonstrating dopamine synthesis, release, and re-uptake. The neuronal cultures include cells positive for both tyrosine hydroxylase (TH) and G protein-activated inward rectifier potassium channel 2 (Kir3.2, henceforth referred to as GIRK2), representative of the A9 population of substantia nigra pars compacta (SNc) neurons vulnerable in PD. We observed for the first time the maturation of the slow autonomous pace-making (<10 Hz) and spontaneous synaptic activity typical of mature SNc dopaminergic neurons using a combination of calcium imaging and electrophysiology. hiPSC-derived neurons exhibited inositol tri-phosphate (IP3) receptor-dependent release of intracellular calcium from the endoplasmic reticulum in neuronal processes as calcium waves propagating from apical and distal dendrites, and in the soma. Finally, neurons were susceptible to the dopamine neuron-specific toxin 1-methyl-4-phenylpyridinium (MPP+) which reduced mitochondrial membrane potential and altered mitochondrial morphology. Mature hiPSC-derived dopaminergic neurons provide a neurophysiologically-defined model of previously inaccessible vulnerable SNc dopaminergic neurons to bridge the gap between clinical PD and animal models.
🔬 Techniques
🔭 Microscopes
💻 Software
✨ Fluorophores
🧪 Sample Preparation
🔬 Cell Lines
🏭 Microscope Brands
🧪 Reagent Suppliers
📷 Detectors
💻 Software Details
💾 Data Repositories
🏛️ Research Organizations (ROR)
Affiliated research institutions:
📋 Methods
Ethics Statement
Normal human dermal fibroblasts used for reprogramming to pluripotency were purchased from Lonza, who provide the following ethics statement: ‘These cells were isolated from donated human tissue after obtaining permission for their use in research applications by informed consent or legal authorization.’ The human hiPS cell lines derived from these fibroblasts were generated as control lines for part of a larger-scale project (Ethics committee: National Health Service, Health Research Authority, NRES Committee South Central – Berkshire, UK, who specifically approved this part of the study - REC 10/H0505/71).
Generation and Culture of hiPSC
Lines iPS-NHDF-1 and iPS-NHDF-2 were derived from NHDFs (Lonza; CC-2511). Reprogramming plasmids were obtained from Addgene (17220: pMXs-hc-MYC, 17219: pMXs-hKLF4, 17218: pMXs-hSOX2, 17217: pMXs-hOCT3/4, 13354: pMXs-Nanog) [14] and packaged using the Plat-GP retroviral packaging cell line. Fibroblasts were infected on days 0 and 1with 5 µg/ml polybrene and spinoculation (1200×g for 45 minutes at 16°C). They were transferred onto mitomycin C-inactivated mouse embryonic feeder cells (MEFs; outbred Swiss mice [15] , [16] established and maintained at the Department of Pathology, Oxford) on 0.1% gelatin coated plates on day 4. From day 5 onwards, cells were cultured in KnockOut™ serum replacement medium (Life Technologies) supplemented with 50 µg/ml ascorbic acid and 0.5 µM valproic acid. Medium was replaced (50%) on alternate days, and substituted with MEF-conditioned medium from day 10 onwards. Colonies displaying iPSC morphology were picked on day 28 and transferred onto MEFs by manual dissection every 5–7 days. Prior to differentiation, iPSC lines were adapted to feeder-free conditions onto Matrigel-coated plates (BD Matrigel hESC-qualified Matrix) in mTeSR™1 (StemCell Technologies) supplemented with Rock inhibitor Y27632 (10 µM; Calbiochem) on the day of passage.
Show full methods section
Ethics Statement
Normal human dermal fibroblasts used for reprogramming to pluripotency were purchased from Lonza, who provide the following ethics statement: ‘These cells were isolated from donated human tissue after obtaining permission for their use in research applications by informed consent or legal authorization.’ The human hiPS cell lines derived from these fibroblasts were generated as control lines for part of a larger-scale project (Ethics committee: National Health Service, Health Research Authority, NRES Committee South Central – Berkshire, UK, who specifically approved this part of the study - REC 10/H0505/71).
Generation and Culture of hiPSC
Lines iPS-NHDF-1 and iPS-NHDF-2 were derived from NHDFs (Lonza; CC-2511). Reprogramming plasmids were obtained from Addgene (17220: pMXs-hc-MYC, 17219: pMXs-hKLF4, 17218: pMXs-hSOX2, 17217: pMXs-hOCT3/4, 13354: pMXs-Nanog) [14] and packaged using the Plat-GP retroviral packaging cell line. Fibroblasts were infected on days 0 and 1with 5 µg/ml polybrene and spinoculation (1200×g for 45 minutes at 16°C). They were transferred onto mitomycin C-inactivated mouse embryonic feeder cells (MEFs; outbred Swiss mice [15] , [16] established and maintained at the Department of Pathology, Oxford) on 0.1% gelatin coated plates on day 4. From day 5 onwards, cells were cultured in KnockOut™ serum replacement medium (Life Technologies) supplemented with 50 µg/ml ascorbic acid and 0.5 µM valproic acid. Medium was replaced (50%) on alternate days, and substituted with MEF-conditioned medium from day 10 onwards. Colonies displaying iPSC morphology were picked on day 28 and transferred onto MEFs by manual dissection every 5–7 days. Prior to differentiation, iPSC lines were adapted to feeder-free conditions onto Matrigel-coated plates (BD Matrigel hESC-qualified Matrix) in mTeSR™1 (StemCell Technologies) supplemented with Rock inhibitor Y27632 (10 µM; Calbiochem) on the day of passage.
Assessment of Genome Integrity
Genome integrity was assessed by an Illumina Human CytoSNP-12v2.1 beadchip array (∼300,000 markers) and analysed using KaryoStudio software (Illumina). The iPSC lines were also subjected to M-FISH analysis of metaphase chromosomal spreads, as described previously [17] . Multiple metaphases (>30) per iPSC line were assessed. PluriTest RNA was extracted from iPS-NHDF-, iPS-NHDF-2 and iPS-DF19.9.11TH using an RNeasy kit (Qiagen) for Illumina HT12v4 transcriptome array analysis. The data files were then uploaded to www.pluritest.org and scored for pluripotency, as previously described [18] .
Generation of Embryoid Bodies
Feeder-free iPSCs were dissociated with TryplE and seeded into Aggrewell plates (10,000 cells per EB; Stem Cell Technologies) in mTeSR™-1 medium supplemented with Y27632 (10 µM). EBs were harvested after 4 days (75% daily mTeSR-1 medium change) and differentiated as appropriate. Differentiation to 3 Germ Layers Embryoid bodies were directed to neurectoderm by culture on gelatin-coated coverslips in dopaminergic differentiation medium (described below). Mesodermal cells were differentiated in EB media (KO-DMEM supplemented with 2 mM glutamax, 1% non-essential amino acids, 55 µM 2-mercaptoethanol, 0.5 mM ascorbic acid, 100 U/ml penicillin/100 µg/ml streptomycin, and foetal calf serum (10% [v/v]; HyClone). Endoderm was differentiated as for mesoderm but without ascorbic acid. Differentiation into Midbrain Dopaminergic Neurons All materials obtained from Life Technologies unless otherwise stated. Briefly, EBs were plated onto Geltrex-coated plates in Neural Induction medium 1 (DMEM/F12 supplemented with L-glutamine [2 mM], N2 supplement, bovine serum albumin [1 mg/ml], Y27632 [10 µM; Tocris], SB431542 [10 µM, Tocris], noggin [200 ng/ml] and antibiotic/antimycotic [1% v/v]). After 4 days, medium was changed to Neural Induction medium 2 (as NI1, without SB431542 and noggin, with the addition of sonic hedgehog [SHH C24II], 200 ng/ml; R&D Systems) and incubated for 6 days. Medium was then additionally supplemented with fibroblast growth factor-8a (FGF8a, 100 ng/ml; R&D Systems), heparin (5 µg/ml; Sigma), ascorbic acid (200 µM; Sigma) and brain derived neurotrophic factor (BDNF, 20 ng/ml) and maintained for 7–14 days, depending upon appearance of neural rosette structures. Neural progenitor cells were manually passaged and replated onto poly-D-lysine/laminin-coated plates in final differentiation medium (DMEM/F12 supplemented with L-glutamine [2 mM], N2 supplement, BDNF [20 µg/ml], glial-derived neurotrophic factor [GDNF, 20 µg/ml], N 6 ,2′-O-dibutyryladenosine 3′,5′-cyclic monophosphate sodium salt [dCAMP, 0.5 mM; Sigma], laminin [1 µg/ml] and antibiotic/antimycotic (1% [v/v]). Neurons were matured for a further 2–6 weeks in this medium (total time in culture 4–10 weeks) before experimental procedures were carried out. Total time in culture from the initiation of neuralisation (EB stage) is 4–10 weeks.
RT-PCR Analysis
RNA was extracted from cells using Trizol (Life Technologies) and purified using the RNeasy kit (QIAGEN). Reverse transcription was performed using Superscript III (Life Technologies) according to manufacturer’s instructions. Polymerase chain reactions (PCR) were set up as follows: cDNA (25 ng), AmpliTaq Gold 10x buffer (Applied Biosystems), MgCl 2 (1.5 mM), forward and reverse primers (1 µM each), dNTP mix (0.5 mM; Life Technologies) and 1 U Taq polymerase (AmpliTaq Gold, Applied Biosystems). Primer sequences are detailed in Table S1 .
Immunocytochemistry
Cells were fixed in 4% paraformaldehyde and permeabilised in 0.1% Triton-X100 prior to immunostaining, except in the case of dopamine staining where cells were fixed according to the following protocol: Cells were washed in ‘pre-fix solution’ (0.1 M cacodylate and 1% sodium metabisulphite [w/v], pH 6.2) then fixed in 3% [v/v] glutaraldehyde solution (pH 7.5) for 15 minutes. Coverslips were then washed 3 times in ‘post-fix solution’ (0.05 M tris and 0.85% [w/v] sodium metabisulfite, pH 7.5). A reduction step was carried out in 0.1 M sodium borohydride for 10 minutes prior to following the conventional immunostaining protocol. Briefly, coverslips were blocked in 10% goat or donkey serum for 1 hour before incubating with primary antibodies overnight at 4°C. Antibodies used as follows: α-sarcomeric actin (Sigma), FOXA2 (1∶250; R&D systems), Tuj1 (1∶500; Covance), TH (1∶500; Millipore), α-synuclein (1∶500; BD biosciences), LRRK2 (1∶1000; Epitomics), Tau (1∶700, a kind gift from Peter Davies), dopamine (1∶500, Abcam), SV2B (1∶200, Synaptic Systems), IP 3 /BM (a generous gift from Dr Stuart Conway, University of Oxford), DAT (1∶500; Alpha Diagnositcs), GIRK2 (1∶200; Abcam), VMAT2 (1∶500, Chemicon), Glucocerobrosidase (1∶1000, Abcam), PITX3 (1∶100, Life Technologies) and NURR1 (1∶400, Millipore).
Secondary antibodies
(Alexa fluor, Life Technologies) were incubated for 1 hour at room temperature before mounting and analysis. Images were captured on the Leica SP5 confocal microscope. For quantification, multiple random fields (5–10 per coverslip) were imaged from at least 3 independent differentiations.
Western Blot Analysis
Western blotting was carried out on whole cell lysates that had been extracted using RIPA buffer (tris [50 mM, pH 8], sodium chloride [150 mM], sodium dodecyl sulphate [SDS; 0.1% w/v], sodium deoxycholate [0.5% w/v] and nonidet-P40 [1% w/v]). Before loading, samples were denatured. Protein separation was achieved using SDS polyacrylamide gel electrophoresis and transferred onto PVDF membrane. Antibodies used as follows: TH (1∶500; Millipore), Dopa decarboxylase (1∶1000; Millipore), DAT (1∶1000; Thermoscientific). High Performance Liquid Chromatography (HPLC) Dopamine content was analysed using HPLC with electrochemical detection. Differentiated neurons were harvested in 0.1 M perchloric acid. Lysate was filtered and injected into the HPLC system via an autosampler (Jasco) and monoamines separated on a 250 mm Microsorb C18 reverse-phase column and detected with an LC-4B electrochemical detector (Decade SDC, Antec). The mobile phase consisted of methanol (13% v/v), NaH 2 PO 4 (120 mM), EDTA (0.8 mM), and sodium octane sulfonate (3.2 mM) at pH 3.27. The flow rate was fixed at 1 ml/min and dopamine content determined by comparing samples to standard solutions. Corresponding dopamine content normalised to protein. DAT Function Functional dopamine active transporter (DAT) activity was quantified by incubating differentiated cultures in the presence of 3 H-DA (10 nM, GE Healthcare). Briefly, neurons were washed once with PBS prior to addition of 3 H-DA either in the presence or absence of mazindol (10 µM, Sigma). For each experimental well, 1 ml of 3H-DA mixture was added for the required time before removal. Uptake was stopped by the addition of ice-cold PBS followed by lysis in sodium hydroxide (1 M). A small sample was retained for protein analysis whilst the remainder was diluted with 5 ml scintillation fluid (OptiPhase SuperMix, Perkin-Elmer) and quantified using a scintillation counter (Beckman Coulter).
Whole Cell Patch Clamp Recordings
Electrophysiological experiments were performed on 6–10 week differentiated neurons at 32°C. Intracellular recordings were obtained using Axon Instruments Multiclamp 700B amplifier and digitized at 10–20 kHz (Digidata 1440A). Extracellular solution was as follows (mM): 129 NaCl, 5 KCl, 2 CaCl 2 , 1 MgCl 2 , 30 Glucose, 25 HEPES, pH 7.4. Whole-cell patch-clamp electrodes (4–7 MΩ) were filled with 120 mM K D-gluconate, 25 mM KCl, 4 mM MgATP, 2 mM NaGTP, 4 mM Na2-phospho-creatin, 10 mM EGTA, 1 mM CaCl2 and 10 mM HEPES (pH 7.4 with KCl at 25°C). Biocytin (0.1%) was added to the pipette solution to mark the recorded neuron for later cytochemical characterization. Spontaneous postsynaptic currents measured under this experimental condition at −70 mV are a superposition of mEPSCs. Further analysis and statistics were performed using IgorPRO (Wavemetrics) with custom-written scripts. Ca 2+ Imaging Neurons were loaded with Fluo 4-AM (5 µM, Life Technologies) for 60 min in HBSS supplemented with 10 mM HEPES. Fluorescence microscopy was performed using a Nikon TE 2000 inverted microscope and an EMCCD camera (Evolve 128, Photometrics) imaging fluorescence emission (510–600 nm) at a frame rate of 100 s −1 at 37°C. Fluorescence measurements are expressed as a ratio (ΔF/F o ) of the mean change in fluorescence (ΔF) relative to the resting fluorescence before stimulation (F o ). Mean values of F o were obtained by averaging over several scans/frames before stimulation. Measurements of Mitochondrial Membrane Potentials (ΔΨ) Mitochondrial ΔΨ was measured by loading cells with 20 nM tetramethyl rhodamine methyl ester (TMRM, Life Technologies) for 30 min at 37°C. Images were taken by the same inverted microscope described above equipped with objective lenses (20x, N.A. 0.75 and 40x, N.A. 1.30). TMRM excitation (560 nm) and emission (590–650 nm) was measured. Carbonyl cyanide p-trifluoromethoxyphenylhydrazone (CCCP (10 µM; Life Technologies) was added to collapse membrane potential.
Supporting Information Figure S1 Further characterisation of hiPSC lines. A) RT-PCR for expression of endogenous pluripotency genes once reprogramming had been completed: Oct, Sox, Klf, Myc and Nanog. cDNA template for each hiPSC line (‘C’). Negative controls consisted of RNA template (‘R’) for each hiPSC line; no template (H 2 O); Plasmid = pMXS+exogenous version of the relevant pluripotency gene. The hESC line, HUES2 serves as a positive control; the parental fibroblast line, NHDF, is also shown. B) qRT-PCR to assess silencing of the 5 exogenous transgenes in the derived hiPSC lines, relative to NHDF+Y (NHDF infected with all 5 reprogramming vectors then harvested at day 5); parental, uninfected NHDF are also shown. C) DNA Fingerprinting using PowerPlex® 16 HS System for detection of sixteen loci to confirm that the lines iPS-NHDF-1 and iPS-NHDF-2 derive from the parent fibroblasts NHDF. (TIF) Click here for additional data file. Figure S2 Rock inhibitor increases NPC proliferation. Embryoid bodies were plated on Geltrex-coated dishes in medium either in the presence or absence of Rock inhibitor (Y27632). Images were taken 4 days later and show dramatically increased area of cell growth in the presence of Rock inhibitor compared with EBs grown in its absence. Scale bar: 250 µm. (TIF) Click here for additional data file. Figure S3 Further quantification of midbrain DA neuronal cultures. A) Cell counts were performed using immunostaining for GIRK2 and TH in order to quantify A9 dopaminergic neuronal differentiation. A large proportion of the cells expressed GIRK2, but the total number of GIRK2+TH-positive cells was relatively low in comparison to the entire cell population. However, over half of the cells which expressed TH also expressed GIRK2, indicating a large proportion of our differentiated midbrain DA neurons are of the A9 phenotype. B) Similar analysis was carried out for FOXA2 and it was again found that a large proportion of the TH+ neurons were also FOXA2 positive. (TIF) Click here for additional data file. Figure S4 Post-hoc identification of TH+ neurons following whole-cell patch clamp experiments. In order to demonstrate the presence of TH+ neurons in whole cell patch clamp experiments, a sample of neurons was post-hoc labelled. The recording electrode was filled with biocytin which diffused into the patched cell during recording. Neuronal cultures were fixed and stained for TH (green) and biocytin is shown in red. * indicates a successfully patched TH+ neuron. From this sample, 22.2% of patched cells were TH+. (TIF) Click here for additional data file. Figure S5 Expression of Parkinson’s disease-related proteins in differentiated midbrain neurons. Immunostaining of differentiated neurons shows that proteins that have been implicated in the pathology of Parkinson’s disease are expressed in these cells. A: α-synuclein; B: LRRK2; C: Tau; D: GBA. Scale bars: 20 µm. (TIF) Click here for additional data file. Table S1 RT-PCR primers used for characterising differentiated hiPSC cultures. (DOC) Click here for additional data file. Table S2 Karyostudio Detected Regions Report for NHDF Lonza and derived hiPSc lines. Detected Regions autosomal differences between NHDF Lonza parental fibroblasts and derived hiPSC lines are reported here. (DOC) Click here for additional data file. Methods S1 Further Characterisation of iPSC lines. Methods for assessing the activation/silencing of pluripotency genes and for DNA fingerprinting. (DOC) Click here for additional data file. Video S1 Mature spontaneous Ca 2+ signals recorded from differentiated neurons. Ca 2+ signals were observed in mature neuronal cultures (>8 weeks differentiation) and are most likely associated with action potential firing. Autonomous pacemaking Ca2+ firing was observed in both the neuronal processes and the cell bodies in these neurons. (WMV) Click here for additional data file.
📊 Figures
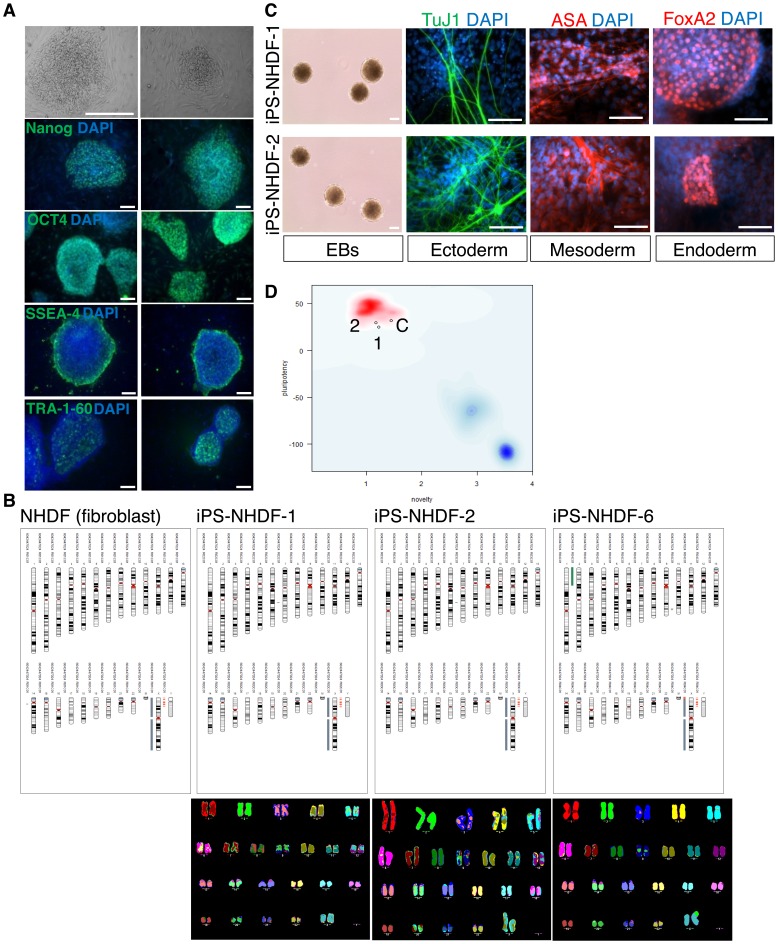
Figure 1
Characterisation of hiPSC lines derived from normal dermal human fibroblasts.
A) Two hiPSC lines were selected for in-depth analyses, NHDF-1 and NHDF-2. These reprogrammed colonies showed hESC-like morphology, for example, tightly packed colonies with high nucleus to cytoplasm ...
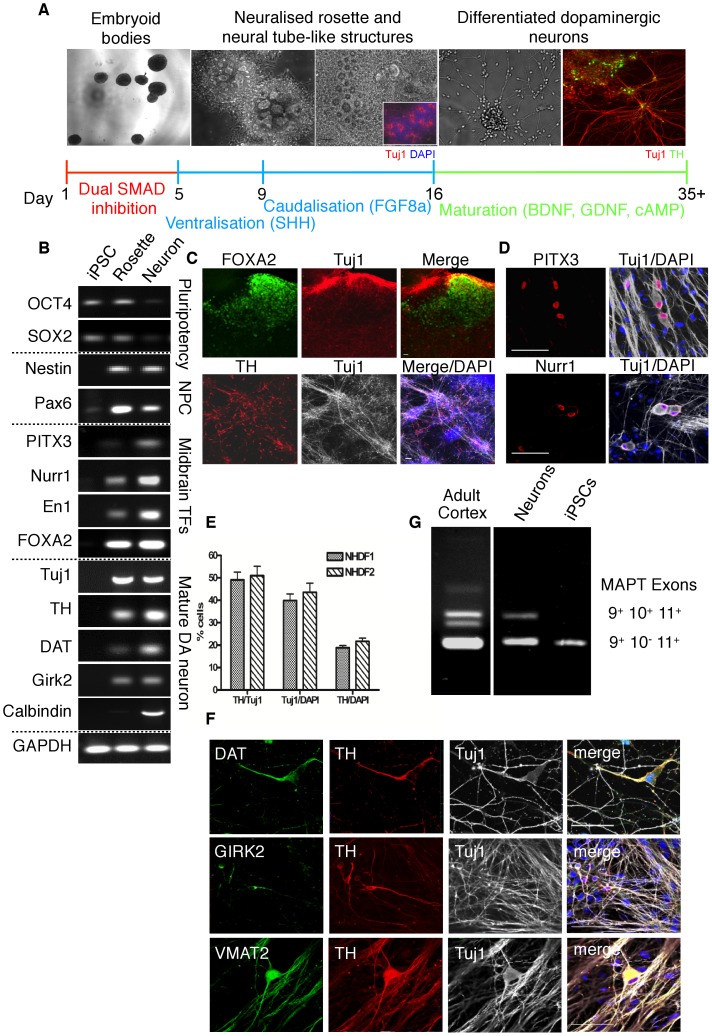
Figure 2
Differentiation of human dopaminergic neurons.
A) hiPS cells were directed to differentiate into dopaminergic neurons. Following midbrain patterning, neural progenitor cells were manually passaged (day 16+). Dopaminergic neurons were matured for a...
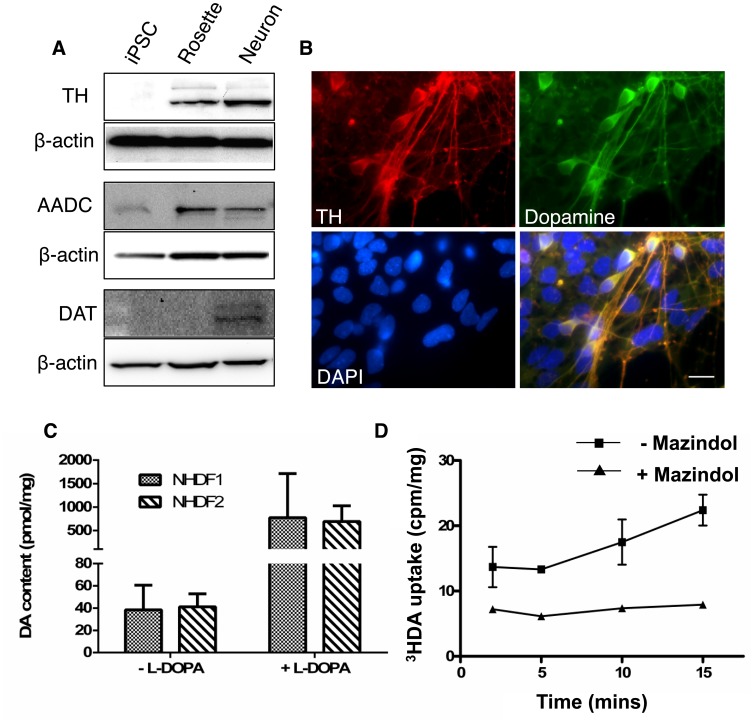
Figure 3
Functional dopamine synthesis and homeostasis in differentiated neuronal cultures.
A) Western blot analysis of proteins involved in dopamine synthesis and homeostasis in cells at different stages of maturation (EB: day 0, Rosette: day 16, Neuron: day 35). hiPSCs do not express TH, D...
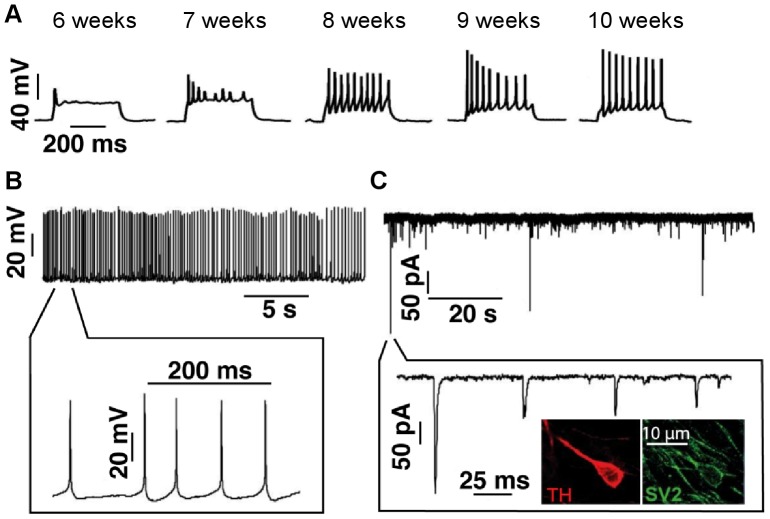
Figure 4
Functional characterisation of the maturation of human midbrain neuronal cultures.
(A) Representative current-clamp recordings (400 ms current pulses and inj 40u201350 pA) from hiPSC-derived neurons at specified time points (from left panel: 6, 7, 8, 9, and 10 weeks in culture). Neu...
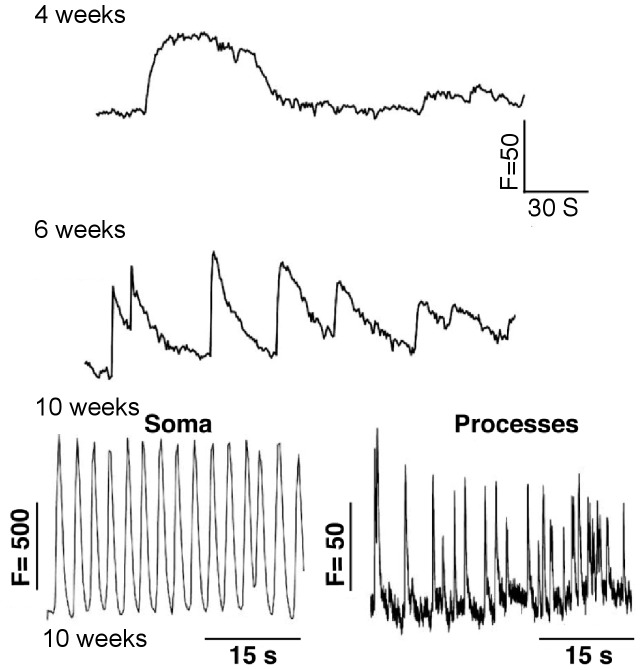
Figure 5
Dynamic changes in Ca 2+ signals during neuronal maturation.
Traces show recordings of spontaneous changes in Ca 2+ signals after induction of neuronal differentiation from hiPS cells into dopaminergic neurons. Progressive changes in their kinetics were observe...
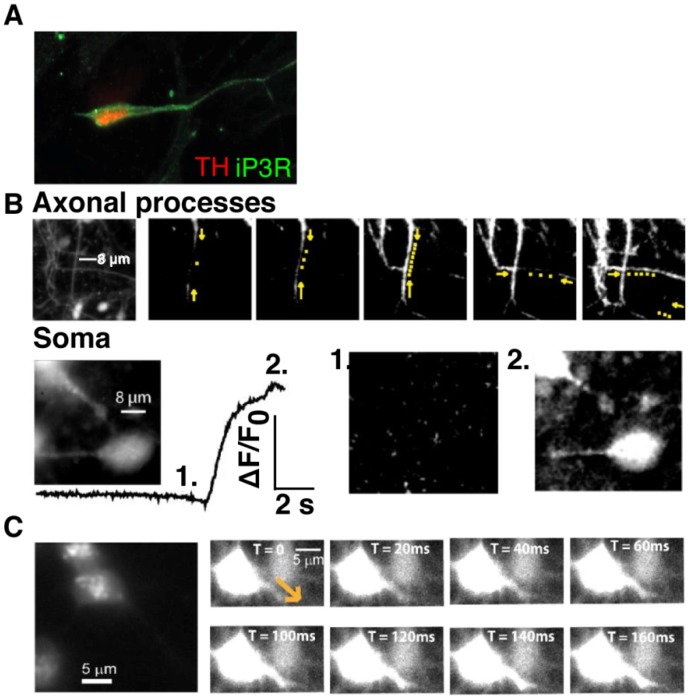
Figure 6
Spontaneous intracellular calcium signals in human hiPS cell-derived neurons.
(A) Immunostaining in fixed TH-positive neurons (red) expressed inositol tri-phosphate receptors (IP 3 Rs) in both the soma and in dendritic processes (green). Live cell imaging showed that IP 3 -BM-e...
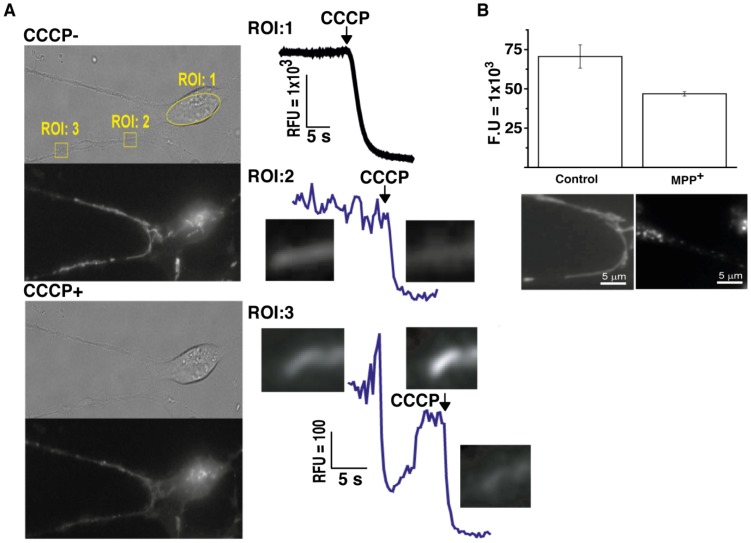
Figure 7
Measurements of mitochondrial membrane potentials and their sensitivity to MPP + .
(A) Differentiated human neuronal cultures were loaded with mitochondrial membrane indicator TMRM. Changes in fluorescence were measured before (left upper) and after (left lower) application of the m...
Figure images are served from the NIH/NLM PubMed Central Open Access Subset or Europe PMC; copyright remains with the publishers and authors.
💬 Discussion
0 commentsNo comments yet. Be the first to start a discussion!
Leave a Comment