Abstract
Antibody therapy of cancer is increasingly used in the clinic and has improved patient's life expectancy. Except for immune checkpoint inhibition, the mode of action of many antibodies is to recognize overexpressed or specific tumor antigens and initiate either direct F(ab')2-mediated tumor cell killing, or Fc-mediated effects such as complement-dependent cytotoxicity (CDC) and antibody-dependent cell-mediated cytotoxicity/phagocytosis (ADCC/P) after binding to activating Fc receptors. All antibodies used in the clinic are of the IgG isotype. The IgA isotype can, however, also elicit powerful anti-tumor responses through engagement of the activating Fc receptor for monomeric IgA (FcαRI). In addition to monocytes, macrophages and eosinophils as FcαRI expressing immune cells, neutrophils are especially vigorous in eliminating IgA opsonized tumor cells. However, with IgG as single agent it appears almost impossible to activate neutrophils efficiently, as we have visualized by live cell imaging of tumor cell killing. In this study, we investigated Fc receptor expression, binding and signaling to clarify why triggering of neutrophils by IgA is more efficient than by IgG. FcαRI expression on neutrophils is ~2 times and ~20 times lower than that of Fcγ receptors FcγRIIa and FcγRIIIb, but still, binding of neutrophils to IgA- or IgG-coated surfaces was similar. In addition, our data suggest that IgA-mediated binding of neutrophils is more stable compared to IgG. IgA engagement of neutrophils elicited stronger Fc receptor signaling than IgG as indicated by measuring the p-ERK signaling molecule. We propose that the higher stoichiometry of IgA to the FcαR/FcRγ-chain complex, activating four ITAMs (Immunoreceptor Tyrosine-based Activating Motifs) compared to a single ITAM for FcγRIIa, combined with a possible decoy role of the highly expressed FcγRIIIb, explains why IgA is much better than IgG at triggering tumor cell killing by neutrophils. We anticipate that harnessing the vast population of neutrophils by the use of IgA monoclonal antibodies can be a valuable addition to the growing arsenal of antibody-based therapeutics for cancer treatment.
🔬 Techniques
🔭 Microscopes
💻 Software
✨ Fluorophores
🧪 Sample Preparation
🔬 Cell Lines
🏭 Microscope Brands
🧪 Reagent Suppliers
📷 Detectors
🔎 Objectives
💻 Software Details
🏛️ Research Organizations (ROR)
Affiliated research institutions:
📋 Methods
Reagents, Antibodies Antibodies: to target human CD20, rituximab (Roche), anti-CD20-IgA1 (invivogen, hcd20-mab6), or in-house made mAbs ( 26 ) were used. For HER2, anti-HER2 IgG1 antibody trastuzumab (Roche), anti-HER2 IgA1 or IgA2 antibody was used and for EGFR, anti-EGFR IgG1 antibody cetuximab (Merck) or anti-EGFR IgA2 was used. Anti-HER2 or EGFR IgA's were made as described before ( 11 ). 3G8 F(ab′) 2 (anti-FcγRIII) was generated by pepsin protease procedure of purified 3G8 from hybridoma supernatant. Rabbit anti-ERK (9101S) and rabbit anti-p-ERK (9102S) both from Cell Signaling Technology, anti-β-Actin (Sigma-Aldrich, A2228), anti-rabbit IgG HRP (Santa Cruz, sc-2004), goat anti-mouse IgG HRP (Santa Cruz, sc-2005), Strep-Tactin HRP (Bio-Rad Laboratories, 16-10380) were used for Western blot detection. The Qifikit (DAKO) was used to determine the number of FcγRs on primary neutrophil isolates using anti-CD64 (clone 10.1, Serotec), anti-CD89 (clone A59, BD Pharmingen), anti-CD32a (clone IV.3, Stemcell Technologies), anti-CD16 (clone 3G8, Stemcell Technologies), and anti-CD32a/b (clone AT10, Santa Cruz Biotechnology or clone KB61, DAKO). Pharmacological compounds Wortmannin (Sigma-Aldrich), LY294002, and U0126 (Calbiochem) were used to inhibit ITAM signaling in 51 Cr release assays. Calcein-AM (Life Technologies) was used to fluorescently label target cells or neutrophils according to the manufacturers protocol. TO-PRO TM -3 (molecular probes) was used at 1:1000 dilution to detect DNA that becomes accessible during live-cell imaging ( Figure 1E , Videos S1 , S2 ). Figure 1 IgA mediates higher tumor cell lysis than IgG with human neutrophils. (A–D) Specific lysis of tumor cells by isolated human neutrophils (E:T = 40:1) using a 4 h 51 Cr release assay. Anti-CD20 Abs were used for Ramos and EL4-CD20, anti-HER2 Abs were used for SK-BR-3 and Ba/F3-HER2, anti-EGFR Abs were used for A431 and A1207 target cells. (A–C) Specific lysis of indicated target cells using a broad titration range of IgA and IgG antibodies. (D) Antibody concentrations were identical (10 μg/mL) for IgG and IgA antibodies against all target cells except for Ramos (13.3 μg/mL) and A1207 cells (1 μg/mL). Ctrl indicates condition without antibody (or 0.001 μg/mL IgG1-anti-CD20 for Ramos cells). One representative graph is shown for n = 4–6 independent experiments with different healthy donors. p < 0.001: *** , p < 0.0001: **** , unpaired Student's t test. (E) Stills from live cell microscopy of adhered A431-HER2 cells (calcein labeled) and neutrophils in the presence of 5 μg/mL anti-HER2 IgA2 or IgG (Trastuzumab) and TO-PRO-3 (red fluorescence), time in minutes, image acquisition every 30 s for 1.5 h.
Show full methods section
Reagents, Antibodies Antibodies: to target human CD20, rituximab (Roche), anti-CD20-IgA1 (invivogen, hcd20-mab6), or in-house made mAbs ( 26 ) were used. For HER2, anti-HER2 IgG1 antibody trastuzumab (Roche), anti-HER2 IgA1 or IgA2 antibody was used and for EGFR, anti-EGFR IgG1 antibody cetuximab (Merck) or anti-EGFR IgA2 was used. Anti-HER2 or EGFR IgA's were made as described before ( 11 ). 3G8 F(ab′) 2 (anti-FcγRIII) was generated by pepsin protease procedure of purified 3G8 from hybridoma supernatant. Rabbit anti-ERK (9101S) and rabbit anti-p-ERK (9102S) both from Cell Signaling Technology, anti-β-Actin (Sigma-Aldrich, A2228), anti-rabbit IgG HRP (Santa Cruz, sc-2004), goat anti-mouse IgG HRP (Santa Cruz, sc-2005), Strep-Tactin HRP (Bio-Rad Laboratories, 16-10380) were used for Western blot detection. The Qifikit (DAKO) was used to determine the number of FcγRs on primary neutrophil isolates using anti-CD64 (clone 10.1, Serotec), anti-CD89 (clone A59, BD Pharmingen), anti-CD32a (clone IV.3, Stemcell Technologies), anti-CD16 (clone 3G8, Stemcell Technologies), and anti-CD32a/b (clone AT10, Santa Cruz Biotechnology or clone KB61, DAKO). Pharmacological compounds Wortmannin (Sigma-Aldrich), LY294002, and U0126 (Calbiochem) were used to inhibit ITAM signaling in 51 Cr release assays. Calcein-AM (Life Technologies) was used to fluorescently label target cells or neutrophils according to the manufacturers protocol. TO-PRO TM -3 (molecular probes) was used at 1:1000 dilution to detect DNA that becomes accessible during live-cell imaging ( Figure 1E , Videos S1 , S2 ). Figure 1 IgA mediates higher tumor cell lysis than IgG with human neutrophils. (A–D) Specific lysis of tumor cells by isolated human neutrophils (E:T = 40:1) using a 4 h 51 Cr release assay. Anti-CD20 Abs were used for Ramos and EL4-CD20, anti-HER2 Abs were used for SK-BR-3 and Ba/F3-HER2, anti-EGFR Abs were used for A431 and A1207 target cells. (A–C) Specific lysis of indicated target cells using a broad titration range of IgA and IgG antibodies. (D) Antibody concentrations were identical (10 μg/mL) for IgG and IgA antibodies against all target cells except for Ramos (13.3 μg/mL) and A1207 cells (1 μg/mL). Ctrl indicates condition without antibody (or 0.001 μg/mL IgG1-anti-CD20 for Ramos cells). One representative graph is shown for n = 4–6 independent experiments with different healthy donors. p < 0.001: *** , p < 0.0001: **** , unpaired Student's t test. (E) Stills from live cell microscopy of adhered A431-HER2 cells (calcein labeled) and neutrophils in the presence of 5 μg/mL anti-HER2 IgA2 or IgG (Trastuzumab) and TO-PRO-3 (red fluorescence), time in minutes, image acquisition every 30 s for 1.5 h.
Primary Neutrophils and Cell Lines
Neutrophil cell fraction was isolated from blood of healthy donors (in agreement with ethical committee of the Utrecht university medical center and after written informed consent from the subjects in accordance with the Declaration of Helsinki) using standard Ficoll/Histopaque density block gradient centrifugation (Ficoll-paque was from GE healthcare, ref. 17-1440-03, Histopaque-1119 was from Sigma-Aldrich ref. 11191) followed by lysis of the red blood cells in ammonium buffer (155 mM NH 4 Cl, 10 mM KHCO 3 , 0.037 mg/mL Na 2 EDTA, pH 7.4) for 10 min on ice. Neutrophils were preserved in complete medium (RPMI 1640 from Gibco supplemented with glutamine, 100 U/mL penicillin and 100 μg/mL streptomycin from Life Technologies) before use on the same day unless stated otherwise. EL4-CD20, Ba/F3-HER2, and A431-HER2 cells (ATCC) were generated by retroviral transduction as described before ( 18 ). Ramos, Daudi, SK-BR-3, A431 (ATCC), and the above-mentioned cells were cultured in complete medium at 37°C and 5% CO 2 .
Live-Cell Imaging
For live-cell imaging, a Deltavision RT widefield microscope (GE Healthcare) equipped with a conditioned imaging chamber set to 37°C and 5% CO 2 was used. Time-lapse imaging was performed using an Olympus 40×/1.35 NA (numerical aperture) oil immersion objective ( Figure 1E , Videos S1 , S2 ) or an Olympus 20×/0.75 NA objective ( Figure S1 , Videos S3 – S5 ) and images were recorded on a Cascade II EM-CCD camera (Photometrics). For Videos S1 , S2 , the A431 cells were seeded in a 6-channel μ-slide (Ibidi) the day before calcein labeling and live cell imaging. Target cells in Videos S3 – S5 were harvested and cytosolically labeled with calcein-AM and allowed to interact with primary neutrophils together with mAbs for up to 2 h in the 6-channel μ-slide. Image acquisition (30–60 s between frames) started as soon as possible upon addition of the mAbs. Imaging data was processed using SoftWoRx (AppliedPrecision) or Imaris (Bitplane).
Human Neutrophil ADCC
ADCC with 51 Cr-labeled target cells was described previously ( 18 ). Briefly, 1 × 10 6 target cells were labeled with 100 μCi (3.7 MBq) 51 Cr for 2 h in complete medium. After extensive washing, cells were adjusted to 10 5 /mL. Neutrophils, mAbs at various concentrations, medium, and 5,000 tumor cells per well were added to round-bottom microtiter plates (Corning Incorporated) using a maximum E:T = 40:1 ratio. When indicated, neutrophils were preincubated for 15 min at RT with inhibitors of signaling molecules before they were added to the plate. After 4 h of incubation at 37°C, 51 Cr release was measured in counts per minute (cpm). The percentage of specific lysis was calculated using the following formula: % lysis = [(counts of sample–minimum release)/(maximum release–minimum release)] × 100. Target cells with neutrophils in complete medium or supplemented with 5% Triton X-100 (Roche Diagnostics) were used to determine minimum and maximum release, respectively. Binding of Neutrophils on Antibody-Coated Plastic Surface For binding assays in 96-wells flat bottom maxisorp plates, wells were coated with 100 μL 10 μg/mL antibody in carbonate buffer (Sigma, C3041-50CAP) O/N at 4°C. Plates were washed with 100 μL complete culture medium, blocked for 1 h with 1% BSA and washed again with culture medium before adding the cells. Neutrophils were isolated from blood and labeled with 10 μM Calcein-AM in PBS at 37°C for 20 min. Cells were washed two times with complete medium and rested for 30 min at 37°C at a density of 3 × 10 6 cells/mL. 100 μL neutrophil suspension was added per well and centrifuged gently (~50 × g) for 3 min. The plate was incubated at 37°C for 40 min. Fluorescence was measured in a Clariostar fluorescence scanner. After measurement, the plate was washed with 100 μL RPMI. Measurements were repeated every 2 washes and this was repeated at least 12 times. Bead Binding to Neutrophils (Rosettes) The rosette assay using Dynabeads was adapted from a previously described protocol ( 27 ). Epoxy-Dynabeads (4.5 mm) were coupled to either anti-CD20 mAbs UMAB002 IgG1, UMAB002 IgA2, anti-HER2 mAbs trastuzumab (Herceptin) IgG1, anti-HER2 IgA2 (own production), or human serum albumin (Albuman ® , Sanquin) following the manufacturer's instructions (Thermo Fisher Scientific). Labeling of the beads was checked with RPE-labeled anti-IgA (Southern Biotech, 2052-09), and PE-labeled anti-IgG (Southern Biotech, 2042-09). To allow bead binding, 50 μl 2 × 10 6 cells/mL neutrophils in ice-cold PBS containing 0.5% BSA were pipetted in a round bottom 96-wells plate (Greiner) on ice. 50 μL 1 × 10 7 beads/mL bead suspension in PBS containing 0.5% BSA was added to the cells. Beads were either coated with anti-CD20 or anti-HER2 IgG1 or IgA2. Plates were incubated on a shaker (800 RPM) at 4°C for at least 30 min. The plate was then incubated at 37°C for 10 min and immediately put on ice. After centrifugation and supernatant removal, the samples were fixed in 3% PFA in PBS containing 0,5% BSA for 15 min at RT. The fixed cell/bead mixture was transferred to a flat-bottom 96-wells plate, centrifuged (~50 × g) for 3 min and images were taken with brightfield microscopy (EVOSRXLCore) and analyzed using Adobe Photoshop using raster blocks of 11 × 11 cm. Cells were counted manually and the percentage of cells bound to 5 or more beads was calculated per image, for 3 images per condition. Real-Time Tracing of Antibody-Mediated Cell-Cell Interactions Daudi cells were adhered in quarters A&C of LigandTracer Multidishes 2 × 2 (non-treated, Ridgeview Instruments AB) with the help of a biomolecular anchor molecule (SUNBRIGHT ® OE-040CS, NOF Corporation), essentially as previously described ( 28 ). Per immobilization spot, 400 μl BAM solution (4 mg/ml, dissolved in MQ water) was incubated for 1 h at room temperature and after removal of the BAM solution 400 μl cell suspension (1.5 × 10 6 cells/ml in PBS) was added and cells were left to adhere for 40 min. Prepared cell dishes were kept in complete medium in the incubator and used for experiments the following day. For measuring antibody mediated cell-cell interactions, one of the immobilized Daudi cell spots was preincubated with 50 nM of either anti-CD20 IgG1 or IgA2 (own production, clone UMAB001) for 1 h in LigandTracer Green (Ridgeview Instruments AB) at room temperature. Antibody preincubation was done only for one of the compartments, the other half of the dish served as control for quantifying non-antibody mediated neutrophil interactions. To each half of the dish, 3 × 10 6 calcein-labeled neutrophils from the same donor were added and binding to Daudi cells was recorded once every 75 s. After 1 h, neutrophils were removed and the remaining cell-cell complexes were followed for another hour to observe their stability. Binding slopes from the no antibody control were used to normalize the data for differences in signal height between experiments. The binding association between IgG1 and IgA2 was compared by the ratio of the binding slope, which was calculated with TraceDrawer 1.8 (Ridgeview Instruments AB). The stability of the formed cell-cell complexes is represented by the half-life, which was calculated from the dissociation rate constant k d that was obtained by fitting a single exponential decay to the dissociation phase (TraceDrawer 1.8).
Neutrophil Stimulation With Antibody-Coated Beads and Western Blotting
Neutrophils were brought to 1 × 10 8 cells/ml in Hanks buffer. Per condition, neutrophils were stimulated with antibody-coated beads in a 1:4 = neutrophil:bead ratio at 37°C for the indicated time periods. After incubation, cells were lysed in Laemmli reducing sample buffer and boiled. SDS-PAGE (12%) was performed and gels were blotted on nitrocellulose membranes. For ERK/p-ERK detection, the membranes were first blocked in 4% ELK milk in TBST (TRIS buffered saline/0.1% Tween 20), washed in TBST and incubated with anti-ERK or anti-p-ERK both at 1:2500 in TBST containing 0.3% BSA at 4°C overnight. Then, blots were washed in TBST, blocked in 4% ELK milk in TBST for 1 h at RT and sequentially incubated with anti-rabbit IgG HRP (1:2500) and Strep-Tactin HRP (1:5000) in 1% ELK milk in TBST for 1 h at RT. Blots were sequentially washed with TBST and PBS followed by ECL-based detection in a BioRad Gel Doc. For the β-actin immuno staining, the HRP from the former detection was first destroyed by 24 h incubation at 4°C in PBS containing 0.1% Tween 20, 0.6% sodium azide, and 0.6% H 2 O 2 . This solution was refreshed at least three times during incubation. After this, the blots were washed with TBST, blocked for 1 h at RT in 4% ELK milk in TBST followed by 2 h incubation with anti-β-Actin (1:2000) in 1% milk in TBST. The blots were then washed with TBST and incubated for 1 h with goat anti-mouse IgG HRP (1:5000) in 1% milk and further processed for detection like described above.
Statistical Analysis
Graphs represent mean ± SD. Statistical analysis was performed by using unpaired Students t -tests or ANOVA with Tukey's multiple comparison test, p < 0.05 were considered as statistically significant.
Supplementary Material The Supplementary Material for this article can be found online at: https://www.frontiersin.org/articles/10.3389/fimmu.2019.00704/full#supplementary-material Figure S1 Stills from live-cell microscopy of anti-CD20 IgA and anti-EGFR IgA facilitated tumor cell killing by PMNs. (A) Calcein labeled EL4-CD20 cells or (B) A431 cells were imaged together with unstimulated human PMNs in the presence of anti-CD20 IgA1 (A) or anti-EGFR IgA2 (B) . Killings of target cells are indicated by the colored circles with corresponding time points above the images. Effector:target ratio for anti-CD20 IgA1 (A) was 15:1 and (B) for anti-EGFR IgA2 10:1. Click here for additional data file. Figure S2 Quantitative expression of FcγR and FcαRI on primary human monocytes (A) or NK cells (B) of n = 6–11 healthy donors using flow cytometry (Qifikit). Click here for additional data file. Figure S3 Remaining individual donors from which PMN binding dynamics to anti-CD20 IgG1or IgA opsonized Daudi cells were measured using ligand tracer technology. Click here for additional data file. Figure S4 (A,C) All five individual donors for p-ERK induction, showing the p-ERK and ERK blots. (B) Quantification of the anti-CD20 blots, by dividing the p-ERK signal over the ERK signal. The 0 min time point was set to 1. A.U. = arbitrary units, 3 donors are combined. Statistics: two-way ANOVA with Tukey's multiple comparison test. Data are mean + SEM (note: all other graphs in paper are mean + SD), p < 0.05: *. Click here for additional data file. Video S1 Anti-HER2 IgA2 (5 μg/ml) mediated killing of calcein labeled adhered A431-HER2 cells by unstimulated primary human neutrophils. Tumor cell lysis is visualized by the red fluorescence of the DNA dye TO-PRO TM -3. Click here for additional data file. Video S2 Live-cell imaging of adhered A431-HER2 cells in the presence of Anti-HER2 IgG1 (5 μg/ml, trastuzumab), TO-PRO TM -3, and unstimulated primary human neutrophils. Click here for additional data file. Video S3 EL4-CD20 were labeled with calcein and live-cell imaged in the presence of anti-CD20-IgA1 (5 μg/ml) and unstimulated primary human neutrophils, E:T = 15:1. Click here for additional data file. Click here for additional data file. Videos S4,5 Live-cell imaging of calcein labeled A431 cells in suspension together with anti-EGFR IgA2 (5 μg/ml) and unstimulated primary human neutrophils, E:T = 10:1. Click here for additional data file.
📊 Figures
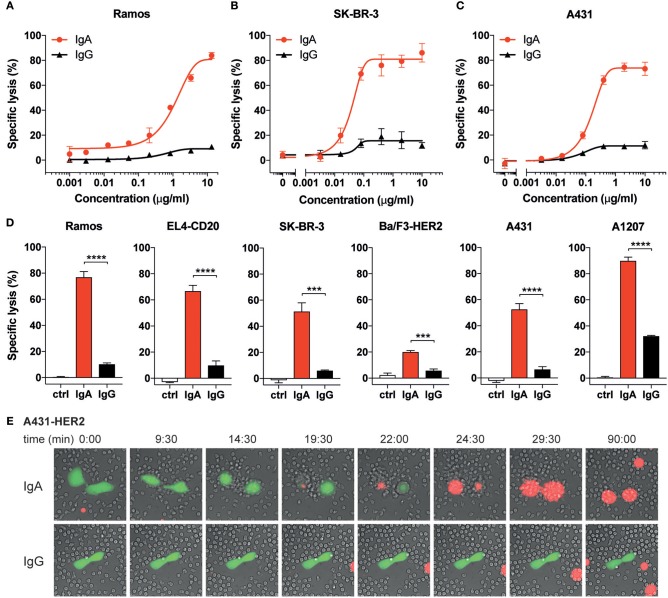
Figure 1
IgA mediates higher tumor cell lysis than IgG with human neutrophils. (Au2013D) Specific lysis of tumor cells by isolated human neutrophils (E:T = 40:1) using a 4 h 51 Cr release assay. Anti-CD20 Abs ...
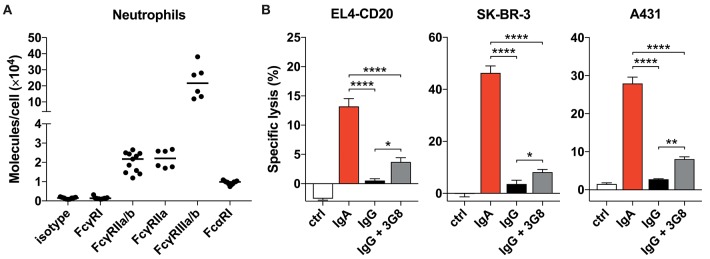
Figure 2
Blocking Fcu03b3RIIIb only marginally improves tumor cell lysis. (A) Quantitative expression of Fcu03b3R and Fcu03b1RI on human neutrophils as analyzed by flow cytometry (Qifikit), n = 6u201311 health...
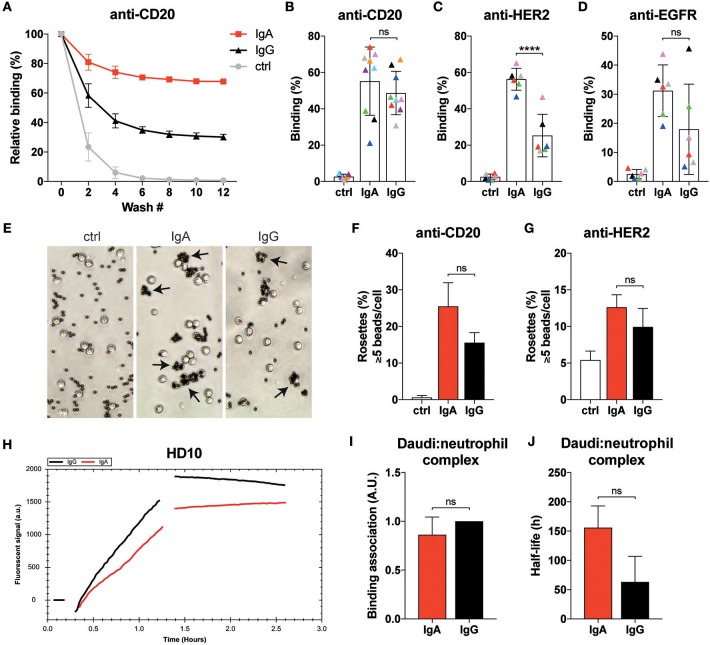
Figure 3
Neutrophils display similar binding characteristics to IgA- or IgG-associated surfaces. (A) Example of relative binding of a donor of which calcein labeled neutrophils were allowed to associate to ant...
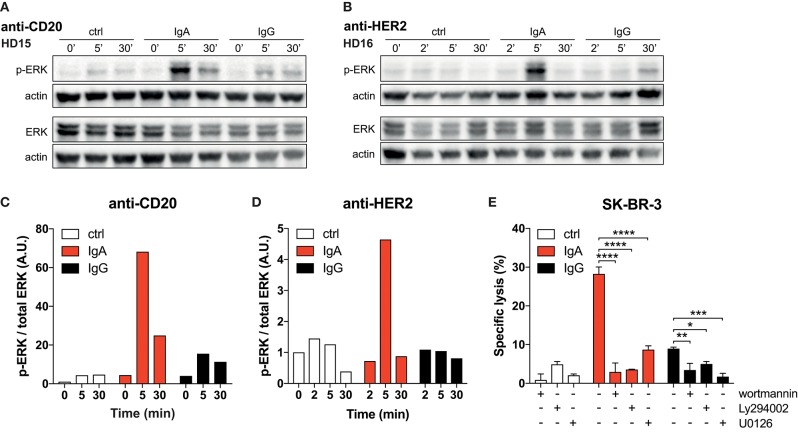
Figure 4
Strong p-ERK signal in neutrophils elicited by IgA. (A,B) Time-dependent increase and decrease of p-ERK signal in neutrophils after exposure to anti-CD20 or anti-HER2 IgA2- or IgG1-coated Dynabeads. A...
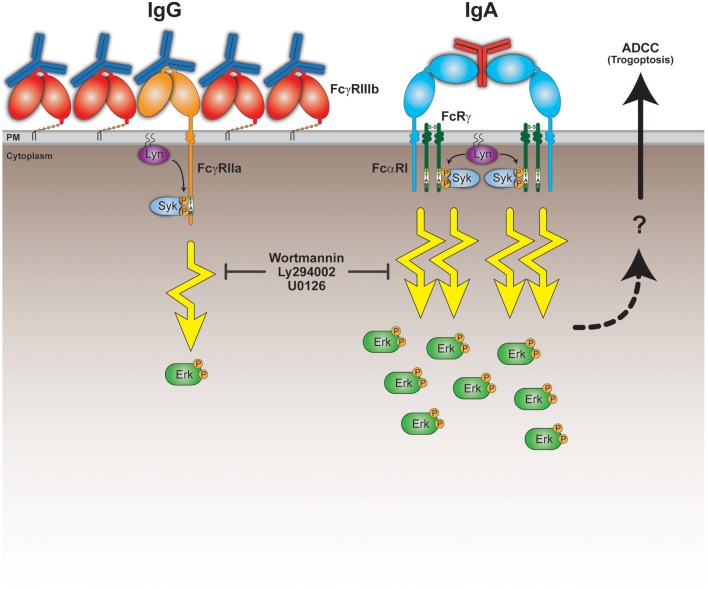
Figure 5
Model for superior IgA-mediated tumor cell killing by neutrophils. Neutrophils express the low affinity Fc receptors Fcu03b3RIIIb, Fcu03b3RIIa, and Fcu03b1RI. Both Fcu03b3RIIa and Fcu03b1RI are activa...
Figure images are served from the NIH/NLM PubMed Central Open Access Subset or Europe PMC; copyright remains with the publishers and authors.
💬 Discussion
0 commentsNo comments yet. Be the first to start a discussion!
Leave a Comment