Abstract
For many species, hunting is an innate behaviour that is crucial for survival, yet the circuits that control predatory action sequences are poorly understood. We used larval zebrafish to identify a population of pretectal neurons that control hunting. By combining calcium imaging with a virtual hunting assay, we identified a discrete pretectal region that is selectively active when animals initiate hunting. Targeted genetic labelling allowed us to examine the function and morphology of individual cells and identify two classes of pretectal neuron that project to ipsilateral optic tectum or the contralateral tegmentum. Optogenetic stimulation of single neurons of either class was able to induce sustained hunting sequences, in the absence of prey. Furthermore, laser ablation of these neurons impaired prey-catching and prevented induction of hunting by optogenetic stimulation of the anterior-ventral tectum. We propose that this specific population of pretectal neurons functions as a command system to induce predatory behaviour.
🔬 Techniques
🔭 Microscopes
🧬 Organisms
✨ Fluorophores
🧪 Sample Preparation
🔬 Cell Lines
🏭 Microscope Brands
🧪 Reagent Suppliers
🔴 Lasers
📷 Detectors
🔎 Objectives
💻 Software Details
💻 Code & Software
💾 Data Repositories
🏷️ Research Resource Identifiers (RRIDs)
Verified research resources used in this paper:
🏛️ Research Organizations (ROR)
Affiliated research institutions:
📋 Methods
Key resources table
Reagent type (species) or resource Designation Source or reference Identifiers Additional information Genetic reagent( Danio rerio ) Tg(KalTA4u508) u508Tg This study Transgene Genetic reagent( Danio rerio ) Tg(UAS:jGCaMP7f)u341Tg This study Transgene Genetic reagent( Danio rerio ) Tg(UAS:CoChR-tdTomato)u332Tg This study ZFIN ID: ZDB-ALT-190226–4 Transgene Genetic reagent ( Danio rerio ) Tg(elavl3:H2B-GCaMP6s)jf5Tg PMID: 25068735 ZFIN ID: ZDB-ALT-141023–2 Vladimirov et al., 2014 Genetic reagent ( Danio rerio ) Tg(atoh7:gapRFP) cu2Tg PMID: 17147778 ZFIN ID: ZDB-ALT-070129–2 Zolessi et al., 2006 Genetic reagent ( Danio rerio ) Tg(UAS:GCaMP6f, cryaa:mCherry)icm06Tg PMID: 28623664 ZFIN ID: ZDB-ALT-160119–5 Knafo et al. (2017) Genetic reagent( Danio rerio ) Tg(UAS-E1b:NfsB-mCherry)jh17Tg PMID: 17335798 ZFIN ID: ZDB-ALT-110222–4 Davison et al. (2007) Genetic reagent( Danio rerio ) TgBAC(slc17a6b:loxP-DsRed-loxP-GFP)nns14Tg PMID: 21199937 ZFIN ID: ZDB-ALT-110413–5 Koyama et al. (2011) Genetic reagent ( Danio rerio ) Tg(UAS:RFP)tpl2Tg PMID: 24179142 ZFIN ID: ZDB-ALT-131119–25 Auer et al. (2014) Genetic reagent( Danio rerio ) Tg(atoh7:GFP)rw021Tg PMID: 12702661 ZFIN ID: ZDB-ALT-050627–2 Masai et al. (2003) Genetic reagent( Danio rerio ) Tg(Cau.Tuba1:c3paGFP)a7437Tg PMID: 22704987 ZFIN ID: ZDB-ALT-120919–1 Bianco et al. (2012) Genetic reagent ( Danio rerio ) Tg(elavl3:ITETA-PTET:Cr.Cop4-YFP)fmi2Tg PMID: 23641200 ZFIN ID: ZDB-ALT-120209–3 Fajardo et al. (2013) Genetic reagent ( Danio rerio ) Tg(gata2a:GFP)pku2Et PMID: 18164283 ZFIN ID: ZDB-ALT-080514–1 Wen et al., 2008 Genetic reagent ( Danio rerio ) atoh7 th241 PMID: 11430806 ZFIN ID: ZDB-ALT-980203–363 Kay et al. (2001) Recombinant DNA reagent UAS:CoChR-tdTomato This study Plasmid Sequence-based reagent CoChR_fw PCR primer This study CTCAGCGTAAAGCCACCATGCTGGGAAACG Sequence-based reagent CoChR_rev PCR primer This study TACTACCGGTGCCGCCACTGT Sequence-based reagent CoChR_tdT_fw PCR primer This study ACAGTGGCGGCACCGGTAGTA Sequence-based reagent tdT_rev PCR primer This study CTAGTCTCGAGATCTCCATGTTTACTTATACAGCTCATCCATGCC Sequence-based reagent UAS_jGCaMP7_fw PCR primer This study CGTAAAGCCACCATGGGTTCTCATC Sequence-based reagent UAS_jGCaMP7_rev PCR primer This study CTCGAGATCTCCATGTTTACTTCGCTGTCATCATTTGTACAAAC Sequence-based reagent pvalb_fw PCR primer This study GGGGACAAGTTTGTACAAAAAAGCAGGCTGGATGGTGGGCCAAATCAAAGGCTAC Sequence-based reagent pvalb_rev PCR primer This study GGGGACCACTTTGTACAAGAAAGCTGGGTGGAACGAGACCGGCAACACACAG Antibody Rabbit polyclonal anti-GFP; TP401 AMS Biotechnology RRID: AB_10890443 1:1000 Antibody Mouse monoclonalanti-44/42 MAPK (Erk1/2); 4696 Cell Signaling Technology RRID: AB_390780 1:500 Antibody Rat monoclonal anti-GFP; 04404–26 Nacalai Tesque RRID: AB_10013361 1:1000 Antibody Rabbit polyclonal anti-RFP/DsRed; PM005 MBL International RRID: AB_591279 1:1000 Software, algorithm MATLAB MathWorks RRID: SCR_001622 https://uk.mathworks.com/products/matlab.html Software, algorithm LabView National Instruments RRID: SCR_014325 http://www.ni.com/en-gb/shop/labview.html Software, algorithm Prism GraphPad RRID: SCR_002798 https://www.graphpad.com/scientific-software/prism/ Software, algorithm FIJI PMID: 22743772 RRID: SCR_002285 https://imagej.net/Fiji/Downloads Software, algorithm Simple NeuriteTracer (ImageJ plugin) PMID: 21727141 RRID: SCR_016566 https://imagej.net/Simple_Neurite_Tracer Software, algorithm Advanced Normalization Tools (ANTs) PMID: 20851191 RRID: SCR_004757 http://stnava.github.io/ANTs/ Software, algorithm Psychophysics Toolbox PMID: 9176952 RRID: SCR_002881 http://psychtoolbox.org/ Software, algorithm Zebrafish Brain Browser (ZBB) PMID: 26635538 https://science.nichd.nih.gov/confluence/display/burgess/Brain+Browser Software, algorithm MATLAB script for cell detection PMID: 27881303 https://github.com/ahrens-lab/Kawashima_et_al_Cell_2016/ Software, algorithm Kernel Density Estimation Toolbox for MATLAB https://www.ics.uci.edu/~ihler/code/kde.html Experimental model and transgenic lines Animals were reared on a 14/10 hr light/dark cycle at 28.5°C. For all experiments, we used zebrafish larvae homozygous for the mitfa w2 skin-pigmentation mutation ( Lister et al., 1999 ). Larvae used for pan-neuronal Ca 2+ imaging experiments were double-transgenic Tg(elavl3:H2B-GCaMP6s) jf5Tg ( Vladimirov et al., 2014 ) and Tg(atoh7:gapRFP) cu2Tg ( Zolessi et al., 2006 ). For AF7-pretectal Ca 2+ imaging, larvae were double-transgenic for Tg(–2.5pvalb6:KalTA4) u508Tg [ i.e. Tg(KalTA4u508 ); generated in this study, see below] and either Tg(UAS:GCaMP6f,cryaa:mCherry) icm06Tg ( Knafo et al., 2017 ) or Tg(UAS:jGCaMP7f) u341Tg (generated in this study, see below). Larvae used to determine whether KalTA4u508 -expressing neurons reside in AF7-pretectum were triple-transgenic Tg(KalTA4u508), Tg(UAS-E1b:NfsB-mCherry) jh17Tg ( Davison et al., 2007 ) and TgBAC(slc17a6b:loxP-DsRed-loxP-GFP) nns14Tg ( Koyama et al., 2011 ). Larvae used for AF7 dendritic stratification analyses were triple-transgenic Tg(KalTA4u508) , Tg(UAS:RFP) tpl2Tg ( Auer et al., 2014 ), and Tg(atoh7:GFP) rw021Tg ( Masai et al., 2003 ). Fish used for mapping of cell location in the adult pretectum were triple-transgenic Tg(KalTA4u508), Tg(UAS:GCaMP6f,cryaa:mCherry) icm06Tg and Tg(atoh7:gapRFP) cu2Tg . Larvae used for photo-activatable GFP labelling were Tg(Cau.Tuba1:c3paGFP) a7437Tg ( Bianco et al., 2012 ). Larvae used for single cell labelling and optogenetic stimulation of AF7-pretectal cells were double-transgenic Tg(KalTA4u508) and Tg(elavl3:H2B-GCaMP6s) jf5Tg . Larvae used for single-cell optogenetic stimulation of AF7-pretectal cells in blind fish were double-transgenic Tg(KalTA4u508) and Tg(atoh7:gapRFP) cu2Tg with homozygous mutation of the atoh7 th241 gene ( Kay et al., 2001 ). Blind atoh7 th241 homozygous fish were selected based on Tg(atoh7:gapRFP) cu2Tg expression being visible only in the eye but with no RGC projections in the brain. Larvae used for patterned optogenetic stimulation of the AF7-pretectal population were double-transgenic Tg(KalTA4u508) and Tg(UAS:CoChR-tdTomato) u332Tg (generated in this study, see below). Larvae used for pretectal cell ablations and free-swimming behaviour analyses were triple-transgenic Tg(KalTA4u508), Tg(UAS-E1b:NfsB-mCherry) jh17Tg ( Davison et al., 2007 ) and Tg(elavl3:ITETA-PTET:Cr.Cop4-YFP) fmi2Tg ( Fajardo et al., 2013 ). Larvae used for assessment of AF7 axonal arborisations following ablation of KalTA4u508 pretectal neurons were triple-transgenic Tg(KalTA4u508), Tg(UAS-E1b:NfsB-mCherry) jh17Tg and Tg(atoh7:GFP) rw021Tg . Larvae used for sham ablations of thalamic cells were double-transgenic Tg(gata2a:GFP) pku2Et ( Wen et al., 2008 ) and Tg(atoh7:GFP) rw021Tg . Larvae used for optogenetic stimulation of the avOT were double-transgenic Tg(atoh7:gapRFP) cu2Tg and Tg(elavl3:ITETA-PTET:Cr.Cop4-YFP) fmi2Tg with either homozygous, heterozygous or no mutation of the atoh7 th241 gene. All larvae were fed Paramecia from 4 dpf onward. Animal handling and experimental procedures were approved by the UCL Animal Welfare Ethical Review Body and the UK Home Office under the Animal (Scientific Procedures) Act 1986.
Show full methods section
Key resources table
Reagent type (species) or resource Designation Source or reference Identifiers Additional information Genetic reagent( Danio rerio ) Tg(KalTA4u508) u508Tg This study Transgene Genetic reagent( Danio rerio ) Tg(UAS:jGCaMP7f)u341Tg This study Transgene Genetic reagent( Danio rerio ) Tg(UAS:CoChR-tdTomato)u332Tg This study ZFIN ID: ZDB-ALT-190226–4 Transgene Genetic reagent ( Danio rerio ) Tg(elavl3:H2B-GCaMP6s)jf5Tg PMID: 25068735 ZFIN ID: ZDB-ALT-141023–2 Vladimirov et al., 2014 Genetic reagent ( Danio rerio ) Tg(atoh7:gapRFP) cu2Tg PMID: 17147778 ZFIN ID: ZDB-ALT-070129–2 Zolessi et al., 2006 Genetic reagent ( Danio rerio ) Tg(UAS:GCaMP6f, cryaa:mCherry)icm06Tg PMID: 28623664 ZFIN ID: ZDB-ALT-160119–5 Knafo et al. (2017) Genetic reagent( Danio rerio ) Tg(UAS-E1b:NfsB-mCherry)jh17Tg PMID: 17335798 ZFIN ID: ZDB-ALT-110222–4 Davison et al. (2007) Genetic reagent( Danio rerio ) TgBAC(slc17a6b:loxP-DsRed-loxP-GFP)nns14Tg PMID: 21199937 ZFIN ID: ZDB-ALT-110413–5 Koyama et al. (2011) Genetic reagent ( Danio rerio ) Tg(UAS:RFP)tpl2Tg PMID: 24179142 ZFIN ID: ZDB-ALT-131119–25 Auer et al. (2014) Genetic reagent( Danio rerio ) Tg(atoh7:GFP)rw021Tg PMID: 12702661 ZFIN ID: ZDB-ALT-050627–2 Masai et al. (2003) Genetic reagent( Danio rerio ) Tg(Cau.Tuba1:c3paGFP)a7437Tg PMID: 22704987 ZFIN ID: ZDB-ALT-120919–1 Bianco et al. (2012) Genetic reagent ( Danio rerio ) Tg(elavl3:ITETA-PTET:Cr.Cop4-YFP)fmi2Tg PMID: 23641200 ZFIN ID: ZDB-ALT-120209–3 Fajardo et al. (2013) Genetic reagent ( Danio rerio ) Tg(gata2a:GFP)pku2Et PMID: 18164283 ZFIN ID: ZDB-ALT-080514–1 Wen et al., 2008 Genetic reagent ( Danio rerio ) atoh7 th241 PMID: 11430806 ZFIN ID: ZDB-ALT-980203–363 Kay et al. (2001) Recombinant DNA reagent UAS:CoChR-tdTomato This study Plasmid Sequence-based reagent CoChR_fw PCR primer This study CTCAGCGTAAAGCCACCATGCTGGGAAACG Sequence-based reagent CoChR_rev PCR primer This study TACTACCGGTGCCGCCACTGT Sequence-based reagent CoChR_tdT_fw PCR primer This study ACAGTGGCGGCACCGGTAGTA Sequence-based reagent tdT_rev PCR primer This study CTAGTCTCGAGATCTCCATGTTTACTTATACAGCTCATCCATGCC Sequence-based reagent UAS_jGCaMP7_fw PCR primer This study CGTAAAGCCACCATGGGTTCTCATC Sequence-based reagent UAS_jGCaMP7_rev PCR primer This study CTCGAGATCTCCATGTTTACTTCGCTGTCATCATTTGTACAAAC Sequence-based reagent pvalb_fw PCR primer This study GGGGACAAGTTTGTACAAAAAAGCAGGCTGGATGGTGGGCCAAATCAAAGGCTAC Sequence-based reagent pvalb_rev PCR primer This study GGGGACCACTTTGTACAAGAAAGCTGGGTGGAACGAGACCGGCAACACACAG Antibody Rabbit polyclonal anti-GFP; TP401 AMS Biotechnology RRID: AB_10890443 1:1000 Antibody Mouse monoclonalanti-44/42 MAPK (Erk1/2); 4696 Cell Signaling Technology RRID: AB_390780 1:500 Antibody Rat monoclonal anti-GFP; 04404–26 Nacalai Tesque RRID: AB_10013361 1:1000 Antibody Rabbit polyclonal anti-RFP/DsRed; PM005 MBL International RRID: AB_591279 1:1000 Software, algorithm MATLAB MathWorks RRID: SCR_001622 https://uk.mathworks.com/products/matlab.html Software, algorithm LabView National Instruments RRID: SCR_014325 http://www.ni.com/en-gb/shop/labview.html Software, algorithm Prism GraphPad RRID: SCR_002798 https://www.graphpad.com/scientific-software/prism/ Software, algorithm FIJI PMID: 22743772 RRID: SCR_002285 https://imagej.net/Fiji/Downloads Software, algorithm Simple NeuriteTracer (ImageJ plugin) PMID: 21727141 RRID: SCR_016566 https://imagej.net/Simple_Neurite_Tracer Software, algorithm Advanced Normalization Tools (ANTs) PMID: 20851191 RRID: SCR_004757 http://stnava.github.io/ANTs/ Software, algorithm Psychophysics Toolbox PMID: 9176952 RRID: SCR_002881 http://psychtoolbox.org/ Software, algorithm Zebrafish Brain Browser (ZBB) PMID: 26635538 https://science.nichd.nih.gov/confluence/display/burgess/Brain+Browser Software, algorithm MATLAB script for cell detection PMID: 27881303 https://github.com/ahrens-lab/Kawashima_et_al_Cell_2016/ Software, algorithm Kernel Density Estimation Toolbox for MATLAB https://www.ics.uci.edu/~ihler/code/kde.html Experimental model and transgenic lines Animals were reared on a 14/10 hr light/dark cycle at 28.5°C. For all experiments, we used zebrafish larvae homozygous for the mitfa w2 skin-pigmentation mutation ( Lister et al., 1999 ). Larvae used for pan-neuronal Ca 2+ imaging experiments were double-transgenic Tg(elavl3:H2B-GCaMP6s) jf5Tg ( Vladimirov et al., 2014 ) and Tg(atoh7:gapRFP) cu2Tg ( Zolessi et al., 2006 ). For AF7-pretectal Ca 2+ imaging, larvae were double-transgenic for Tg(–2.5pvalb6:KalTA4) u508Tg [ i.e. Tg(KalTA4u508 ); generated in this study, see below] and either Tg(UAS:GCaMP6f,cryaa:mCherry) icm06Tg ( Knafo et al., 2017 ) or Tg(UAS:jGCaMP7f) u341Tg (generated in this study, see below). Larvae used to determine whether KalTA4u508 -expressing neurons reside in AF7-pretectum were triple-transgenic Tg(KalTA4u508), Tg(UAS-E1b:NfsB-mCherry) jh17Tg ( Davison et al., 2007 ) and TgBAC(slc17a6b:loxP-DsRed-loxP-GFP) nns14Tg ( Koyama et al., 2011 ). Larvae used for AF7 dendritic stratification analyses were triple-transgenic Tg(KalTA4u508) , Tg(UAS:RFP) tpl2Tg ( Auer et al., 2014 ), and Tg(atoh7:GFP) rw021Tg ( Masai et al., 2003 ). Fish used for mapping of cell location in the adult pretectum were triple-transgenic Tg(KalTA4u508), Tg(UAS:GCaMP6f,cryaa:mCherry) icm06Tg and Tg(atoh7:gapRFP) cu2Tg . Larvae used for photo-activatable GFP labelling were Tg(Cau.Tuba1:c3paGFP) a7437Tg ( Bianco et al., 2012 ). Larvae used for single cell labelling and optogenetic stimulation of AF7-pretectal cells were double-transgenic Tg(KalTA4u508) and Tg(elavl3:H2B-GCaMP6s) jf5Tg . Larvae used for single-cell optogenetic stimulation of AF7-pretectal cells in blind fish were double-transgenic Tg(KalTA4u508) and Tg(atoh7:gapRFP) cu2Tg with homozygous mutation of the atoh7 th241 gene ( Kay et al., 2001 ). Blind atoh7 th241 homozygous fish were selected based on Tg(atoh7:gapRFP) cu2Tg expression being visible only in the eye but with no RGC projections in the brain. Larvae used for patterned optogenetic stimulation of the AF7-pretectal population were double-transgenic Tg(KalTA4u508) and Tg(UAS:CoChR-tdTomato) u332Tg (generated in this study, see below). Larvae used for pretectal cell ablations and free-swimming behaviour analyses were triple-transgenic Tg(KalTA4u508), Tg(UAS-E1b:NfsB-mCherry) jh17Tg ( Davison et al., 2007 ) and Tg(elavl3:ITETA-PTET:Cr.Cop4-YFP) fmi2Tg ( Fajardo et al., 2013 ). Larvae used for assessment of AF7 axonal arborisations following ablation of KalTA4u508 pretectal neurons were triple-transgenic Tg(KalTA4u508), Tg(UAS-E1b:NfsB-mCherry) jh17Tg and Tg(atoh7:GFP) rw021Tg . Larvae used for sham ablations of thalamic cells were double-transgenic Tg(gata2a:GFP) pku2Et ( Wen et al., 2008 ) and Tg(atoh7:GFP) rw021Tg . Larvae used for optogenetic stimulation of the avOT were double-transgenic Tg(atoh7:gapRFP) cu2Tg and Tg(elavl3:ITETA-PTET:Cr.Cop4-YFP) fmi2Tg with either homozygous, heterozygous or no mutation of the atoh7 th241 gene. All larvae were fed Paramecia from 4 dpf onward. Animal handling and experimental procedures were approved by the UCL Animal Welfare Ethical Review Body and the UK Home Office under the Animal (Scientific Procedures) Act 1986.
2-photon calcium imaging and behavioural tracking
The procedure was very similar to that described in Bianco and Engert (2015) . Larval zebrafish were mounted in 3% low-melting point agarose (Sigma-Aldrich) at 5 dpf or 6 dpf and allowed to recover overnight before functional imaging at 6 dpf or 7 dpf. Imaging was performed using a custom-built 2-photon microscope [XLUMPLFLN 20 × 1.0 NA objective (Olympus), 580 nm PMT dichroic, bandpass filters: 510/84 (green), 641/75 (red) (Semrock), R10699 PMT (Hammamatsu Photonics), Chameleon II ultrafast laser (Coherent Inc)]. Imaging was performed at 920 nm with average laser power at sample of 5–10 mW. For imaging of Tg(elavl3:H2B-GCaMP6s) larvae, images (500 × 500 pixels, 0.61 µm/px) were acquired by frame scanning at 3.6 Hz and for each larva 10–14 focal planes were acquired with a z-spacing of 8 µm. For imaging of Tg(KalTA4u508;UAS:GCaMP6f) or Tg(KalTA4u508;UAS:jGCaMP7f) larvae, the same image size and scanning rate were used but 5–6 focal planes with a z-spacing of 5 µm were acquired for each larva. Visual stimuli were back-projected (Optoma ML750ST) onto a curved screen placed in front of the animal at a viewing distance of ~7 mm while a second projector provided constant background illumination below the fish. A coloured Wratten filter (Kodak, no. 29) was placed in front of both projectors to block green light from the PMT. Visual stimuli were designed in MATLAB using Psychophysics toolbox ( Brainard, 1997 ). For all experiments, stimuli were presented in a pseudo-random sequence with 30 s inter-stimulus interval. Stimuli comprised 5° or 16°, dark or bright spots moving at 30°/s either left→right or right→left across ~200° of frontal visual space. Bright/dark spots had Weber contrast of 1 /– 1, respectively. In addition, 3 s whole-field bright/dark flashes were presented. Eye movements were tracked at 60 Hz under 720 nm illumination using a FL3-U3-13Y3M-C camera (Point Grey) that imaged through the microscope objective. Tail movements were imaged at 430 Hz under 850 nm illumination using a sub-stage GS3-U3-41C6NIR-C camera (Point Grey). Microscope control, stimulus presentation and behaviour tracking were implemented using LabVIEW (National Instruments) and MATLAB (MathWorks).
Calcium imaging analysis
All calcium imaging data analysis was performed using MATLAB scripts. Motion correction of fluorescence imaging data was performed as per Bianco and Engert (2015) . Regions of interest (ROIs) corresponding to cell nuclei were extracted using the cell detection code from Kawashima et al. (2016) . The time-varying fluorescence signal F(t) for each cell was extracted by computing the mean value of all pixels within the corresponding ROI binary mask at each time-point (imaging frame). The proportional change in fluorescence ( ∆F/F0 ) at time t was calculated as Δ F / F 0 = F ( t ) − F 0 F 0 where F 0 is a reference fluorescence value, taken as the median of F(t) during the 30 frames prior to all visual stimulus presentations. We used multilinear regression to model the fluorescent timeseries of each imaged neuron (ROI) in terms of simultaneously recorded kinematic predictors (‘regressors’). Regressors were generated for oculomotor and locomotor variables (7 eye and 3 tail kinematics, see Supplementary file 1 ) by convolving time-series vectors for the relevant kinematic with a calcium impulse response function [CIRF, approximated as the sum of a fast-rising exponential, tau 20 ms, and a slow-decaying exponential, tau 420 ms for GCaMP6f and jGCaMP7f or 3 s for H2B-GCaMP6s; ( Miri et al., 2011 ). To account for delays between neural activity and behaviour and/or indicator dynamics, we time-shifted the regressor matrix relative to the fluorescent response variable so as to minimise the residual squared error of an ordinary least squares regression model. We used elastic-net regularised regression to improve interpretability and prediction accuracy in the presence of multicollinearity between the regressors ( Zou and Hastie, 2005 ). Elastic net models were fit using the ‘glmnet’ package for MATLAB ( Qian et al., 2013 ) and hyperparameters controlling the ratio of L1 vs. L2 penalty (alpha) and the degree of regularisation (lambda) were selected to minimise ten-fold cross-validated squared error. Model coefficients were then used to construct visuomotor vectors.
Visuomotor vectors
(VMVs) were generated for each neuron by concatenating (a) the integral of ∆F/F 0 in response to each visual stimulus (12 s time window from stimulus onset, mean integral across stimulus presentations) for presentations in which no eye convergence was performed by the larva (components 1–10); (b) multilinear regression coefficients ( β values) for eye, tail and motion correction regressors (components 11–21). VMVs from all imaged neurons were assembled into a matrix and each component was normalised across cells by dividing each column by its standard deviation. VMV clustering was performed using a two-step procedure. First, we performed hierarchical agglomerative clustering of VMVs using a correlation distance metric ( Bianco and Engert, 2015 ). For this first step, we selected only neurons that either exhibited strong visual responses (specifically, the maximum value of components 1–10 had to be within the top 5 th percentile of such values across all neurons) or was well modelled in terms of behavioural kinematics (R 2 had to be within the top 5 th percentile of cross-validated R 2 across all neurons). The centroids of the ‘seed’ clusters generated in this step (correlation threshold, 0.7) constituted a set of archetypal response profiles. Next, the VMVs of the remaining neurons were assigned to the cluster with the closest centroid (within a correlation distance threshold of 0.7) to produce the final clusters. To assign cluster identities to KalTA4u508 pretectal neurons ( e.g. Figures 4A , 5T ), VMVs were generated as described above and the same assignment strategy and correlation distance threshold (0.7) were used. Note that normalisation of components was performed using the standard deviations computed for the initial matrix of VMVs. Hunting Index (HIx) scores were calculated for each cell as follows. For each hunting response, convergence-triggered activity was measured by computing the mean of z-scored GCaMP fluorescence in a time window (±1 s) centred on the convergent saccade, x Ri . Next, activity was measured at the same time during non-response trials in which the same visual stimulus was presented. The difference between x Ri and the mean of non-response activity, μ NR , was computed: d i = x R i − μ N R HIx scores were computed as the mean of these d i distance values across all response trials during which the cell was imaged. HIx values were computed separately for convergence events paired with leftwards tail movements, rightwards tail movements, and symmetrical/no tail movements.
3D image registration
Registration of image volumes was performed using the ANTs toolbox version 2.1.0 ( Avants et al., 2011 ). Images were converted to the NRRD file format required by ANTs using ImageJ. As an example, to register the 3D image volume in ‘fish1_01.nrrd’ to the reference brain ‘ref.nrrd’, the following parameters were used: antsRegistration -d 3 -float 1 -o [fish1_, fish1_Warped.nii.gz] -n BSpline -r [ref.nrrd, fish1_01.nrrd, 1] -t Rigid[0.1] -m GC[ref.nrrd, fish1_01.nrrd, 1, 32, Regular, 0.25] -c [200 × 200×200 × 0,1e-8, 10] -f 12 × 8×4 × 2 s 4 × 3×2 × 1 t Affine[0.1] -m GC[ref.nrrd, fish1_01.nrrd, 1, 32, Regular, 0.25] -c [200 × 200×200 × 0,1e-8, 10] -f 12 × 8×4 × 2 s 4 × 3×2 × 1 t SyN[0.1, 6, 0] -m CC[ref.nrrd, fish1_01.nrrd, 1, 2] -c [200 × 200×200x200 × 10,1e-7, 10] -f 12 × 8×4x2 × 1 s 4 × 3×2x1 × 0 The deformation matrices computed above were then applied to any other image channel N of fish1 using: antsApplyTransforms -d 3 v 0 -float -n BSpline -i fish1_01.nrrd -r ref.nrrd -o fish1_0N_Warped.nii.gz -t fish1_1Warp.nii.gz -t fish1_0GenericAffine.mat All brains were registered onto the ZBB brain atlas (1 × 1 × 1 xyz µm/px) ( Marquart et al., 2015 ; Marquart et al., 2017 ) and onto a high-resolution Tg(elavl3:H2B-GCaMP6s) reference brain (0.76 × 0.76 × 1 xyz µm/px, mean of 3 larvae), with some differences between experiments: For functional calcium imaging volumes, a three-step registration was used: the imaging volume, composed of 10–14 image planes (500 × 500 px, 0.61 µm/px, 8 µm z-spacing), was first registered to a larger volume of the same brain acquired at the end of the experiment (1 µm z-spacing), using affine and warp transformations. Then, the larger volume was registered to the Hi-Res Tg(elavl3:H2B-GCaMP6s) reference brain. Because the high-resolution volume had already been registered onto the ZBB atlas, the transformations were concatenated to bring the functional imaging volume to the ZBB atlas (calcium imaging stack → post-imaging stack → Hi-Res → ZBB). The brain regions displayed in Figure 3F,H , and Figure 3—figure supplement 1B,C correspond to volumetric binary image masks in the ZBB atlas that have been registered to the Hi-Res Tg(elavl3:H2B-GCaMP6s) reference brain using the ZBB Tg(elavl3:H2B-RFP) volume and performing affine and warp transformations (ZBB elavl3:H2B-RFP → Hi-Res). For the registration displayed in Figure 3A,B of KalTA4u508 neurons to the Hi-Res Tg(elavl3:H2B-GCaMP6s) reference brain, the imaging volume was registered to the ZBB Tg(vglut:DsRed) volume [previously registered to the Hi-Res reference brain (ZBB elavl3:H2B-RFP → Hi-Res] using the vglut2a channel [ TgBAC(slc17a6b:loxP-DsRed-loxP-GFP) ] acquired in parallel with Tg(KalTA4u508;UAS-E1b:NfsB-mCherry) imaging and performing affine and warp transformations. For single KalTA4u508 neuron tracing experiments, the imaging volume was registered to the Hi-Res Tg(elavl3:H2B-GCaMP6s) reference brain using the H2B-GCaMP6s channel acquired in parallel with Tg(KalTA4u508);UAS-CoChR-tdTomato-injected imaging. Affine and warp transformations were performed to bring the imaging volume and associated neuron tracing (see below) to the Hi-Res reference brain. Imaging volumes related to photo-activation of PA-GFP were registered to a whole-brain reference from a 6 dpf Tg(α-tubulin:C3PA-GFP) larva in which no photo-activation was performed, using affine and warp transformations. The Tg(α-tubulin:C3PA-GFP) reference volume was then registered to the ZBB atlas. The photo-activation volume was transported to the Hi-Res Tg(elavl3:H2B-GCaMP6s) reference by concatenating the transformations (photo-activation stack → Tg(α-tubulin:C3PA-GFP) reference → ZBB → Hi-Res). For the images and analyses displayed in Figure 7B,C and Figure 7—figure supplement 1A,B of sighted and blind Tg(elavl3:itTA;Ptet:ChR2-YFP;atoh7:gapRFP) larvae, the imaging volume was registered to the ZBB anti-tERK volume using the anti-tERK immunostain channel and performing affine and warp transformations. All registration steps were manually assessed for global and local alignment accuracy. All brain regions referred to in this paper correspond to the volumetric binary image masks in the ZBB atlas, with the exception of regions in the anterior-ventral optic tectum, AF7-pretectum, and cholinergic nucleus isthmi ( Henriques et al., 2019 ). These image masks, in ZBB reference space, can be downloaded as Supplementary file 2 – 4 .
DNA cloning and transgenesis
To generate the UAS:CoChR-tdTomato DNA construct used for single cell labelling and optogenetic stimulations and for creating the Tg(UAS:CoChR-tdTomato) u332Tg line, the coding sequence of the blue light-sensitive opsin CoChR (from pAAV-Syn-CoChR-GFP ) and the red fluorescent protein tdTomato (from pAAV-Syn-Chronos-tdTomato ) were cloned in frame into a UAS Tol1 backbone ( pT1UciMP ). The pAAV-Syn-CoChR-GFP and pAAV-Syn-Chronos-tdTomato plasmids were gifts from Edward Boyden (Addgene plasmid # 59070 and # 62726, respectively) ( Klapoetke et al., 2014 ). The pT1UciMP plasmid was a gift from Harold Burgess (Addgene plasmid # 62215) ( Horstick et al., 2015 ). The cloning was achieved using the In-Fusion HD Cloning Plus CE kit (Clontech) with the following primers: CoChR_fw, CTCAGCGTAAAGCCACCATGCTGGGAAACG CoChR_rev, TACTACCGGTGCCGCCACTGT CoChR_tdT_fw, ACAGTGGCGGCACCGGTAGTA tdT_rev, CTAGTCTCGAGATCTCCATGTTTACTTATACAGCTCATCCATGCC To generate the UAS:jGCaMP7f DNA construct used for creating the Tg(UAS:jGCaMP7f) u341Tg line, the coding sequence of the genetically encoded calcium indicator jGCaMP7f (from pGP-CMV-jGCaMP7f ) was cloned into the pT1UciMP UAS Tol1 backbone. The pGP-CMV-jGCaMP7f plasmid was a gift from Douglas Kim (Addgene plasmid # 104483) ( Dana et al., 2019 ). As above, the cloning was achieved using the In-Fusion HD Cloning Plus CE kit (Clontech) with the following primers: UAS_jGCaMP7_fw, CGTAAAGCCACCATGGGTTCTCATC UAS_jGCaMP7_rev, CTCGAGATCTCCATGTTTACTTCGCTGTCATCATTTGTACAAAC To generate the Tg(UAS:jGCaMP7f) and the Tg(UAS:CoChR-tdTomato) lines, purified UAS:jGCaMP7f or UAS:CoChR-tdTomato DNA constructs (35 ng/µl) were co-injected with Tol1 transposase mRNA (80 ng/µl) into Tg(KalTA4u508) zebrafish embryos at the early one-cell stage. Transient expression, visible as jGCaMP7f or tdTomato fluorescence, was used to select injected embryos that were then raised to adulthood. Tol1 transposase mRNA was prepared by in vitro transcription from NotI-linearised pCS2-Tol1.zf1 plasmid using the SP6 transcription mMessage mMachine kit (Life Technologies). The pCS2-Tol1.zf1 was a gift from Harold Burgess (Addgene plasmid # 61388) ( Horstick et al., 2015 ). RNA was purified using the RNeasy MinElute Cleanup kit (Qiagen). Germ line transmission was identified by mating sexually mature adult fish to mitfa w2/w2 fish and, subsequently, examining their progeny for jGCaMP7f or tdTomato fluorescence. Positive embryos from a single fish were then raised to adulthood. Once this second generation of fish reached adulthood, positive embryos from a single ‘founder’ fish were again selected and raised to adulthood to establish stable Tg(KalTA4u508;UAS:jGCaMP7f) and Tg(KalTA4u508;UAS:CoChR-tdTomato) double-transgenic lines. The Tg(–2.5pvalb6:KalTA4) u508Tg [ i.e. Tg(KalTA4u508 )] line was isolated as follows. First, we used Gateway cloning (Invitrogen) to construct an expression vector in which ~ 2.5 kb of zebrafish genomic sequence upstream of the pvalb6 gene start codon was placed upstream of the KalTA4 ( Distel et al., 2009 ) open reading frame. The genomic sequence was cloned using the following primers and Phusion PCR polymerase (Thermo Fisher Scientific): pvalb_fw: GGGGACAAGTTTGTACAAAAAAGCAGGCTggatggtgggccaaatcaaaggctac pvalb_rev: GGGGACCACTTTGTACAAGAAAGCTGGGTggaacgagaccggcaacacacag (where capital letters indicate the attB1/B2 extension sequences). The expression vector was then micro-injected into one-cell stage Tg(UAS-E1b:Kaede) s1999t ( Davison et al., 2007 ) embryos at 30 ng/µl along with tol2 mRNA (30 ng/µl) and adult fish were screened for germline transmission by outcrossing as described above. This expression vector generated a wide range of expression patterns, one of which was designated the allele u508Tg and labelled AF7-pretectal neurons, as well as numerous other neuronal populations in the brain, spinal cord and sensory ganglia as reported here. Immunohistochemistry Larvae Samples were fixed overnight in 4% paraformaldehyde (PFA) in 0.1 M phosphate buffered saline (PBS, Sigma-Aldrich) and 4% sucrose (Sigma-Aldrich) at 4°C. Brains were manually dissected with forceps prior to immunostaning. First, dissected brains were permeabilised by incubation in proteinase-K (40 µg/ml) in PBS with 1% Triton-X100 (PBT, Sigma-Aldrich) for 15 min. This was followed by 3 × 5 min washes in PBT, 20 min fixation in 4% PFA at room temperature and 3 × 5 min washes in PBT. Second, brains were incubated in block solution (2% goat serum, 1% DMSO, 1% BSA in PBT, Sigma-Aldrich) for 2 hr. Subsequently, brains were incubated in block solution containing primary antibodies overnight, followed by 6 × 1 hr washes in PBT on a slowly rotating shaker. Third, brains were incubated in block solution containing secondary antibodies overnight, followed by 6 × 1 hr washes in PBT. Finally, PBT was rinsed out by doing washes in PBS and brains were stored at 4°C. Imaging was performed using the two-photon microscope described above at 790 nm. Primary antibodies were: rabbit anti-GFP (AMS Biotechnology, TP401, dilution 1:1000) and mouse anti-ERK (Cell Signaling Technology, 9102, p44/42 MAPK (Erk1/2), dilution 1:500). Secondary antibodies were: goat anti-rabbit Alexa Fluor 488-conjugated (Thermo Fisher Scientific, A-11034, dilution 1:200), and goat anti-mouse Alexa Fluor 594-conjugated (Thermo Fisher Scientific, A-11005, dilution 1:200). Adults Tg(KalTA4u508;UAS:GCaMP6f;atoh7:gapRFP) fish (3 months old) were deeply anesthetised in 0.2% tricaine (MS222, Sigma) and fixed in 4% paraformaldehyde (PFA) for 24 hr at 4°C. Brains were then carefully dissected under a stereomicroscope and transferred to saline phosphate buffer (PBS), where they were maintained for at least half an hour. Two different procedures were used for sectioning the brains. For cryostat sectioning, brains were cryopreserved, embedded in Tissue Tek OCT compound (Sakura Finetek) and frozen using liquid nitrogen cooled methylbutane. Transverse sections of the brain (12 µm thick) were obtained using a cryostat and collected in gelatine-coated slides. For vibratome sectioning, brains were first embedded into 3% agarose in PBS. Transverse sections of the brains (100 µm thick) were obtained using a vibratome and transferred to PBS in microtubes. Immunostaining was performed by either adding solutions onto the cryostat sections or changing the solutions inside the microtubes. Sections were incubated first in normal goat serum (Sigma, dilution 1:10) in PBS with 0.5% Triton for 1 hr at room temperature, and then with a cocktail of two primary antibodies (rat anti-GFP, Nacalai Tesque, 04404–26, dilution 1:1000, and rabbit anti-RFP, MBL International, PM005, dilution 1:1000) for 24 hr at room temperature. Next, after three washes in PBS, brain sections were incubated with a cocktail of two secondary antibodies (goat anti-rat Alexa 488, Thermo Fisher Scientific, A-11006, dilution 1:500, and goat anti-rabbit Alexa 568, Thermo Fisher Scientific, A-11011, dilution 1:500) for 1 hr at room temperature. Sections were washed in PBS, mounted with 50% glycerol in PBS and imaged using a Nikon A1R confocal microscope equipped with a Nikon Plan Fluor 20 × 0.50 NA objective. Excitation light was provided by an argon ion multichannel laser tuned to 488 nm (green channel), and a 561 nm diode laser (red channel).
Single cell labelling
To label individual KalTA4u508 neurons, UAS:CoChR-tdTomato DNA constructs were injected into 1–4 cell stage Tg(KalTA4u508) or Tg(KalTA4u508;atoh7:gapRFP) embryos with homozygous or no mutation of the atoh7 th241 gene. Plasmid DNA was purified using midi-prep kits (Qiagen) and injected at a concentration of 30 ng/µl in distilled water. Larvae (4 dpf) were then screened for CoChR-tdTomato expression. Only larvae showing expression in a single KalTA4u508 pretectal neuron were subsequently used for optogenetic stimulations and neuronal tracing experiments. Single cell morphologies were traced using the Simple Neurite Tracer plugin for ImageJ ( Longair et al., 2011 ).
Anatomical analyses
Cell density of neurons belonging to hunting-initiation clusters (25–28) was computed in the following way. First, we obtained the soma 3D coordinates of all neurons in clusters 25–28 following anatomical registration to the high-resolution Tg(elavl3:H2B-GCaMP6s) reference brain. Then, we computed the local cell density at each soma location using an adaptive Gaussian-based kernel density estimate ( Breiman et al., 1977 ), with the bandwidth at each point constrained to be proportional to the k th nearest neighbour distance where: k = n and n is the number of neurons (N = 6,630 cells from 8 fish). To compute the kernel density estimate, we used a MATLAB-based toolbox developed by Alexander Ihler ( www.ics.uci.edu/~ihler/code/kde.html ). Images in Figure 3A,B represent volume projections in which hunting-initiation neurons are colour-coded according to local cell density. Neurite stratification and axon projection profiles in Figure 3D,G were obtained by measuring fluorescence intensity values along the axes indicated on figure panels using ImageJ Line and Plot Profile tools. For each image channel, a maximum intensity projection image was generated before measuring fluorescence intensity. Each intensity profile i was then rescaled to generate a profile, I, ranging from 0 to 1 as follows: I = i - i m i n i m a x - i m i n where i min and i max are the minimum and maximum values of profile i , respectively. Photo-activation of PA-GFP Larvae (5 dpf) homozygous for the Tg(α-tubulin:C3PA-GFP) transgene were anaesthetised and mounted in 2% low-melting temperature agarose. The same custom-built 2-photon microscope used for functional imaging was used to photo-activate PA-GFP in a small region (9 × 9 µm) containing cell bodies located in AF7-pretectum. The photo-activation site was selected by imaging the brain at 920 nm. Photo-activation was performed by continuously scanning at 790 nm (5 mW at sample) for 4 min. Larvae were then unmounted and allowed to recover. At 7 dpf, an image stack (1200 × 800 px, 0.38 µm/px, ∼200 µm z-extent) was acquired at 920 nm covering a large portion of the midbrain, tegmentum and hindbrain. Axonal projections were traced using the Simple Neurite Tracer plugin for ImageJ ( Longair et al., 2011 ).
Monitoring of free-swimming behaviour
The same behavioural tracking system was used for both optogenetic stimulations and assessment of visuomotor behaviours with some differences. Images were acquired under 850 nm illumination using a high-speed camera [Mikrotron MC1362, 250 Hz ( optogenetic stimulations ) or 700 Hz ( visuomotor behaviours assessment ), 500 µs shutter-time] equipped with a machine vision lens (Fujinon HF35SA-1) and an 850 nm bandpass filter to block visible light. In all experiments, larvae were placed in the arena and allowed to acclimate for around 2 min before starting experiments. Optogenetic stimulations Larvae were placed in a petri dish with a custom-made agarose well (28 mm diameter, 3 mm depth) filled with fish facility water. Blue light was delivered across the whole arena from above using a 470 nm LED (OSRAM Golden Dragon Plus, LB W5AM) or a 459 nm LED (OSRAM OSTAR Projection Power, LE B P2W). Irradiance (0.44–2.55 mW/mm 2 ) was varied using constant current drive electronics with pulse-width modulation at 5 kHz. ‘LED-On’ trials included 7 s periods of continuous blue light illumination, interleaved with ‘no-stimulation’ trials in which no blue light was provided. Both LED-On and no-stimulation trials lasted 8 s. A minimum of 10 LED-On trials were acquired for each fish. LED and camera control were implemented using LabVIEW (National Instruments).
Assessment of visuomotor behaviours
Larvae were placed in a 35 mm petri dish filled with 3.5 ml of fish facility water. Visual stimuli were projected onto the arena from below using an AAXA P2 Jr Pico Projector via a cold mirror. Visual stimuli were designed using Psychophysics Toolbox ( Brainard, 1997 ). Looming stimuli expanded from 10 to 100° with L/V ratio of 255 ms ( Dunn et al., 2016 ). Optomotor gratings had a period of ∼10 mm and moved at one cycle/s. Optomotor gratings and looming spots were presented in egocentric coordinates such that directional gratings always moved 90° to left or right sides with respect to fish orientation and looming spots were centred 5 mm away from the body centroid and at 90° to left or right. Stimuli were presented in pseudo-random order with an inter-stimulus interval of minimum 60 s. Stimuli were only presented if the body centroid was within a predefined central region (11 mm from the edge of the arena). If this was not the case, a concentric grating was presented that moved towards the centre of the arena to attract the fish to the central region. At the beginning of each experiment, 60 Paramecia were added to arena. Each experiment typically lasted ~1 hr. Final Paramecia numbers were counted manually from full-frame video data from the final 10 s of each experiment and adjusted for consumption in 60 min [multiplying by 60/experiment duration (min)]. During experiments, eye and tail kinematics were tracked online as described below. Camera control, online tracking and stimulus presentation were implemented using LabVIEW (National Instruments) and MATLAB (MathWorks).
Analyses of free-swimming behaviour
Data analysis was performed using LabVIEW (National Instruments) and MATLAB (MathWorks). Eye and tail kinematics were tracked offline for optogenetic experiments, and online for assessment of visuomotor behaviours with some differences. First, images were background-subtracted using a background model generated over 8 s in which the larva was moving ( offline tracking ), or a continuously updated background model ( online tracking ). Next, images were thresholded and the body centroid was found by running a particle detection routine for binary objects within suitable area limits. For online tracking, eye centroids were detected using a second threshold and particle detection procedure with the requirement that these centroids were in close proximity to the body centroid. For offline tracking, eye centroids were detected using a particle detection procedure that uses both binary and greyscale images to identify the two centroids within suitable area limits that had the lowest mean intensity values. For online tracking, body and eye orientations were computed using second- and third-order image moments. For offline tracking, body orientation was computed as the angle of the vector formed by the centre of mass of the body centroid (origin) and the midpoint between the eye centroids. Eye orientation was computed as the angle between the major axis of the eye and the body orientation vector. Vergence angle was computed as the difference between the left and right eye angles. The tail was tracked by performing consecutive annular line-scans, starting from the body centroid and progressing towards the tip of the tail so as to define nine equidistant x-y coordinates along the tail. Inter-segment angles were computed between the eight resulting segments. Reported tail curvature was computed as the sum of these inter-segment angles. Rightward bending of the tail is represented by positive angles and leftward bending by negative angles. To identify periods of high ocular vergence, which represent hunting routines, a vergence angle threshold was computed for each fish by fitting a two-term Gaussian model to its vergence angle distribution. A fish was considered to be hunting if vergence angle exceeded this vergence threshold. For experiments assessing visuomotor behaviours, the vergence angle distribution was invariably bimodal and the vergence threshold was computed as one standard deviation below the centre of the higher angle Gaussian. For optogenetic experiments, in cases where the vergence angle distribution was not bimodal, a fixed vergence threshold of 55° was used. Optogenetic experiments Response probability was computed as the fraction of LED-On trials in which at least one hunting routine ( i.e. period with ocular vergence above threshold) was detected during the 7 s stimulation period. Similarly, for no-stimulation trials, response probability is the fraction of trials in which at least one hunting-like routine was detected. Response latency for LED-On trials was calculated from light stimulus onset. Swim bouts were identified using velocity thresholds (800°/s for bout onset, 200°/s for bout offset) applied to smoothed absolute tail angular velocity traces. Tail beat frequency was computed as the reciprocal of the mean full-cycle period during a swim bout. Tail vigour is computed by integrating absolute tail angular velocity (smoothed with a 40 ms box-car filter) over the first 120 ms of a swim bout. Bout asymmetry measures the degree to which tail curvature during a bout shows the same laterality as that determined during the first half-beat. It is computed as the fraction of time points in which the sign of tail angle matches the direction of the first half beat. This metric is high for hunting related J-turns but close to zero for forward swims. For each bout, the fraction of total curvature localised to the distal third of the tail was computed for the first half beat. To identify capture swim-like movements during optogenetically evoked hunting routines, movies were individually inspected and the following criteria were used to classify a swim bout as capture swim: (1) small change in body orientation associated with (2) divergence of the eyes and (3) jaw movement/suction and/or (4) dorsiflexion of the body.
Assessment of visuomotor behaviours
Escape responses to loom stimuli were identified if the instantaneous speed of the body centroid exceeded 75 mm/s. An optomotor response gradient [OMR turn rate (°/s)] was calculated for each presentation as the total change in orientation during the stimulus presentation divided by the duration of the presentation [for leftwards OMR stimuli, the OMR turn rate (typically negative) was multiplied by –1 to group the data with rightwards OMR stimuli]. Mean swim speed was calculated as the total distance covered by the larva in the central region of the arena divided by the total time spent in this region.
Optogenetic stimulation of AF7-pretectum in tethered larvae
Patterned illumination was delivered to the pretectum of tethered larvae using a custom-built digital micromirror device (DMD) rig. The DMD (Texas Instruments DLP LightCrafter 6500) was illuminated using a liquid light-guide coupled 470 nm LED (Mightex BLS-LCS-0470-50-22). A relayed image of the DMD was expanded and projected onto the sample plane of the objective (Zeiss N-Achroplan 20 × 0.5 NA) such that individual micromirrors were 0.46 × 0.46 µm at sample. Larvae, mounted in the same way as for calcium imaging, were imaged at 100 Hz under 850 nm illumination using a sub-stage FL3-U3-13Y3M-C camera (Point Grey). Trials were 10 s long and included a 4 s period of continuous blue light illumination of either the left or right AF7-pretectum (~75 × 75 µm target, 22.1 mW/mm 2 ). A minimum of 6 stimulation trials were performed for each target region. Movies were individually inspected to identify hunting-like events, which were defined by execution of saccadic eye convergence. The apparatus was controlled using LabVIEW (National Instruments). Laser ablations KalTA4u508 pretectal neurons were targeted for ablation in 6 dpf Tg(KalTA4u508;UAS:mCherry;elavl3:itTA;Ptet:ChR2-YFP) or Tg(KalTA4u508;UAS:mCherry;atoh7:GFP) larvae, which were anaesthetised using MS222 and mounted in 1% low-melting temperature agarose (Sigma-Aldrich). Ablations were performed using a MicroPoint system (Andor) attached to a Zeiss Axioplan-2 microscope equipped with a Zeiss Achroplan water-immersion 63 × 0.95 NA objective. A pulsed nitrogen-pumped tunable dye laser (Coumarin-440 dye cell) was focused onto individual KalTA4u508 neurons and pulses were delivered at a frequency of 10 Hz for 60–120 s. All visible KalTA4u508 neurons in both hemispheres were targeted for ablation and cell damage was confirmed under DIC optics. Larvae were then unmounted and allowed to recover overnight. Sham ablations of thalamic neurons were performed in 6 dpf Tg(gata2a:GFP;atoh7:GFP) larvae in a similar manner. The number of thalamic cells targeted for ablation was equivalent to the number of targeted KalTA4u508 pretectal neurons (10–16 per hemisphere). Non-ablated larvae were mounted in agarose and underwent the same manipulations except for laser-ablation. Pre- and post-ablation image stacks were acquired with a 2-photon microscope at 790 nm (800 × 800 px, 0.38 µm/px, ∼40 µm z-extent). Cell counting was performed manually in ImageJ using the multi-point tool.
Quantification and statistical analysis
Statistical analyses were performed in Prism 8 (GraphPad) and MATLAB R2017b (MathWorks). Statistical tests, p-values, N-values, and additional information are reported in Supplementary file 1 . All tests were two-tailed and were chosen after data were tested for normality and homoscedasticity. Data/resource sharing Data generated or analysed during this study are included in the manuscript and supporting files. Source data files have been provided for Figures 1 and 2 – 8 .
Experimental model and transgenic lines
Animals were reared on a 14/10 hr light/dark cycle at 28.5°C. For all experiments, we used zebrafish larvae homozygous for the mitfa w2 skin-pigmentation mutation ( Lister et al., 1999 ). Larvae used for pan-neuronal Ca 2+ imaging experiments were double-transgenic Tg(elavl3:H2B-GCaMP6s) jf5Tg ( Vladimirov et al., 2014 ) and Tg(atoh7:gapRFP) cu2Tg ( Zolessi et al., 2006 ). For AF7-pretectal Ca 2+ imaging, larvae were double-transgenic for Tg(–2.5pvalb6:KalTA4) u508Tg [ i.e. Tg(KalTA4u508 ); generated in this study, see below] and either Tg(UAS:GCaMP6f,cryaa:mCherry) icm06Tg ( Knafo et al., 2017 ) or Tg(UAS:jGCaMP7f) u341Tg (generated in this study, see below). Larvae used to determine whether KalTA4u508 -expressing neurons reside in AF7-pretectum were triple-transgenic Tg(KalTA4u508), Tg(UAS-E1b:NfsB-mCherry) jh17Tg ( Davison et al., 2007 ) and TgBAC(slc17a6b:loxP-DsRed-loxP-GFP) nns14Tg ( Koyama et al., 2011 ). Larvae used for AF7 dendritic stratification analyses were triple-transgenic Tg(KalTA4u508) , Tg(UAS:RFP) tpl2Tg ( Auer et al., 2014 ), and Tg(atoh7:GFP) rw021Tg ( Masai et al., 2003 ). Fish used for mapping of cell location in the adult pretectum were triple-transgenic Tg(KalTA4u508), Tg(UAS:GCaMP6f,cryaa:mCherry) icm06Tg and Tg(atoh7:gapRFP) cu2Tg . Larvae used for photo-activatable GFP labelling were Tg(Cau.Tuba1:c3paGFP) a7437Tg ( Bianco et al., 2012 ). Larvae used for single cell labelling and optogenetic stimulation of AF7-pretectal cells were double-transgenic Tg(KalTA4u508) and Tg(elavl3:H2B-GCaMP6s) jf5Tg . Larvae used for single-cell optogenetic stimulation of AF7-pretectal cells in blind fish were double-transgenic Tg(KalTA4u508) and Tg(atoh7:gapRFP) cu2Tg with homozygous mutation of the atoh7 th241 gene ( Kay et al., 2001 ). Blind atoh7 th241 homozygous fish were selected based on Tg(atoh7:gapRFP) cu2Tg expression being visible only in the eye but with no RGC projections in the brain. Larvae used for patterned optogenetic stimulation of the AF7-pretectal population were double-transgenic Tg(KalTA4u508) and Tg(UAS:CoChR-tdTomato) u332Tg (generated in this study, see below). Larvae used for pretectal cell ablations and free-swimming behaviour analyses were triple-transgenic Tg(KalTA4u508), Tg(UAS-E1b:NfsB-mCherry) jh17Tg ( Davison et al., 2007 ) and Tg(elavl3:ITETA-PTET:Cr.Cop4-YFP) fmi2Tg ( Fajardo et al., 2013 ). Larvae used for assessment of AF7 axonal arborisations following ablation of KalTA4u508 pretectal neurons were triple-transgenic Tg(KalTA4u508), Tg(UAS-E1b:NfsB-mCherry) jh17Tg and Tg(atoh7:GFP) rw021Tg . Larvae used for sham ablations of thalamic cells were double-transgenic Tg(gata2a:GFP) pku2Et ( Wen et al., 2008 ) and Tg(atoh7:GFP) rw021Tg . Larvae used for optogenetic stimulation of the avOT were double-transgenic Tg(atoh7:gapRFP) cu2Tg and Tg(elavl3:ITETA-PTET:Cr.Cop4-YFP) fmi2Tg with either homozygous, heterozygous or no mutation of the atoh7 th241 gene. All larvae were fed Paramecia from 4 dpf onward. Animal handling and experimental procedures were approved by the UCL Animal Welfare Ethical Review Body and the UK Home Office under the Animal (Scientific Procedures) Act 1986.
Additional files 10.7554/eLife.48114.031 Supplementary file 1. Regression and statistical details. Spreadsheet containing details of statistical analyses (test used, test statistic, values of N, centre and spread), and description of kinematic regressors. 10.7554/eLife.48114.032 Supplementary file 2. Anatomical mask – avOT. TIFF stack containing binary mask defining the ‘avOT’ anatomical region, in ZBB space. 10.7554/eLife.48114.033 Supplementary file 3. Anatomical mask – AF7-pretectum. TIFF stack containing binary mask defining the ‘AF7-pretectum’ anatomical region, in ZBB space. 10.7554/eLife.48114.034 Supplementary file 4. Anatomical mask – NI chata. TIFF stack containing binary mask defining the ‘NI chata’ anatomical region, in ZBB space. 10.7554/eLife.48114.035 Transparent reporting form
📊 Figures
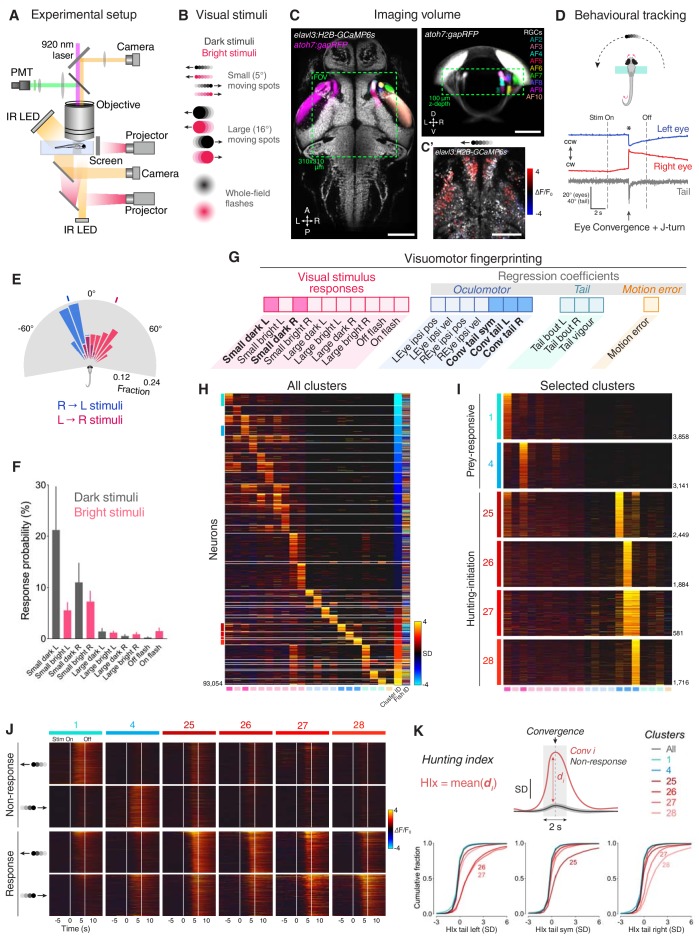
Figure 1.
Neural activity associated with hunting.
( A ) 2-photon GCaMP imaging combined with behavioural tracking during virtual hunting behaviour (see Materials and methods). ( B ) Schematic of visual stimuli. ( C ) elavl3:H2B-GCaMP6s;atoh7:gapRFP r...
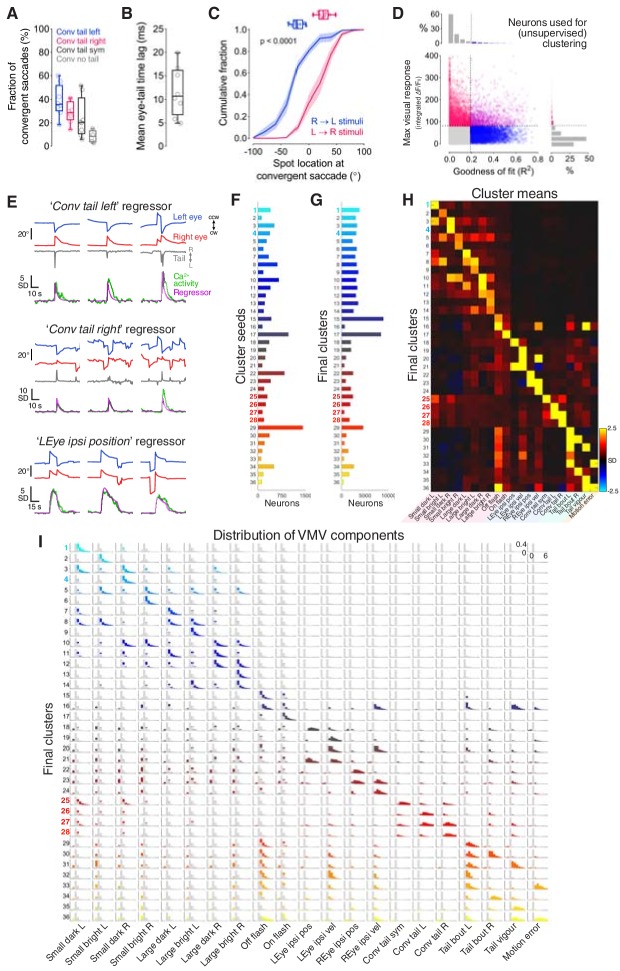
Figure 1u2014figure supplement 1.
Behavioural and clustering analyses.
( A ) Fraction of convergent saccades associated with leftwards, rightwards, symmetrical or no tail movement. ( B ) Mean time from convergent saccade to tail movement, per fish. ( C ) Cumulative distr...
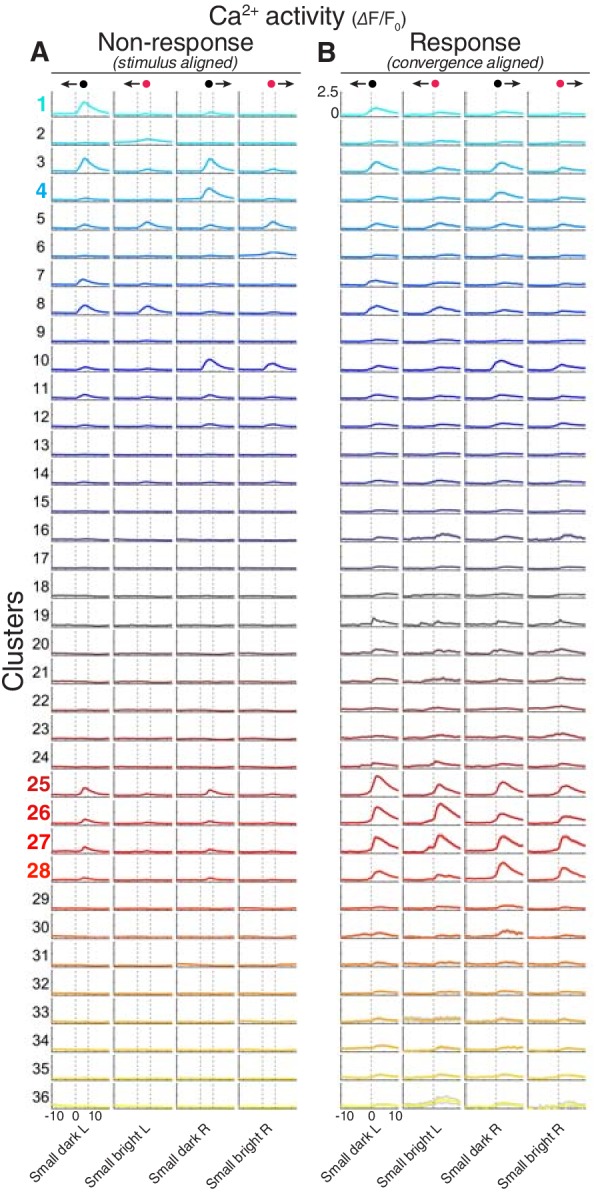
Figure 1u2014figure supplement 2.
Stimulus and motor-triggered calcium responses.
( Au2013B ) Visual stimulus-aligned ( A ) and eye convergence-aligned ( B ) u0394F/F 0 responses for all 36 clusters. Responses are shown for small moving spots (dark/bright moving leftwards/rightward...
Video 1.
Z-stack of transgenic line used for calcium imaging with annotated RGC arborisation fields.
Imaging volume (z-stack) of 6 dpf elavl3:H2B-GCaMP6s;atoh7:gapRFP brain (mean of Nu00a0=u00a03 fish) with labelled RGC arborisation fields (AFs). The green channel shows the elavl3:H2B-GCaMP6s referen...
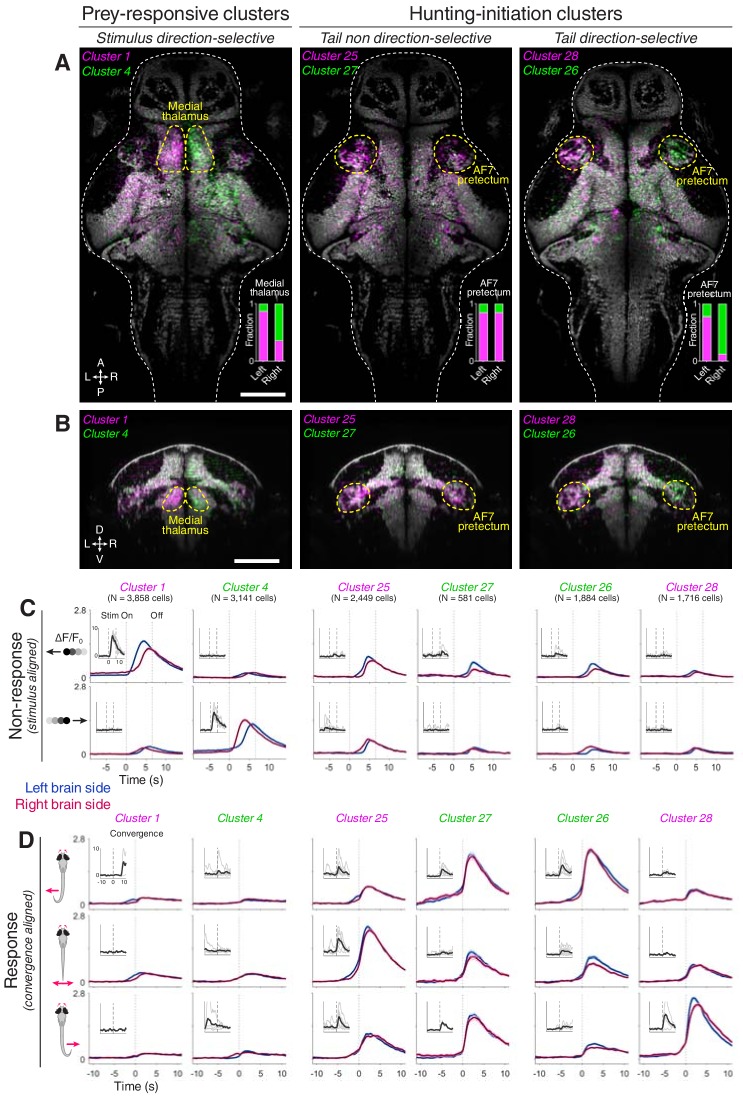
Figure 2.
AF7-pretectum contains a high density of hunting initiation neurons.
( A ) Anatomical maps of prey-responsive clusters (left) and hunting-initiation clusters (middle and right). Images show dorsal views of intensity sum projections of all neuronal masks in each cluster...
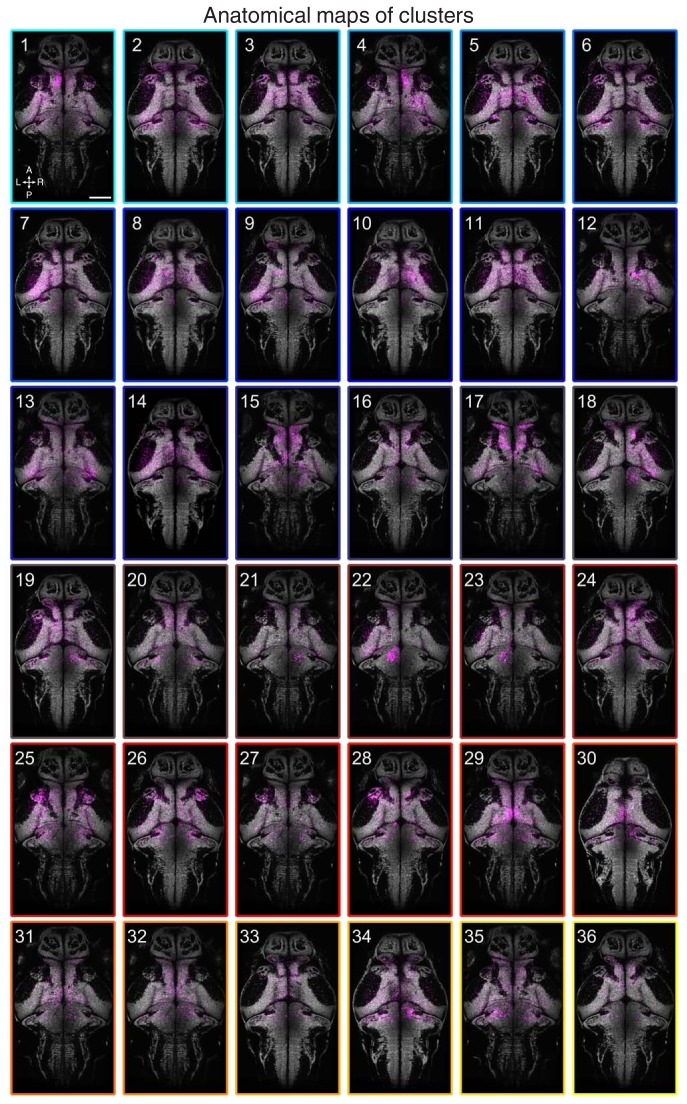
Figure 2u2014figure supplement 1.
Anatomical maps of clusters.
Images show dorsal views of intensity sum projections of all neuronal masks in each cluster (magenta) after registration to the elavl3:H2B-GCaMP6s reference brain. Projections (obtained through all fo...
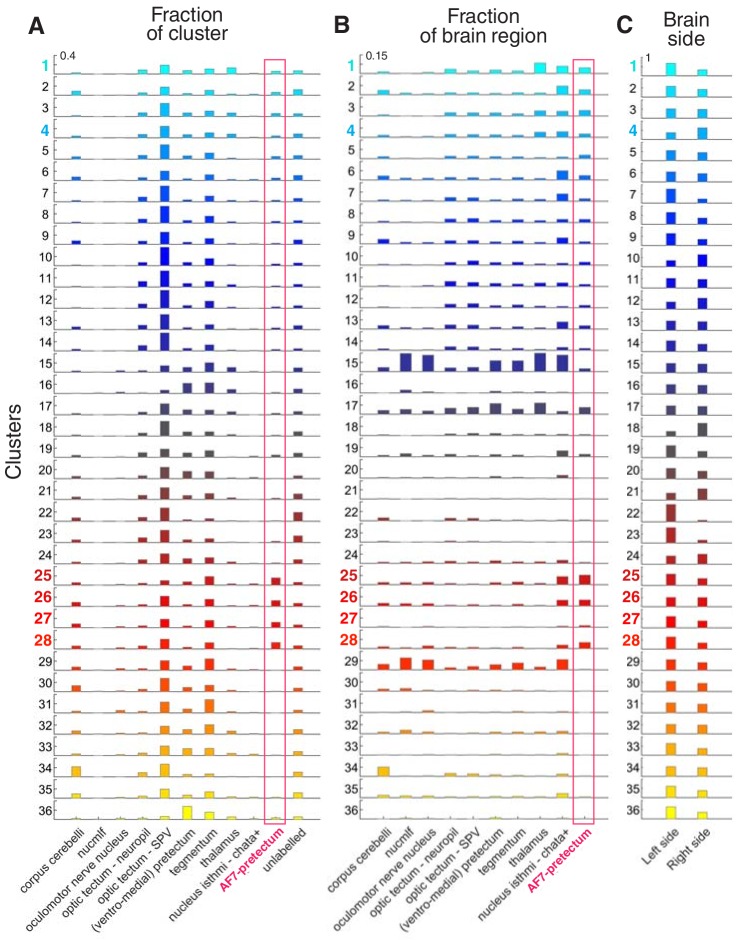
Figure 2u2014figure supplement 2.
Anatomical locations of clustered neurons.
( A ) Anatomical location of clusters (Nu00a0=u00a08 fish). The fraction of cells in each cluster falling within each ZBB anatomical region is shown. Red box highlights AF7-pretectum. Y-axis ranges fr...
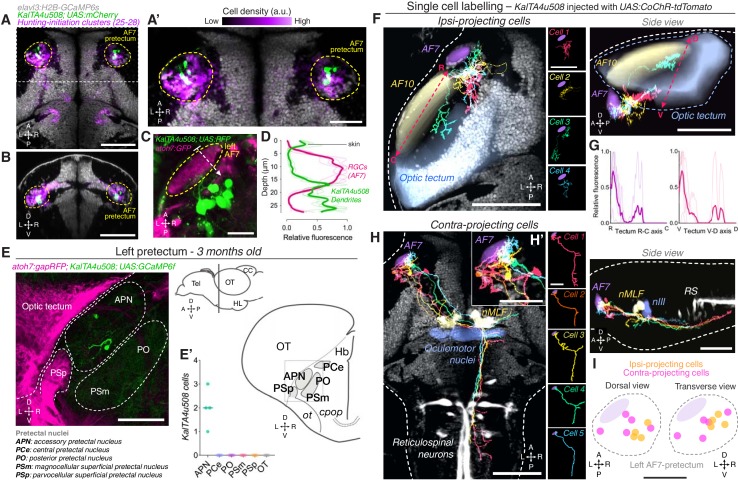
Figure 3.
AF7-pretectal neurons with distinct projection patterns labelled by KalTA4u508 .
( A ) Dorsal view of KalTA4u508;UAS:mCherry expression at 6 dpf (green) registered to the elavl3:H2B-GCaMP6s reference brain (grey). Neurons of all four hunting-initiation clusters combined are shown ...
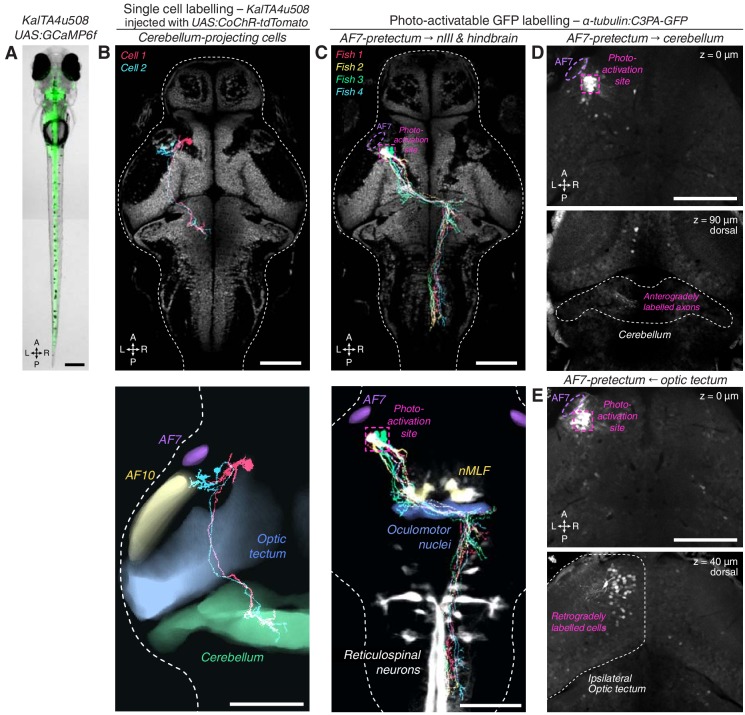
Figure 3u2014figure supplement 1.
KalTA4u508 neurons innervating cerebellum, and PA-GFP projection mapping from AF7-pretectum.
( A ) Expression pattern of the KalTA4u508 transgene, illustrated by a KalTA4u508;UAS:GCaMP6f transgenic larva (6 dpf). ( B ) Tracings of KalTA4u508 neurons projecting to ipsilateral medial corpus cer...
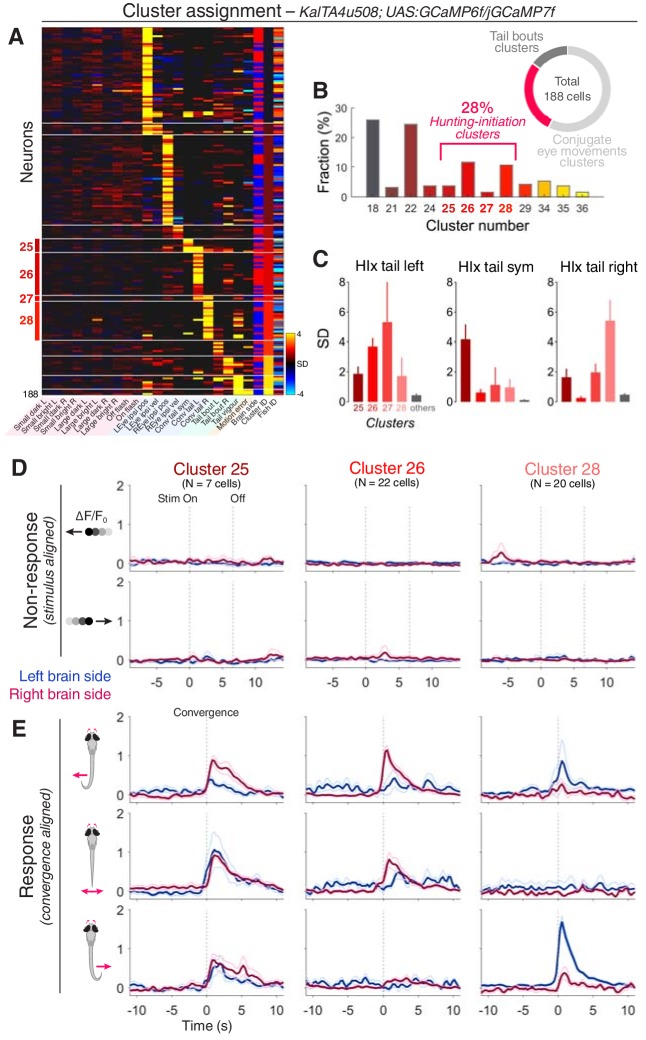
Figure 4.
KalTA4u508 pretectal neurons are active during hunting initiation.
( A ) VMVs of KalTA4u508 neurons with assigned cluster identities (Nu00a0=u00a0188 neurons from 30 fish). Cell location (blue for left hemisphere, red for right) is reported by the u2018Brain sideu201...
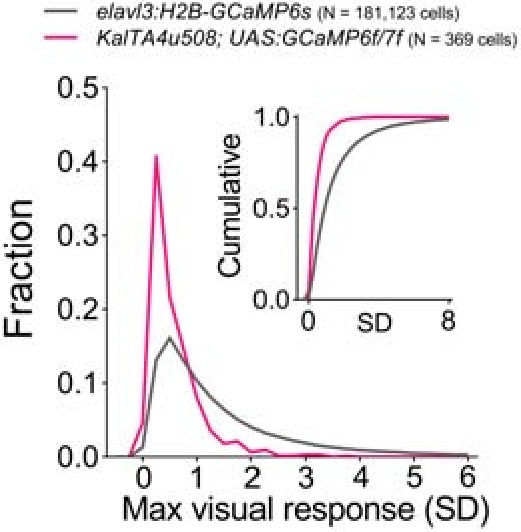
Figure 4u2014figure supplement 1.
Visual responses and activity during spontaneous convergences of KalTA4u508 pretectal neurons.
Distributions of maximum responses across visual stimuli for all recorded neurons in 6u20137 dpf elavl3:H2B-GCaMP6s larvae (grey, Nu00a0=u00a0181,123 cells from eight fish) and KalTA4u508;UAS:GCaMP6f,...
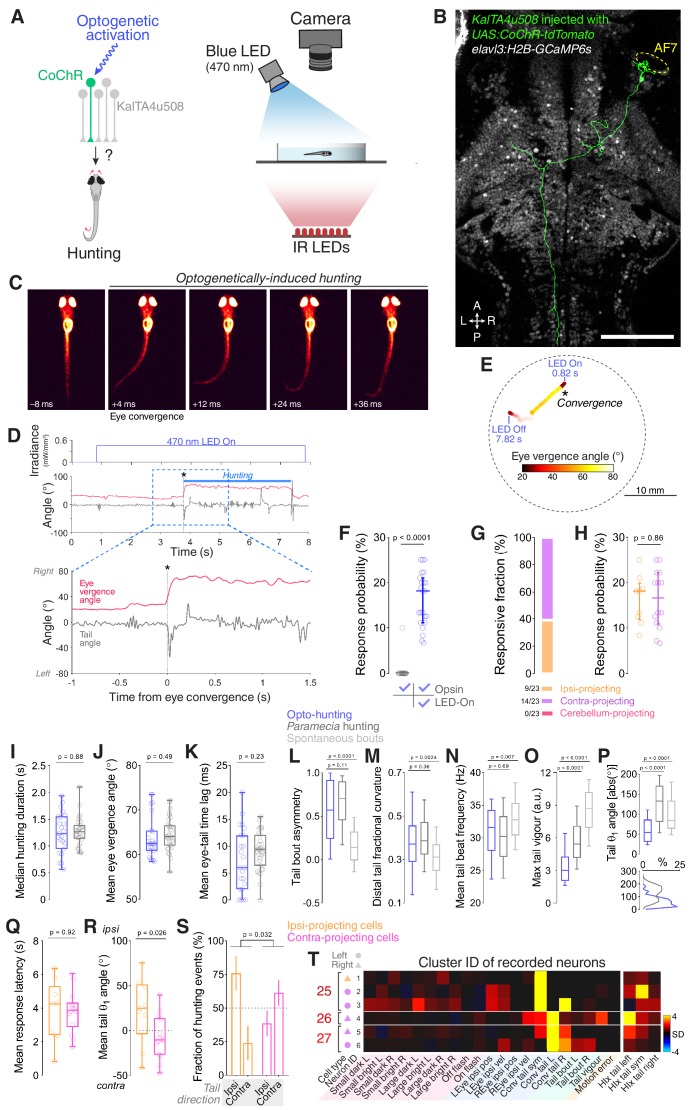
Figure 5.
Optogenetic stimulation of single KalTA4u508 pretectal neurons induces hunting.
( A ) Optogenetic stimulation of single neurons paired with behavioural tracking. ( B ) A single KalTA4u508 neuron in a 7 dpf KalTA4u508;elavl3:H2B-GcaMP6s larva that was injected at the one-cell stag...
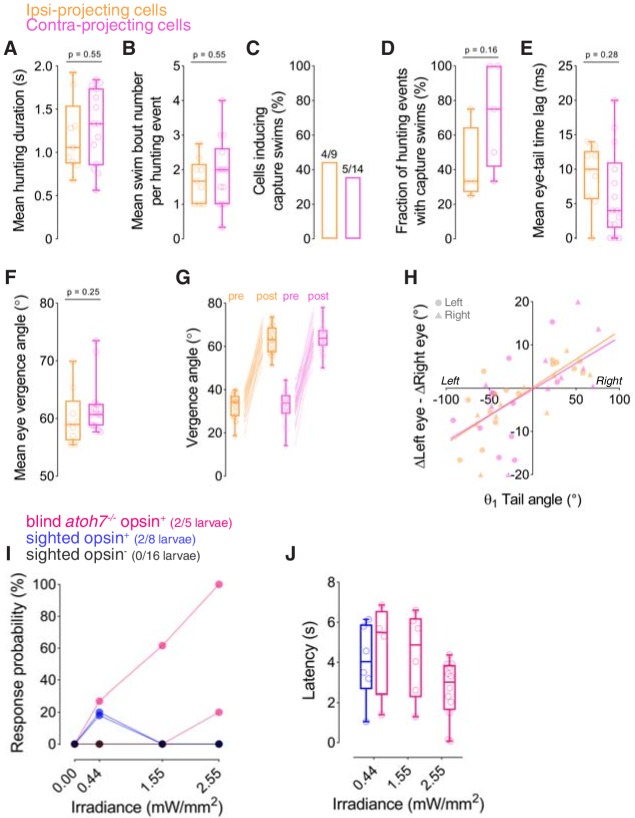
Figure 5u2014figure supplement 1.
Behavioural kinematics of optogenetically induced hunting and responses at increased irradiance.
( Au2013H ) Behavioural kinematics for hunting events evoked by optogenetic stimulation of single ipsi-projecting (orange, Nu00a0=u00a09 cells) and contra-projecting KalTA4u508 neurons (magenta, Nu00a...
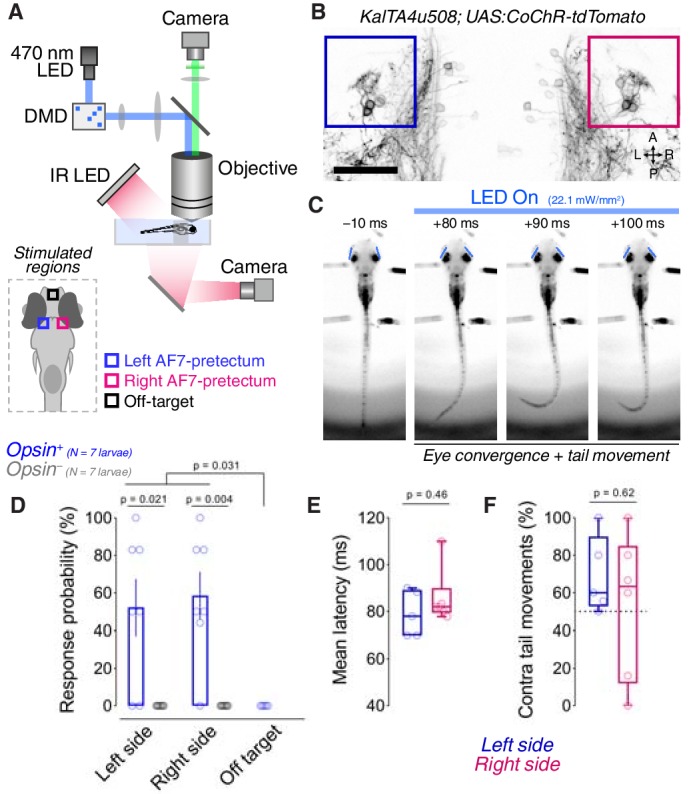
Figure 5u2014figure supplement 2.
Optogenetic stimulation of the KalTA4u508 pretectal population induces hunting with short latency.
( A ) Digital micromirror device (DMD) setup used for patterned illumination of pretectum and behavioural tracking in partially tethered larvae. ( B ) Opsin expression in a 6 dpf KalTA4u508;UAS:CoChR-...
Video 2.
Hunting behaviour evoked by optogenetic stimulation of a single KalTA4u508 pretectal neuron.
Data from a 6 dpf larva in which a single ipsi-projecting KalTA4u508 neuron, located in the left AF7-pretectum (Cell 4 in Figure 3F ), expressed CoChR. Tracking data is reported in Figure 5D,E . The v...
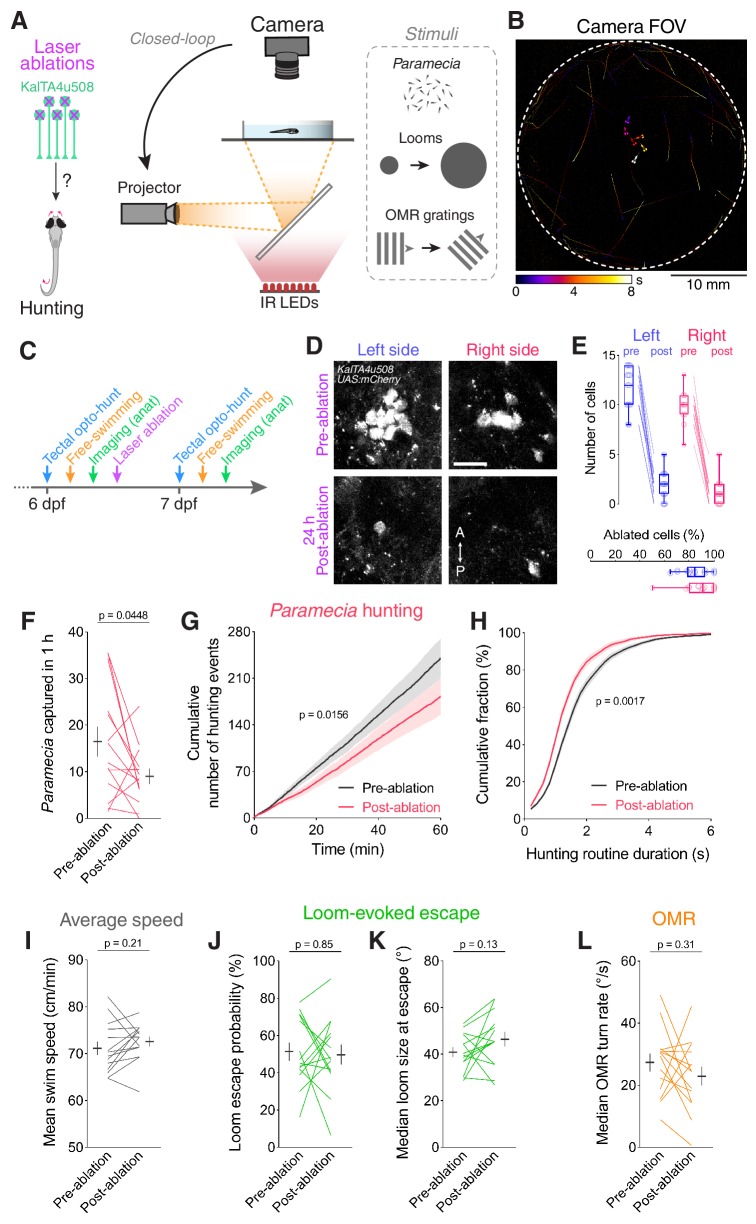
Figure 6.
Ablation of KalTA4u508 pretectal neurons impairs hunting.
( A ) Laser ablation of KalTA4u508 pretectal neurons and assessment of visuomotor behaviours. ( B ) Time-projection of larval behaviour (duration 8 s) showing trajectories of Paramecia and larval zebr...
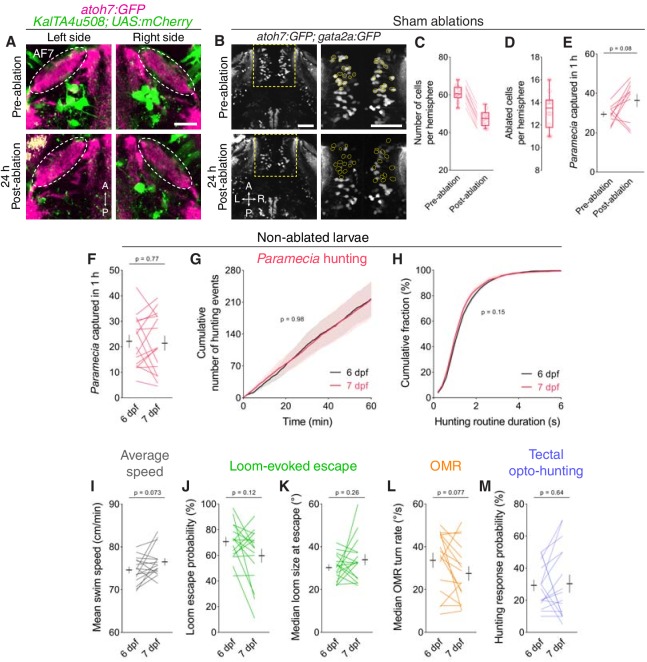
Figure 6u2014figure supplement 1.
Assessment of visuomotor behaviours in control larvae.
( A ) RGC axonal arborisations in AF7 (magenta) before (top, 6 dpf) and 24 hr after (bottom, 7 dpf) bilateral laser-ablation of KalTA4u508 pretectal neurons (green) in a KalTA4u508;UAS:mCherry;atoh7:G...
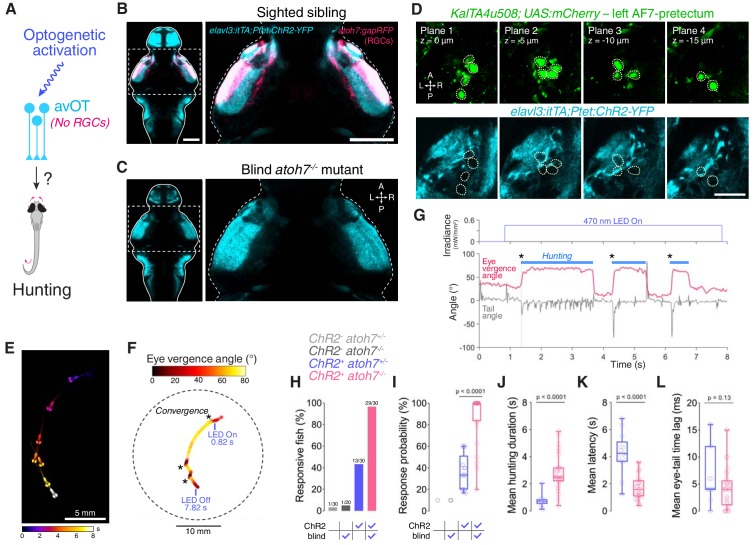
Figure 7.
Optogenetic stimulation of avOT induces hunting in the absence of RGCs.
( A ) Optogenetic stimulation of anterior-ventral optic tectum (avOT). ( Bu2013C ) Dorsal view of ChR2-YFP expression in sighted ( B ) and blind atoh7 -/- ( C ) 6 dpf elavl3:itTA;Ptet:ChR2-YFP;atoh7:g...
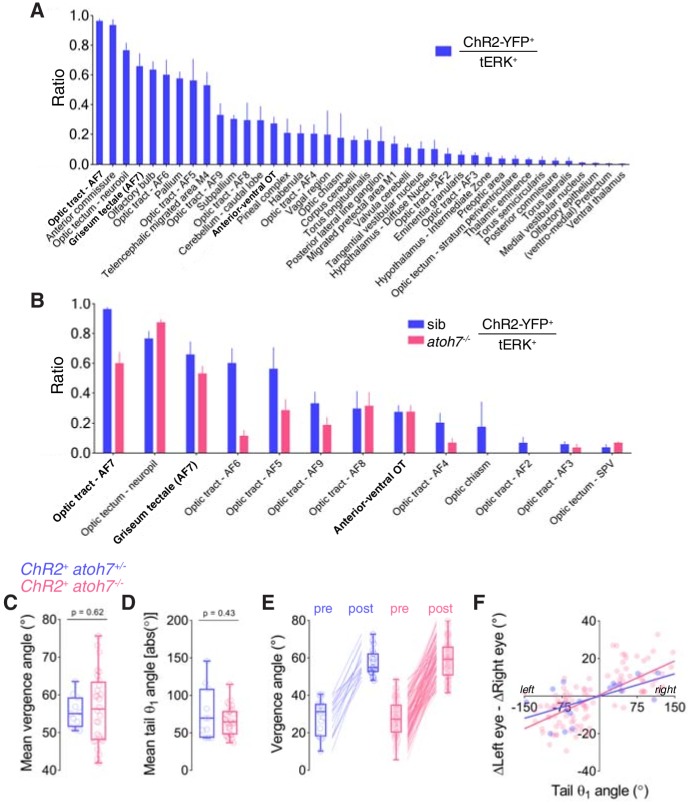
Figure 7u2014figure supplement 1.
ChR2 expression in elavl3:itTA;Ptet:ChR2-YFP;atoh7:gapRFP larvae and additional behavioural kinematics of optogenetically induced hunting.
( A ) Overlap between ChR2-YFP and tERK immunostain in elavl3:itTA;Ptet:ChR2-YFP larvae, computed as ratio between ChR2-YFP-positive voxels and tERK-positive voxels in each brain region. Mean + SEM va...
Video 3.
Hunting behaviour evoked by optogenetic stimulation of the anterior-ventral optic tectum in a blind larva.
Optogenetically induced hunting behaviour in a blind atoh7 -/- 6 dpf elavl3:itTA;Ptet:ChR2-YFP;atoh7:gapRFP larva. Tracking data is reported in Figure 7Eu2013G . The video was acquired at 250 frames p...
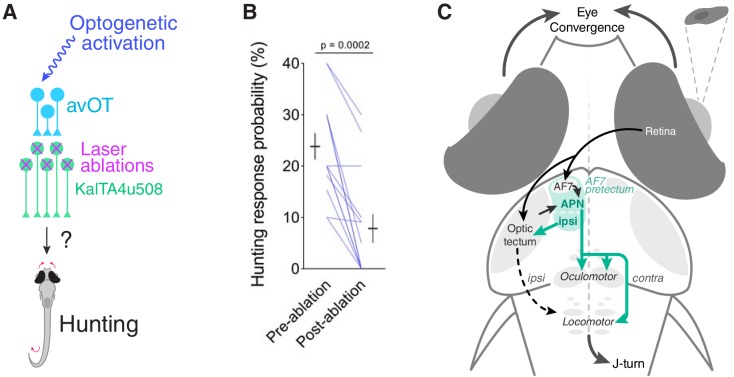
Figure 8.
KalTA4u508 pretectal neurons are required for tectally induced hunting.
( A ) Optogenetic stimulation of avOT before and after ablation of KalTA4u508 pretectal neurons. ( B ) Hunting response probability upon optogenetic stimulation of KalTA4u508;UAS:mCherry;elavl3:itTA;P...
Figure images are served from the NIH/NLM PubMed Central Open Access Subset or Europe PMC; copyright remains with the publishers and authors.
💬 Discussion
0 commentsNo comments yet. Be the first to start a discussion!
Leave a Comment